

Abstract
On the basis of the genotypic/phenotypic data from Chinese Longitudinal Healthy Longevity Survey (CLHLS) and Cox proportional hazard model, the present study demonstrates that interactions between carrying FOXO1A-209 genotypes and tea drinking are significantly associated with lower risk of mortality at advanced ages. Such a significant association is replicated in two independent Han Chinese CLHLS cohorts (p = 0.028–0.048 in the discovery and replication cohorts, and p = 0.003–0.016 in the combined dataset). We found the associations between tea drinking and reduced mortality are much stronger among carriers of the FOXO1A-209 genotype compared to non-carriers, and drinking tea is associated with a reversal of the negative effects of carrying FOXO1A-209 minor alleles, that is, from a substantially increased mortality risk to substantially reduced mortality risk at advanced ages. The impacts are considerably stronger among those who carry two copies of the FOXO1A minor allele than those who carry one copy. On the basis of previously reported experiments on human cell models concerning FOXO1A-by-tea-compounds interactions, we speculate that results in the present study indicate that tea drinking may inhibit FOXO1A-209 gene expression and its biological functions, which reduces the negative impacts of FOXO1A-209 gene on longevity (as reported in the literature) and offers protection against mortality risk at oldest-old ages. Our empirical findings imply that the health outcomes of particular nutritional interventions, including tea drinking, may, in part, depend upon individual genetic profiles, and the research on the effects of nutrigenomics interactions could potentially be useful for rejuvenation therapies in the clinic or associated healthy aging intervention programs.
Introduction
Various studies have shown that, in addition to direct effects of environmental and genetic factors on health and mortality, interactions between genotypes and environmental factors (G×E) play a crucial role in health outcomes because environmental factors may modulate gene expression, which then influences health and longevity.1,2 The Institute of Medicine (IOM) Committee recommends in their widely-cited report: “…to expand our knowledge of how to improve the health of individuals and populations, it becomes imperative to conduct research that explores the effects of interactions among social, behavioral and genetic factors on health”.1
Prior research has shown that two single-nucleotide polymorphisms (SNPs) of the FOXO1A gene, located on chromosome 13, were associated with longevity in the Han Chinese population.3 FOXO1A genetic variants have also been linked to longevity in the Framingham cohort in the United States4 and in the Leiden 85-plus study.5
Dietary habits are important behavioral/environmental factors in peoples' daily lives. Especially among Chinese people, whether (and how often) to drink tea may be a critical dietary factor. Accumulating data from various studies indicates tea drinking improves health and reduces the risk of mortality and age-associated chronic diseases, such as inflammation7 and stroke.6 Tea drinking also reduces depressive symptoms in old adults in rural China8 and is associated with better cognitive function in Chinese elderly in Singapore9 and in the oldest-old in China.10
Specific to mortality, evidence from animal model studies suggests that compounds in tea can increase life span.11 Longitudinal or cohort studies from Japan reported that tea consumption was associated with reduced risk of mortality from cardiovascular diseases12 and cancer.13 A recent study based on the Chinese Longitudinal Healthy Longevity Survey (CLHLS) data also showed that tea drinking was significantly associated with reduced mortality among the oldest-old aged 80+.14 Other research based on CLHLS data discovered that the G × E interaction between the FOXO1A-rs2755209 (abbreviated as FOXO1A-209 hereafter) genotype and regular exercise was significantly associated with reduced mortality risk at advanced ages 92 and over by 31–32% (p < 0.05), adjusted for various co-variates.15
Previous G × E studies have shown that the effects of tea consumption on diseases vary by genotypes.16,17 On the basis of human cell experiments, Anton et al. showed that the tea polyphenol epigallocatechin gallate (EGCG) mimics insulin action on the transcription factor FOXO1A and elicits cellular responses in the presence and absence of insulin; thus, the intake of tea compounds inhibits FOXO1A gene expression and its biological functions.18 Belguise et al. reported that intake of green tea EGCG activated FOXO3A gene expression, which in turn induced estrogen receptor-α (ERα) expression and reversed the invasive phenotype of breast cancer cells in mice.19 It was reported that tea consumption is associated with longer telomere length in elderly Chinese men.20 A recent study demonstrated that G × E interactions between carrying one of the SNPs of FOXO1A-rs17630266, FOXO3A-rs2253310 or FOXO3A-rs2802292 and tea drinking were significantly associated with lower risk of cognitive disability at advanced ages.21However, we are not aware of any studies of the effects of G × E interactions between the FOXO1A genotype and tea drinking on mortality in human populations.
Given the important roles of tea compounds in studies of the health outcomes of humans, the association of the FOXO1A SNP with longevity, the FOXO1A-by-tea interaction effects in human cell experiments, and the effects of FOXO1A-209-by-regular exercise interaction on mortality at advanced ages in China as reviewed above, we posed a hypothesis to be tested in the present study, that is, G × E interactions between carrying the SNP of FOXO1A-209 gene and tea drinking could be significantly associated with reduced mortality risk in Chinese oldest-old.
Previous studies have indicated that, in general, genetic and G × E impacts on health and mortality are more profound at advanced ages.22,23 Moreover, the oldest-old population, which is more likely to need care assistance, has been increasing much more rapidly than younger age groups in a multitude of countries. For example, on the basis of United Nations population projections, the average annual growth rates from 2010 to 2050 for the oldest-old aged 90 or over are 3.6% and 4.0%, in contrast to 1.8% and 2.7% for the elderly aged 65–89 in the United States and China, respectively.24 These data imply that focusing on the oldest-old is a useful way to investigate G × E effects on healthy aging and longevity for public health programs. However, almost all previous studies in this field have focused on young-old or middle-aged adults; few studies have had large enough numbers of oldest-old subjects to gain the necessary statistical power to carry out meaningful analyses. The objective of the present study is to make a significant contribution to the field based on an unusually large sample of oldest-old with both genetic and environmental data.
Data Sources, Measurements, and Methods
Data sources
The CLHLS, which provided data for the present study, has been collecting a comprehensive data set from the oldest-old and compatible younger elders since 1998. The CLHLS surveys have been conducted in a randomly selected half of the counties and cities in 23 out of 31 provinces in China, with replacement for deceased elders, namely, new participants were recruited to replace those who died after last interview in each of the waves from 1998 to 2008–2009. The 23 provinces where CLHLS has been conducted cover about 85% of the total population of China. Extensive data were collected in CLHLS using internationally standardized questionnaires adapted to the Chinese cultural and social context. Careful evaluations, including reliability coefficients, factor analysis, age reporting at the oldest-old ages, genetic, and G × E analyses, have shown that the data (including mortality and genotypic data) quality of CLHLS surveys is reasonably good.3,15,21,25–28
Our analyses are based on genotypic and phenotypic data from two independent CLHLS cohorts to facilitate discovery and replication. (1) Cohort 1998 consists of 810 oldest-old, aged 91+, interviewed in the 1998 initial baseline survey of the CLHLS and its subsequent follow-up surveys conducted in 2000, 2002, 2005, 2008–2009, and 2011–2012. Dates of death were collected for the 99.7% of individuals who died before the CLHLS 2011–2012 wave. (2) Cohort 2008–2009 consists of 1671 oldest-old aged 91+ interviewed in the CLHLS 2008–2009 wave and its subsequent follow-up surveys conducted in 2011–2012. Dates of death were collected for the 55.7% of individuals who died before the CLHLS 2011–2012 wave. There is no overlap between the CLHLS participants in Cohort 1998 and Cohort 2008–2009, and there are no familial/kinship relations among the participants within and across the cohorts. Thus, these two cohorts are totally independent study samples for discovery (Cohort 1998) and replication (Cohort 2008–2009). All of the participants from these two cohorts belong to the same ethnic group of Han Chinese living in one country within the same culture; thus, we also performed a combined analysis including all members of Cohort 1998 and Cohort 2008–2009.
The FOXO1A-209 genotypic data from Cohort 1998 were produced by genotyping the DNA samples from the CLHLS participants at the laboratory of the Institute of Molecular Medicine at Peking University; analyses of the genotypic data, including quality control procedures, single SNP association analysis, genotype association analysis, linkage disequilibrium, and haplotype association analysis, were presented in Li et al.3 and are not repeated here. The FOXO1A-209 genotypic data of Cohort 2008–2009 were drawn from the CLHLS genome-wide association study (GWAS) dataset, which was most recently produced by the Beijing Genomics Institute (BGI), and the BGI genotyping quality control procedures of the CLHLS GWAS (including computing identity-by-state probabilities for all subjects to search for and to exclude any kinship-related individuals among the samples) are presented in section M2 of Methods in reference 29.
Dependent variable
Mortality information on date of death was collected in the CLHLS follow-up surveys from interviews with a close family member for participants who were interviewed in the CLHLS wave(s) but died afterward. The survival time of the subjects analyzed in this study was entered as days counted from the date of the initial interview in 1998 or 2008–2009 to the date of death or censoring at the time of the 2010–2011 interview for those who were still alive. We controlled for respondent's exact age in the 1998 or 2008–2009 survey.
Main explanatory variables: FOX01A genotype and tea drinking
FOXO1A genotype
We explored G × E interactions between tea drinking and the FOXO1A genotype (carrying the SNP of FOXO1A-209) following the additive, recessive, and dominant models. In the additive model, a genotype that contains zero, one, or two copies of the minor allele is coded as 0, 1, or 2. In the recessive model, a genotype that contains two copies of the minor allele is coded as 1; otherwise a genotype that does not contain or contains only one copy of the minor allele is coded as 0. In a dominant model, any genotype that contains one or two copies of the minor allele is coded as 1; otherwise, a genotype that does not contain any copy of the minor allele is coded as 0.
Tea drinking
CLHLS respondents were asked: Do you drink tea regularly? Response categories were “almost every day,” “sometimes,” and “rarely or never.” We defined “tea drinking” as a binary variable and as an ordered variable. The binary tea drinking variable is coded as 1 if the answer is “almost every day” or “sometimes,” and coded as 0 otherwise. The ordered tea drinking variable is coded as 0 for “rarely or never,” 1 for “sometimes,” or 2 for “almost every day.”
Other co-variates
Other co-variates controlled in our multiple statistical models included gender, exact age at time of the DNA sample collection, residence (rural vs. urban), education (<1 year of schooling vs. ≥1 year of schooling; note that education level among those oldest-old Chinese cohorts was extremely low, only 18.1% of the participants had 1+ years of schooling; see Table 1), marital status (currently married vs. unmarried including never-married, divorced, or widowed), regular exercise (yes vs. no), smoking (yes vs. no), and alcohol drinking (yes vs. no). We also adjusted for the groups of 1998 cohort and 2008–2009 cohort in the combine analysis.
Table 1.
Descriptive Statistics for the Main Explanatory Variables and Co-Variates
| % or mean | |||
|---|---|---|---|
| Variables | Combined | Cohort 1998 | Cohort 2008–2009 |
| Main explanatory variables | |||
| Carrying FOXO1A-209 minor allele status | |||
| 0 copy | 58.4% | 58.9% | 58.2% |
| 1 copy | 35.4% | 34.6% | 35.7% |
| 2 copies | 6.3% | 6.5% | 6.1% |
| Drink tea at present time | |||
| Almost everyday | 21.6% | 19.6% | 20.3% |
| Sometimes | 13.5% | 17.1% | 15.6% |
| Rarely or never | 64.9% | 63.3% | 64.1% |
| Co-variates | |||
| Males | 25.0% | 22.7% | 26.1% |
| Average age | 100.0 | 100.9 | 99.6 |
| Urban residents | 34.5% | 28.3% | 37.5% |
| 1+ year of schooling | 18.1% | 16.5% | 18.9% |
| Regular exercise | 23.3% | 23.6% | 23.1% |
| Smoking in recent 5 years | 11.1% | 11.7% | 10.8% |
| Currently drink alcohol | 17.3% | 23.0% | 14.6% |
| Number of participants | 2481 | 810 | 1671 |
The statistical frequency distributions of the main explanatory variables and co-variates are presented in Table 1.
Statistical analysis
To examine associations of explanatory variables with mortality risk, we employed multiple proportional hazards regression model analysis with survival time and mortality as the dependent variable. The assumption of proportionality of the hazards was assessed and met the requirement for all of the models analyzed. To examine interaction effects, we followed the standard Aiken and West procedure to examine whether the interaction terms included in the regressions are statistically significant and whether model fit is significantly better when the interaction term is included.30 The results of these additional likelihood ratio and chi-squared tests are listed in the last three rows of Table 2 and are consistent with the p value estimates of the interaction terms. The significant results of these additional tests also imply that the likelihood of a Type I error in our estimates of the interaction terms is small.31 The analyses were performed using Stata/SE 12.0.
Table 2.
Mortality Risk (Hazard Ratios) at Advanced Ages Based on the Cox Proportional Hazards Model Estimates
| Cohort | Cohort 1998 | Cohort 2008–2009 | Two cohorts combined | |||||||||
|---|---|---|---|---|---|---|---|---|---|---|---|---|
| Model | A-I | A-II | A-III | A-IV | B-I | B-II | B-III | B-IV | C-I | C-II | C-III | C-IV |
| FOXO1A-209, recessive = 1(0)c | 1.159 | 1.137 | 1.315* | 1.288 | 1.253* | 1.229* | ||||||
| FOXO1A-209, additive | 1.008 | 1.022 | 1.067 | 1.048 | 1.045 | 1.041 | ||||||
| Drink tea, Yes (no) | 1.060 | 1.064 | 0.972 | 1.091 | 1.004 | 1.073 | ||||||
| Drink tea, ordered variable | 1.006 | 1.023 | 0.977 | 1.032 | 0.988 | 1.029 | ||||||
| G × E interactions | ||||||||||||
| (FOXO1A-209, recessive) × (Drink tea, binary variable) | 0.456**a (0.037)b |
0.452** (0.028) |
0.466*** (0.003) |
|||||||||
| 95% Confidence Interval | 0.22,0.95 | 0.22,0.92 | 0.28, 0.77 | |||||||||
| (FOXO1A-209, recessive) × (Drink tea, ordered variable) | 0.662** (0.048) |
0.653** (0.042) |
0.665*** (0.005) |
|||||||||
| 95% Confidence Interval | 0.44,1.00 | 0.43,0.98 | 0.50, 0.89 | |||||||||
| (FOXO1A-209,additive) × (Drink tea, binary variable) | 0.898 (0.424) |
0.711*** (0.018) |
0.794** (0.012) |
|||||||||
| 95% Confidence Interval | 0.69,1.17 | 0.55,0.91 | 0.66,0.95 | |||||||||
| (FOXO1A-209, additive) × (Drink tea, ordered variable) | 0.918 (0.265) |
0.841** (0.018) |
0.876** (0.013) |
|||||||||
| 95% Confidence interval | 0.79,1.07 | 0.73,0.97 | 0.79, 0.97 | |||||||||
| Co-variates | ||||||||||||
| Male (female) | 1.141 | 1.136 | 1.128 | 1.128 | 1.337*** | 1.340*** | 1.347*** | 1.346*** | 1.252*** | 1.253*** | 1.256*** | 1.255*** |
| Age | 1.078*** | 1.078*** | 1.076*** | 1.076*** | 1.101*** | 1.101*** | 1.100*** | 1.100*** | 1.093*** | 1.093*** | 1.093*** | 1.093*** |
| Urban (rural) | 1.151 | 1.146 | 1.122 | 1.124 | 0.824** | 0.827** | 0.826** | 0.830** | 0.941 | 0.943 | 0.937 | 0.939 |
| 1+ year of schooling (0) | 0.967 | 0.966 | 0.970 | 0.974 | 1.073 | 1.071 | 1.072 | 1.071 | 1.014 | 1.012 | 1.014 | 1.014 |
| Regular exercise (no) | 0.771*** | 0.777*** | 0.781** | 0.784** | 0.798** | 0.798** | 0.789*** | 0.790*** | 0.786*** | 0.787*** | 0.782*** | 0.784*** |
| Smoke in recent 5 years (no) | 1.089 | 1.099 | 1.079 | 1.080 | 0.957 | 0.956 | 0.951 | 0.954 | 0.994 | 0.996 | 0.980 | 0.982 |
| Currently drink alcohol (no) | 1.011 | 1.017 | 1.011 | 1.018 | 1.044 | 1.044 | 1.041 | 1.040 | 1.025 | 1.029 | 1.022 | 1.026 |
| Cohort 1998 (no) | — | — | — | — | — | — | — | — | 1.296*** | 1.297*** | 1.296*** | 1.299*** |
| –2LL (–2 log Likelihood)d | 7304.4 (7309.1) |
7304.7 (7309.0) |
7308.9 (7309.5) |
7308.0 (7309.3) |
11355.9 (11361.4) |
11356.4 (11361.2) |
11353.7 (11361.1) |
11355.2 (11360.9) |
20397.7 (20407.5) |
20397.9 (20406.7) |
20400.5 (20406.8) |
20399.7 (20406.1) |
| LR chi2 | 4.7 | 4.3 | 0.6 | 1.3 | 5.5 | 4.8 | 7.4 | 5.7 | 9.8 | 8.8 | 6.4 | 6.3 |
| Prob > chi2 (p) | 0.030 | 0.038 | 0.423 | 0.262 | 0.019 | 0.028 | 0.007 | 0.017 | 0.002 | 0.003 | 0.012 | 0.012 |
*p < 0.1, ** p < 0.05, *** p < 0.01.
The figures in parentheses below estimates of G × E terms are their p values.
The categories in the parentheses after the variables in the first column (except G × E part) are reference groups for binary variables.
The figures in parentheses below the estimate of “−2LL” are the estimates of “−2LL” in the models without the interaction blocks. The last line “Prob > chi2 (p)” presents the p values of the chi-squared tests to examine whether the difference in likelihood ratios between the full model including the interaction block and the model without the interaction block are statistically significant, following the standard Aiken and West procedure.27
G, genotype; E, environmental factors.
Results
We found that the G × E interaction term between carrying the FOXO1A-209 minor allele (recessive model) and tea drinking are significantly associated with a lower risk of mortality at advanced ages. In Cohort 1998, the hazard ratio was 0.456 (p = 0.037) when tea drinking was measured as a binary variable and 0.662 (p = 0.048) when measured as an ordered variable (Table 2). This significant association was replicated in Cohort 2008–2009 (p = 0.028 or p = 0.042 in the binary or ordered models, respectively). The FOXO1A-209-by-tea-drinking interaction terms were associated with substantially reduced mortality risk (hazard ratio = 0.465–0.666) and highly significant in the integrated analysis of both cohorts combined (p = 0.003 or p = 0.006).
With the additive model, the G × E interaction term between carrying the FOXO1A-209 minor allele and drinking tea (ordered variable) is significantly associated with lower mortality risk at advanced ages in Cohort 2008–2009 (p = 0.018), while the association is not significant in Cohort 1998, although the direction of reducing mortality risk is consistent between the two cohorts. However, the G × E interaction is significant in the combined analysis (p = 0.016) (Table 2). Following the dominant genetic model, the FOXO1A-209-by-tea-drinking G × E interaction is generally associated with reduced mortality risk (hazard ratios were between 0.742 and 0.952) that was directionally similar to those following the additive and recessive genetic models presented in Table 2, but the estimates following the dominant model were mostly not
Note that the significant estimates of the G × E interaction terms (as shown in Table 2) represent synergistic associations, but may not exactly reflect the true effects of G × E interactions on mortality risk because the estimates may be confounded by correlations between the genotype and environmental factor (abbreviated as rGE).32,33 Therefore, we use the two-sample t-test or the Pearson chi-squared tests to explore whether the rGE exists. More specifically, we tested whether there were significant differences in the percentage of respondents carrying the FOXO1A-209 genotype (recessive model) or number of copies of the minor allele (additive model) between the tea drinkers and non-drinkers (binary variable) or among those who never, sometimes, or often drink tea (ordered variable). If rGE is not statistically significant, the estimates of the interaction terms represent the true G × E interaction effects. Otherwise, we need to conduct path analysis employing structural equation models, adjusted for various confounders, to further explore the direct, indirect, and interactive associations of the genotype and the environmental factor with the health outcome indicator.25
The results of the statistical tests on the potential rGE were not significant (data not shown due to space limitations), ruling out the rGE correlation as the explanation for the interaction between carrying the FOXO1A-209 minor allele and tea drinking. Thus, the estimates of the G × E interaction terms between carrying the FOXO1A-209 minor alleles and tea drinking presented in Table 2 represent the true associations between the G × E interactions and mortality risk at advanced ages and they are not confounded by a rGE correlation.
An interaction between an environmental factor and a genotype is present if the association between the environmental factor and a health outcome indicator differs among individuals with different status of carrying the genotype, or if the association between the genotype and a health outcome indicator differs among individuals with different exposure to the environmental factor.1 Consequently, in addition to looking at the hazard ratios of the G × E interaction terms presented in Table 2, another more intuitive way to understand the effects of the FOXO1A-by-tea-drinking interactions is to assess differences in the hazard ratio of mortality risk between those who have different combination of the statuses of tea drinking and carrying the FOXO1A-209 genotype (see the Supplemental Data for technical notes; Supplementary Data are available at www.liebertonline.com/rej/).
The estimates presented in Table 3 show that, among the non-carriers of FOXO1A-209 minor alleles (recessive model), drinking tea (binary variable) did not affect the mortality risk, but the mortality risk reduction effects of tea drinking among the FOXO1A-209 carriers were −53.3%. The effects of sometimes or often drinking tea (compared to not-drinking tea) on reduced mortality risk were small and not significant among non-carriers of FOXO1A-209 minor alleles. In contrast, among the carriers of FOXO1A-209 genotype, the hazard ratios of mortality risk of the oldest-old who often or sometimes drink tea were about half of those who rarely or never drink tea. The estimates presented in Table 4 indicate that, among those who do not carry any copy of the FOXO1A-209 minor allele or carry one copy of the FOXO1A-209 minor allele, the effects of often or sometimes drinking tea were small and not significant; but sometimes or often drinking tea was associated with a reduced mortality risk of about half among those who carry two copies of FOXO1A-209 minor alleles.
Table 3.
The Hazard Ratios of Mortality Risk (HRGE)a and Their Differences by Combinations of Tea Drinking Status (E)b and the Status of Carrying the Minor Allele of FOXO1A-209 Following the Recessive Model (G), Based on the Data of the Two CLHLS Cohorts Combined
| Binary tea drinking variableb | Ordered tea drinking variablec | |||||||
|---|---|---|---|---|---|---|---|---|
| G: genotypic status (Recessive model) | E = 0 | E = 1 | % diff.dE = 1 vs. 0 | E = 0 | E = 1 | E = 2 | % diff. E = 1 vs. 0 | % diff. E = 2 vs. 0 |
| Non-carriers of the genotype: G = 0 | 1.00(ref.) | 1.004 (0.945)e |
+0.4% | 1.00 (ref.) | 1.076 (0.349) |
0.958 (0.534) |
+7.6% | −4.2% |
| Carriers of the genotype: G = 1 | 1.253 (0.073) |
0.586 (0.017) |
−53.3% | 1.253 (0.073) |
0.644 (0.285) |
0.564 (0.029) |
−48.6% | −55.0% |
| % difference G = 1 vs. 0 | +25.3% | −41.6% | +25.3% | −40.1% | −41.1% | |||
| Hazards ratio of G×E interaction termf | 0.466 p = 0.003; CIg 0.28, 0.77 |
0.665 p = 0.005; CI 0.50, 0.89 |
||||||
HRGE: see online Supplemental Data describing how HRGE values are estimated.
Tea-drinking, binary variable: E = 0, rarely or never; E = 1, almost every day or sometimes.
Tea-drinking, ordered variable: E = 0, rarely or never; E = 1, sometimes, E = 2, almost every day.
diff., difference.
The figures in parentheses underneath the estimates of hazards ratios are p values.
Hazards ratio of the G × E interaction term are taken from the proportional hazards model estimates presented in Table 2.
CI is 95% confidence interval.
CLHLS, Chinese Longitudinal Healthy Longevity Study; G, genotype; E, environmental factors; CI, confidence interval.
Table 4.
The Hazard Ratios of Mortality Risk (HRGE) and Their Differences by Combinations of Tea Drinking Status (E) and the Status of Carrying the Minor Allele of FOXO1A-209 Following the Additive Model (G), Based on the Data of the Two Cohorts Combined
| Binary tea drinking variable | Ordered tea drinking variable | |||||||
|---|---|---|---|---|---|---|---|---|
| G: genotypic status (Additive model) | E = 0 | E = 1 | % diff. E = 1 vs. 0 | E = 0 | E = 1 | E = 2 | % diff. E = 1 vs. 0 | % diff. E = 2 vs. 0 |
| 0 Copy minor allele: G = 0 | 1.00 (ref.) | 1.038 (0.601) |
+3.8% | 1.00 (ref.) | 1.087 (0.397) |
1.005 (0.959) |
+8.7% | +0.5% |
| 1 Copy minor allele: G = 1 | 0.974 (0.706) |
0.930 (0.393) |
−4.6% | 0.974 (0.703) |
1.032 (0.800) |
0.872 (0.191) |
+5.9% | −10.5% |
| 2 Copies of minor allele: G = 2 | 1.242 (0.091) |
0.581 (0.015) |
−53.2% | 1.242 (0.091) |
0.639 (0.276) |
0.558 (0.028) |
−48.6% | −55.1% |
| % Difference G = 1 vs.0 | −2.6% | −10.5% | −2.6% | −5.1% | −13.2% | |||
| % Difference G = 2 vs.0 | +24.2% | −44.1% | +24.2% | −41.2% | −44.4% | |||
| Hazards ratio of G × E interaction term | 0.794 p = 0.012; CI 0.66,0.95 |
0.876 p = 0.013; CI 0.79, 0.97 |
||||||
Notes: The same as in Table 3.
G, genotype; E, environmental factors; CI, confidence interval.
One may also intuitively understand the effects of FOXO1A-209-by-tea-drinking G × E interactions by assessing the genetic effects on mortality risk among tea drinkers compared to non-drinkers. For example, as shown in Table 3 and Fig. 1, both following the recessive model, if one rarely or never drinks tea, carrying the FOXO1A-209 genotype (E = 0, G = 1) is associated with increased mortality risk of 25.9% (Table 3) and the lowest survival curve (Fig. 1), which is consistent with the general results of negative association between FOXO1A-209 genotype and longevity revealed in previously published cases/controls association analyses.3,15 In contrast, however, if one often or sometimes drinks tea, carrying the FOXO1A-209 genotype (E = 1, G = 1) is associated with decreased mortality risk of 40.4%–41.7% (Table 3) and has the highest survival curve (Fig. 1). Estimates presented in Table 4 following the additive model also tell the same story as that found in Table 3. The survival curves in Fig. 2 show that, those who carry two copies of FOXO1A-209 minor alleles and never or rarely drink tea (G = 2, E = 0) had the lowest survival curve (i.e., the highest death rates); in contrast, those who carry two copies of FOXO1A-209 minor alleles and often or sometimes drink tea (G = 2, E = 1) had the highest survival curve (i.e., the lowest death rates), whereas those who carry one copy of the FOXO1A-209 minor allele and often or sometimes drink tea (G = 1, E = 1) had a modest survival curve in between the highest and the lowest (i.e., the modest death rates).
FIG. 1.
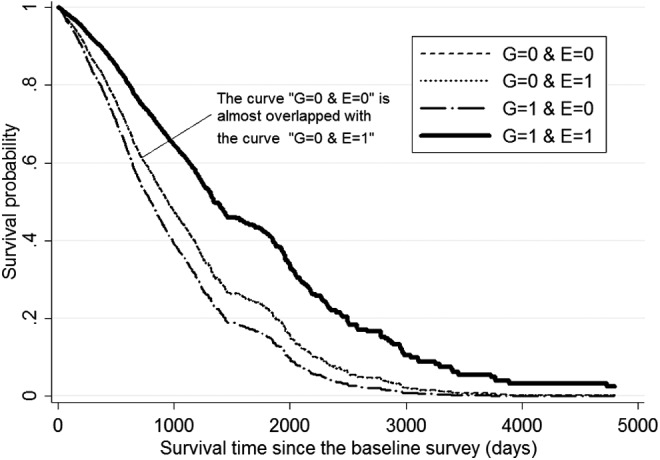
Survival curves by tea drinking status (E, binary) and the status of carrying minor allele of FOXO1A-209 (G) following the recessive model based on the Cox proportional hazard model, controlling for the respondents' age and other co-variates at the baseline. Notes: (1) Co-variates include gender, age, rural or urban residence, education, marital status, regular exercise, smoking, and alcohol drinking. We also adjusted for the groups of 1998 cohort and 2008–2009 cohort in the combined analysis. (2) The survival curves were calculated at the mean values of all of the co-variates. G, genotype; E, environmental factors.
FIG. 2.
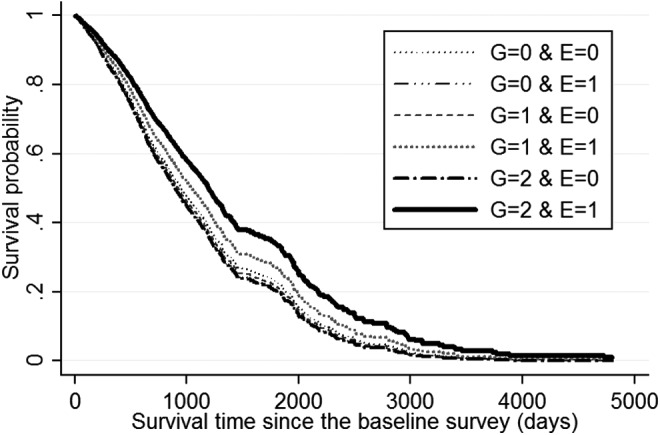
Survival curves by tea drinking status (E, binary) and the status of carrying minor allele of FOXO1A-209 (G) following the additive model, based on Cox proportional hazard model, controlling for the respondents' age and other co-variates at the baseline. Notes are the same as in Fig. 1 legend. G, genotype; E, environmental factors.
Discussion
The foregoing analyses have shown that G × E interactions between carrying the FOXO1A-209 genotype and drinking tea were significantly associated with lower risk of mortality at advanced ages in the Chinese Han population, after ruling out potential confounding effects of correlations between carrying the FOXO1A-209 minor alleles and tea drinking. Importantly, the significant association between the FOXO1A-209-by-tea-drinking G × E interaction and reduced mortality risk at advanced ages is replicated in the two independent CLHLS cohorts (Table 2). Our estimates clearly showed that the associations between tea drinking (either binary or ordered variable) and reduced mortality at advanced ages were much stronger among carriers of the genotypes of FOXO1A-209 compared to non-carriers, following either additive or recessive models (Tables 3 and 4 and Figs. 1 and 2), and drinking tea is associated with a reversal of the negative effects of carrying the FOXO1A-209 minor alleles, from a substantially increased mortality risk to substantially reduced mortality risk at advanced ages. The results indicate that the impacts of reversing the negative effects of FOXO1A-209 genotype on survival at advanced ages is considerably stronger among those who carry two copies of the FOXO1A minor alleles than those who carry one copy of the minor allele (Fig. 2).
We note that our statistical association study (without functional validation tests) did not establish any causal effect of the FOXO1A-by-tea-drinking interactions on healthy aging and longevity, although we speculated that tea consumption may inhibit FOXO1A-209 gene expression and biological functions based on the human cell models reported in the literature18; thus, it reduces the negative impacts of FOXO1A-209 gene on longevity (as reported in the literature, e.g., Li et al.3) and offers protection against mortality risk at oldest-old ages. Our empirical findings imply that health outcome benefits of certain nutritional interventions, including tea drinking, may depend, in part, upon individual genetic profiles. Clearly, research on the effects of G × E (such as FOXO gene-by-tea drinking) interaction is useful for precision rejuvenation/life style intervention (akin to the concept of precision medicine) in the clinic or associated healthy aging intervention programs.
Because the FOXO1A genotype data were available for 2481 oldest-old aged 91+ only, we restricted the present study to advanced ages only, and we were not able to explore effects of the FOXO1A-209-by-tea-drinking G × E interactions in the young-old. Although we know that Chinese people in general mostly drink green tea and prior research demonstrated that consumption of green tea (not black tea or coffee) has been associated with reduced risk of cognitive function at old ages 60 and over,34 we did not have data on what types of green tea or other tea the participants drink. Furthermore, we were not able to quantify the intake of active ingredients such as EGCG and other tea catechins. Because the sub-sample size of the male oldest-old was not large enough, we included sex as a co-variate in the hazard models to control for the potential confounding effects of gender, but we were not able to conduct more detailed analysis for the male and female oldest-old separately. These limitations will need to be addressed in the future when new genotypic/phenotypic datasets for all elderly age groups with much larger sample sizes for both genders become available.
Supplementary Material
Acknowledgments
This study is supported by the National Natural Science Foundation of China (71110107025, 71233001, 71490732) (Y.Z.), National Key Basic Research Program of China (2013CB530700) (XLT), NIA/NIH (R01 AG023627) (Y.Z.), National Institutes of Health (NIH) Pepper Center Grant (P30AG028716) (ERH), and National Insitute on Aging (NIA)/NIH (R01AG027060 and R01AG038707) (B.W. and D.C.W.).
We thank Huiqing Cao, Wen-Jing Wang, Chong Wu, Fang-Yuan Hu, Jian Guo, Ling Zhao, Fan Yang, Yi-Xin Zhang, Wei Li, and Gu-Yan Zheng for their efforts in the lab work on DNA extractions and genotyping. We are grateful to Zhenyu Xiao, Yuzhi Liu, Chunyuan Zhang, Liqun Tao, Qin Xu, Ye Yuan, Jie Zhan, and Yun Zhou for their contributions in the Chinese Longitudinal Healthy Longevity Survey and the DNA sample collection, and we thank all interviewees and their families for their voluntary participation in this study. We are grateful for the thoughtful comments provided by Jessica Sautter.
Author Disclosure Statement
No competing financial interests exist.
References
- 1.IOM Institute of Medicine National Academy of Sciences. Genes, Behavior, and the Social Environment: Moving Beyond the Nature/Nurture Debate. National Academies Press, Washington DC, 2006 [PubMed] [Google Scholar]
- 2.Tsankova N, Renthal W, Kumar A, Nestier EJ. Epigenetic regulation in psychiatric disorders. Nat Rev Neurosci 2007;8:355–367 [DOI] [PubMed] [Google Scholar]
- 3.Li Y, Wang WJ, Cao H, Lu J, Wu C, Hu FY, Guo J, Zhao L, Yang F, Zhang YX, Li W, Zheng GY, Cui H, Chen X, Zhu Z, He H, Dong B, Mo X, Zeng Yi Tian XL. Genetic association of FOXO1A and FOXO3A with longevity trait in Han Chinese populations. Hum Mol Genet 2009;18:4897–4904 [DOI] [PMC free article] [PubMed] [Google Scholar]
- 4.Lunetta KL, D'Agostino RB, Karasik D, Benjamin EJ, Guo CY, Govindaraju R, Kiel DP, Kelly-Hayes M, Massaro JM, Pencina MJ, Seshadri S, Murabito JM. Genetic correlates of longevity and selected age-related phenotypes: A genome-wide association study in the Framingham Study. BMC Med Genet 2007;8:S13. [DOI] [PMC free article] [PubMed] [Google Scholar]
- 5.Kuningas M, Mägi R, Westendorp R G J, Slagboom PE, Remm M, van Heemst D. Haplotypes in the human Foxo1a and Foxo3a genes; impact on disease and mortality at old age. Eur J Hum Genet 2007;15:294–301 [DOI] [PubMed] [Google Scholar]
- 6.Arab L, Liu W, Elashoff D. Green and black tea consumption and risk of stroke: A meta-Analysis. Stroke 2009;40:1786–1792 [DOI] [PubMed] [Google Scholar]
- 7.Eagleton M. Turn off the cytokine switch. Life Extension 2014;66–73 [Google Scholar]
- 8.Feng L, Yan Z, Sun B, Cai C, Jiang H, Kua EH, Ng TP, Qiu C. Tea consumption and depressive symptoms in older people in rural China. J Am Geriatr Soc 2013;61:1943–1947 [DOI] [PubMed] [Google Scholar]
- 9.Feng L, Gwee X, Kua EH, Ng TP. Cognitive function and tea consumption in community dwelling older Chinese in Singapore. J Nutr Health Aging 2010;14:433–438 [DOI] [PubMed] [Google Scholar]
- 10.Feng L, Li J, Ng TP, Lee TS, Kua EH, Zeng Y. Tea drinking and cognitive function in oldest-old Chinese. J Nutr Health Aging 2012;16:754–758 [DOI] [PMC free article] [PubMed] [Google Scholar]
- 11.Unno K, Fujitani K, Takamori N, Takabayashi F, Maeda K, Miyazaki H, Tanida N, Iguchi K, Shimoi K, Hoshino M. Theanine intake improves the shortened lifespan, cognitive dysfunction and behavioural depression that are induced by chronic psychosocial stress in mice. Free Radic Res 2011;45:966–974 [DOI] [PubMed] [Google Scholar]
- 12.Suzuki E, Yorifuji T, Takao S, Komatsu H, Sugiyama M, Ohta T, Ishikawa-Takata K, Doi H. Green tea consumption and mortality among Japanese elderly people: The prospective Shizuoka elderly cohort. Ann Epidemiol 2009;19:732–739 [DOI] [PubMed] [Google Scholar]
- 13.Nakachi K, Eguchi H, Imai K. Can teatime increase one's lifetime? Ageing Res Rev 2003;2:1–10 [DOI] [PubMed] [Google Scholar]
- 14.Ruan R, Feng L, Li J, Ng TP, Zeng Y. Tea consumption and mortality in the oldest-old Chinese. J Am Geriatr Soc 2013;61:1937–1942 [DOI] [PMC free article] [PubMed] [Google Scholar]
- 15.Zeng Y, Cheng L, Chen H, Cao H, Hauser ER, Liu Y, Xiao Z, Tan Q, Tian XL, Vaupel JW. Effects of FOXO genotypes on longevity: A biodemographic analysis. J Gerontol A Biol Sci Med Sci 2010;65:1285–1299 [DOI] [PMC free article] [PubMed] [Google Scholar]
- 16.Xu WH, Dai Q, Xiang YB, Long JR, Ruan ZX, Cheng JR, Zheng W, Shu XO. Interaction of soy food and tea consumption with CYP19A1 genetic polymorphisms in the development of endometrial cancer. Am J Epidemiol 2007;166:1420–1430 [DOI] [PMC free article] [PubMed] [Google Scholar]
- 17.Lin IH, Ho ML, Chen HY, Lee HS, Huang CC, Chu YH, Lin SY, Deng YR, He YH, Lien YH, Hsu CW, Wong RH. Smoking, green tea consumption, genetic polymorphisms in the insulin-like growth factors and lung cancer risk. PloS One 2012;7:e30951. [DOI] [PMC free article] [PubMed] [Google Scholar]
- 18.Anton S, Melville L, Rena G. Epigallocatechin gallate (EGCG) mimics insulin action on the transcription factor FOXO1a and elicits cellular responses in the presence and absence of insulin. Cell Signal 2007;19:378–383 [DOI] [PubMed] [Google Scholar]
- 19.Belguise K, Guo S, Sonenshein GE. Activation of FOXO3a by the green tea polyphenol epigallocatechin-3-gallate induces estrogen receptor a expression reversing invasive phenotype of breast cancer cells. Cancer Res 2007;67:5763–5770 [DOI] [PubMed] [Google Scholar]
- 20.Chan R, Woo J, Suen E, Leung J, Tang N. Chinese tea consumption is associated with longer telomere length in elderly Chinese men. Br J Nutr 2010;103:107–113 [DOI] [PubMed] [Google Scholar]
- 21.Zeng Y, Chen H, Ni T, Ruan R, Feng L, Nie C, Cheng L, Li Y, Tao W, Gu J, Land KC, Yashin A, Tan Q, Yang Z, Bolund L, Yang H, Hauser E, Willcox DC, Willcox BJ, Tian XL, Vaupel JW. GxE Interactions between FOXO genotypes and tea drinking significantly affect cognitive disability at advanced ages in China. J Gerontol A Biol Sci Med Sci 2015;70:426–433 [DOI] [PMC free article] [PubMed] [Google Scholar]
- 22.Jylhävä J, Hurme M. Gene variants as determinants of longevity: Focus on the inflammatory factors. Pflugers Arch 2010;459:239–246 [DOI] [PubMed] [Google Scholar]
- 23.Tan Q, Jacobsen R, Sørensen M, Christiansen L, Kruse TA, Christensen K. Analyzing age-specific genetic effects on human extreme age survival in cohort-based longitudinal studies. Eur J Hum Genet 2012;21:451–454 [DOI] [PMC free article] [PubMed] [Google Scholar]
- 24.Population Division of the Department of Economic and Social Affairs of the United Nations Secretariat. World Population Prospects: The 2012 revision. New York, 2013. http://esa.un.org/unpd/wpp/unpp/panel_indicators.htm/ [Google Scholar]
- 25.Zeng Y, Cheng L, Zhao L, Tan Q, Feng Q, Chen H, Shen K, Li J, Zhang F, Cao H, Gregory SG, Yang Z, Gu J, Tao W, Tian XL, Hauser ER. Interactions between social/behavioral factors and ADRB2 genotypes may be associated with health at advanced ages in China. BMC Geriatr 2013;13:1–13 [DOI] [PMC free article] [PubMed] [Google Scholar]
- 26.Gu D. General data quality assessment of the CLHLS. In: Zeng Y, Dudley P, Denese AV, Gu D, eds. Healthy Longevity in China: Demographic, Socioeconomic, and Psychological Dimensions. Springer, Dordrecht, 2008, pp. 39–60 [Google Scholar]
- 27.Goodkind D. Review of “Healthy longevity in china: demographic, socioeconomic, and psychological dimensions.” Population Studies, vol. 63, no. 2009 [Google Scholar]
- 28.Zhao L, Yang F, Xu K, Cao H, Zheng GY, Zhang Y, Li J, Cui H, Chen X, Zhu Z, He H, Mo X, Kennedy BK, Suh Y, Zeng Y, Tian XL. Common genetic variants of the β 2‐adrenergic receptor affect its translational efficiency and are associated with human longevity. Aging Cell 2012;11:1094–1101 [DOI] [PMC free article] [PubMed] [Google Scholar]
- 29.Zeng Y, Nie C, Min. J., et al. Novel loci and pathways significantly associated with longevity. Scientific Reports, 2016;6:21243; doi: 10.1038/srep21243 [DOI] [PMC free article] [PubMed] [Google Scholar]
- 30.Aiken LS, West SG. Multiple Regression: Testing and Interpreting Interactions. Sage Publications, Newbury Park, CA, 1991 [Google Scholar]
- 31.Helm R, Mark A. Analysis and evaluation of moderator effects in regression models: State of art, alternatives and empirical example. Rev Managerial Sci 2012;6:307–332 [Google Scholar]
- 32.Rothman KJ. Epidemiology: An Introduction. Oxford University Press, New York, 2012 [Google Scholar]
- 33.Kendler KS, Kuhn JW, Vittum J, Prescott CA, Riley B. The interaction of stressful life events and a serotonin transporter polymorphism in the prediction of episodes of major depression: a replication. Arch Gen Psychiatry 2005;62:529–535 [DOI] [PubMed] [Google Scholar]
- 34.Noguchi-Shinohara M, Yuki S, Dohmoto C, Ikeda Y, Samuraki M, Iwasa K, Yokogawa M, Asai K, Komai K, Nakamura H, Yamada M. Consumption of green tea, but not black tea or coffee, is associated with reduced risk of cognitive decline. PLoS One 2014;9:e96013. doi: 10.1371/journal.pone.0096013 [DOI] [PMC free article] [PubMed] [Google Scholar]
Associated Data
This section collects any data citations, data availability statements, or supplementary materials included in this article.