

Abstract
The mechanisms of tumor cell dissemination and the contribution of membrane trafficking in this process are poorly understood. Through a functional siRNA screening of human RAB GTPases, we found that RAB2A, a protein essential for ER‐to‐Golgi transport, is critical in promoting proteolytic activity and 3D invasiveness of breast cancer (BC) cell lines. Remarkably, RAB2A is amplified and elevated in human BC and is a powerful and independent predictor of disease recurrence in BC patients. Mechanistically, RAB2A acts at two independent trafficking steps. Firstly, by interacting with VPS39, a key component of the late endosomal HOPS complex, it controls post‐endocytic trafficking of membrane‐bound MT1‐MMP, an essential metalloprotease for matrix remodeling and invasion. Secondly, it further regulates Golgi transport of E‐cadherin, ultimately controlling junctional stability, cell compaction, and tumor invasiveness. Thus, RAB2A is a novel trafficking determinant essential for regulation of a mesenchymal invasive program of BC dissemination.
Keywords: cancer migration and invasion, membrane trafficking, RAB2A, RAB GTPases
Subject Categories: Cancer, Membrane & Intracellular Transport
Introduction
The main cause of death among cancer patients is the development of metastasis. The metastatic phenotype is complex, featuring a wide range of plastic cellular processes and strategies that enable tumors to adapt to and overcome tissues and microenvironmental barriers to migration and invasion 1. One of such strategy critically depends on the ability to remodel and degrade the proteins of the extracellular matrix (ECM) and to acquire mesenchymal features, commonly characterized by the extension of actin‐rich polarized protrusion and loss or reduction in cell–cell interactions 2.
Deregulation of matrix‐degrading proteases, including matrix metalloproteinases (MMPs), is one of the mechanisms used by cancer to remodel the ECM 3. Although secreted MMPs have been implicated in cancer for several decades, it has become apparent that membrane‐anchored MMPs, and most notably membrane type 1 (MT1)‐MMP, play a pivotal role, particularly in the initial phases of dissemination of tumor cells and cancer progression 4, 5, 6. Not surprisingly, MT1‐MMP expression is frequently elevated in various invasive carcinomas, including breast cancer (BC), and genetic evidence in murine models further supports its critical role in the process 7, 8, 9.
In addition to deregulation of total protein and mRNA levels of MT1‐MMP, subversion of the activity of this protease is also frequently brought about by alterations of its intracellular trafficking routes. Consistently, the surface MT1‐MMP is augmented, particularly but not exclusively, in BC 10, 11. Furthermore, in various tumorigenic and non‐tumorigenic cell lines, newly synthesized MT1‐MMP that reaches the plasma membrane (PM) undergoes constant and rapid cycles of internalization and recycling 12, 13, 14. Endo/exocytic fluxes are thought to be essential to ensure a constant flow of active MT1‐MMP at the PM 15, where its proteolytic activity becomes rapidly inactivated by the binding to tissue inhibitor of metalloproteinase (TIMP)‐2, which is also abundantly expressed in cancer 16. Membrane trafficking also imposes a strict spatial regulation of the cargos it delivers 12, 17, 18. Indeed, internalized MT1‐MMP accumulates in early and late endosomes from where it is delivered to specialized, actin‐rich, adhesive protrusions that degrade the ECM in focal fashion, named invadopodia 19, 20, 21, 22. Targeting of MT1‐MMP to invadopodia can also be achieved through direct polarized secretion 23 and exosomes release 24, enlarging the range of potential trafficking regulatory routes that can go awry in a tumor setting.
The impact of membrane trafficking on tumor biology is clearly not limited to the control of MT1‐MMP 25. Frequently, tumors of epithelial origin must undergo a plastic transition marked by the loss of epithelial features, and canonical referred to as epithelial‐to‐mesenchymal transition (EMT) 26. While the occurrence of overt, full EMT in solid cancers of epithelial origin in vivo remains matter of debate 27, it is commonly accepted that some form of mesenchymalization is associated with the acquisition of metastatic phenotype 28. The transient loss of epithelial identity and acquisition of mesenchymal feature is epitomized by the loss or weakening of the cell–cell adherence junctions (AJ), and of the key molecular component mediating their formation, E‐cadherin 29. Not surprisingly, during EMT, E‐cadherin is frequently transcriptionally downregulated. In addition, there is emerging evidence for a crucial role of E‐cadherin endocytosis and recycling in the acquisition of a transitory mesenchymal, invasive state 30, 31, 32.
Collectively, these observations suggest that key determinants of membrane trafficking might be frequently selected by and hijacked by tumors to increase their metastatic potential. Hence, there is the need to identify membrane trafficking hubs subverted in cancer and capable of promoting a mesenchymal program of tumor invasion.
Here, we address this issue by focusing on the RAB family of small GTPases 33. Through a stepwise siRNA screening, targeting each member of the RAB family, we identified RAB2A, essential for ER‐to‐Golgi transport 34, 35, as a critical player in promoting proteolytic activities and 3D invasiveness of BC cell lines. Unexpectedly, RAB2A controls MT1‐MMP‐dependent degradation not by regulating Golgi‐to‐ER trafficking 36, 37, 38, but MT1‐MMP late endosome to PM exocytosis by directly binding VPS39, a critical subunit of the homotypic fusion and vacuole protein sorting (HOPS) late endosomal complex. RAB2A is also critical to control cell compaction and collective invasive growth of BC cells, by independently controlling E‐cadherin Golgi‐to‐PM transport route. Notably, RAB2A expression is frequently altered in human BC and its elevated expression is an independent powerful predictor of BC recurrence. Consistently, elevation of RAB2A, mimicking the alteration found in human BC, impaired E‐cadherin PM localization and enhanced cell dispersal. We propose that perturbation of RAB2A enables invasive BC to hijack distinct trafficking routes of different cargos, that is, MT1‐MMP and E‐cadherin, both essential to promote a mesenchymal program of tumor dissemination.
Results
Identification of RAB2A as a critical regulator of a matrix degradation invasive program in BC lines
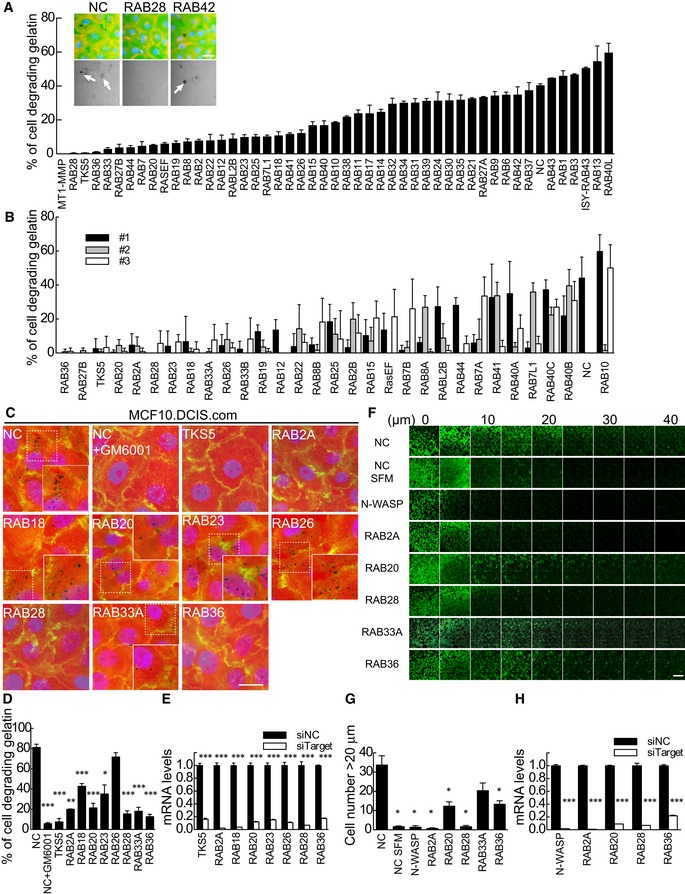
To identify RAB GTPases that are critical for invasive programs in BC cells, we performed a synthetic siRNA screen with 196 siRNAs targeting 66 distinct RAB GTPases (two or three siRNAs per each RAB GTPase). We selected the triple‐negative BC cell line MDA‐MB‐231 that displays high and constitutive matrix degradation activity that correlates with their established invasive properties 19. We reversely transfected with siRNA MDA‐MB‐231 cells plated on fluorescein‐labeled gelatin‐coated optical microplates. GM6001, a broad‐spectrum hydroxamate inhibitor of matrix metalloproteinases 39, was added to MDA‐MB‐231 cells for 48 h post‐transfection to avoid gelatin degradation. Subsequent removal of the inhibitor further enabled us to synchronize matrix degradation activity and directly assess the impact of gene silencing on the onset of this acquired activity 40. Of note, under these conditions, about 40% of MDA‐MB‐231 cells digest focally the ECM, consistent with their ability to form actin‐rich, ventrally located invadopodia structures, following removal of GM6001 over a 24‐h period (Appendix Fig S1). Furthermore, silencing of MT1‐MMP, N‐WASP, and TKS5, which are known essential regulators of invadopodia‐mediated matrix digestion 41, 42, 43, robustly impaired their formation and ECM digestion (Appendix Fig S1). We initially performed a primary screening using pooled siRNAs for each of the known mammalian RAB GTPases (Fig 1A) and focused for further analysis on those perturbations that caused a reduction in matrix degradation below an arbitrarily defined cutoff of 20% cells displaying matrix degradation (corresponding to about half of the activity observed in control treated cells). We further restricted the number of RAB GTPases to 9 by selecting those whose silencing by three independent siRNAs inhibited matrix degradation activity by more than 80% (Fig 1B). As tertiary screening phase, we extended the analysis to a different BC line, MCF10.DCIS.com. This cell line is a H‐RAS‐driven, tumorigenic derivative of the normal mammary epithelial MCF10A cells, which recapitulates prototypical features of comedo‐type ductal carcinoma in situ (DCIS), upon injection into immunodeficient mice 44, and readily degrades ECM through the formation of invadopodia upon HGF stimulation in vitro 19. We excluded from further analysis of RAB27B because it has already been established to facilitate cell invasiveness in BC cells by activating MMP2 45. Silencing of RAB2A, RAB20, RAB28, RAB33A, or RAB36 in MCF10.DCIS.com significantly inhibited HGF‐induced matrix degradation to < 25% of control siRNA‐transfected cells (Fig 1C–E).
Figure 1. siRNA‐based screening for RAB GTPases indispensable for matrix degradation invasive program.
-
APrimary siRNA screening analysis. MDA‐MB‐231 cells were reverse‐transfected with siRNA pools against MT1‐MMP, TKS5, or each human RAB GTPase and were plated on fluorescein‐labeled gelatin‐coated optical microplates. Degradation activity was measured by counting the number of cells degrading gelatin identified as dark black foci (similar results were obtained by measuring the area of degradation/number of cells). The inset shows representative images of degraded Oregon green gelatin (upper panels) and merged images with TRITC‐phalloidin (red) and DAPI (blue) in scrambled siRNA (NC), or siRNA against RAB28‐ or RAB42‐transfected cells (lower panel). Data are means ± SEM of 3 independent experiments. Scale bar, 50 μm.
-
BSecondary siRNA screening analysis was performed on candidate RAB GTPases selected from the primary screen using 3 individual deconvoluted siRNAs. Data are mean ± SD (n > 5 different fields/experiment).
-
C–ETertiary siRNA screening. Pooled siRNAs against candidate RAB GTPases identified from the secondary screen or TKS5, used as control, were transfected into MCF10.DCIS.com cells. Cells plated onto fluorescently conjugated gelatin (red) were stimulated with 100 ng/ml HGF overnight in the presence or absence of GM6001, followed by staining with FITC‐phalloidin (green) and DAPI (blue) (C). Efficacy of targeted gene silencing was verified by qPCR (E). Scale bar, 50 μm. Data are the mean ± SEM (n > 100 cells/experiment in at least 4 independent ones). *P < 0.05, **P < 0.01, ***P < 0.001.
-
F–HInverse invasion assay. An equal number of MDA‐MB‐231 cells were reverse‐transfected with a mixture of three individual siRNA oligonucleotides targeting interest genes. Invasive activity is shown as the average number of cells/field that migrates into fibronectin‐supplemented (25 μg/ml) Matrigel further than 20 μm (F, G). Efficacy of targeted gene silencing was verified by qPCR (H). Scale bar, 250 μm. Data are mean ± SD from three different fields from one representative experiment out of 5 that were performed. *P < 0.05, ***P < 0.001.
Next, we performed inverse invasion assays into reconstituted three‐dimensional basement membrane. In these assays, fluorescein‐labeled cells are seeded on the bottom of culture plates and overlaid with a thick layer of Matrigel containing fibronectin and their invasiveness into the Matrigel plug determined by consecutive confocal Z sectioning 46. Control MDA‐MB‐231 cells invaded Matrigel plugs only upon addition of FCS and HGF to the top of the plugs (Fig 1F). Silencing of the selected RABs variably impacted on MDA‐MB‐231 chemotactic cell invasion (Fig 1F–H). Ablation of RAB2A and RAB28 consistently and reproducibly reduced invasiveness to levels similar to the one observed after removal of N‐WASP.
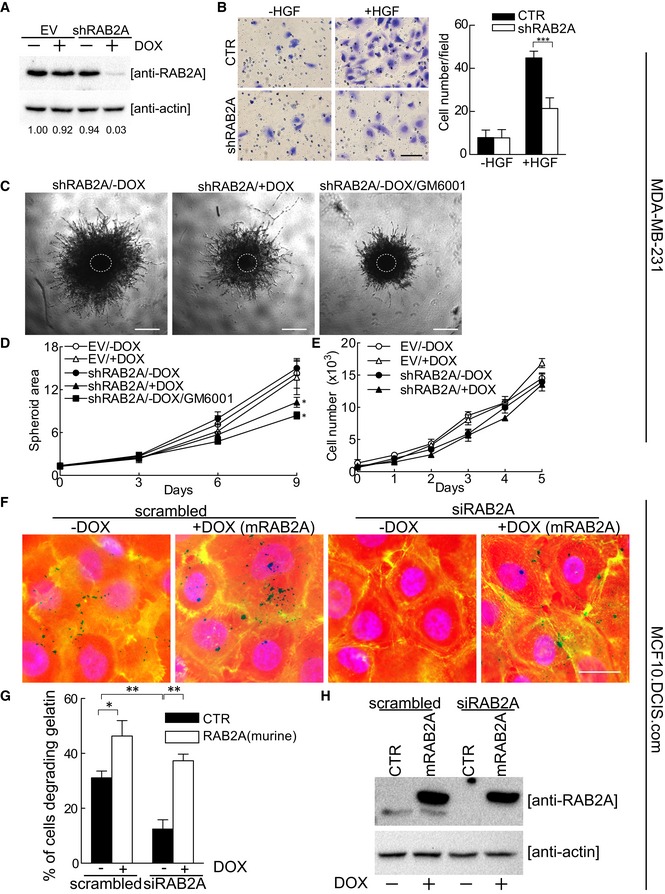
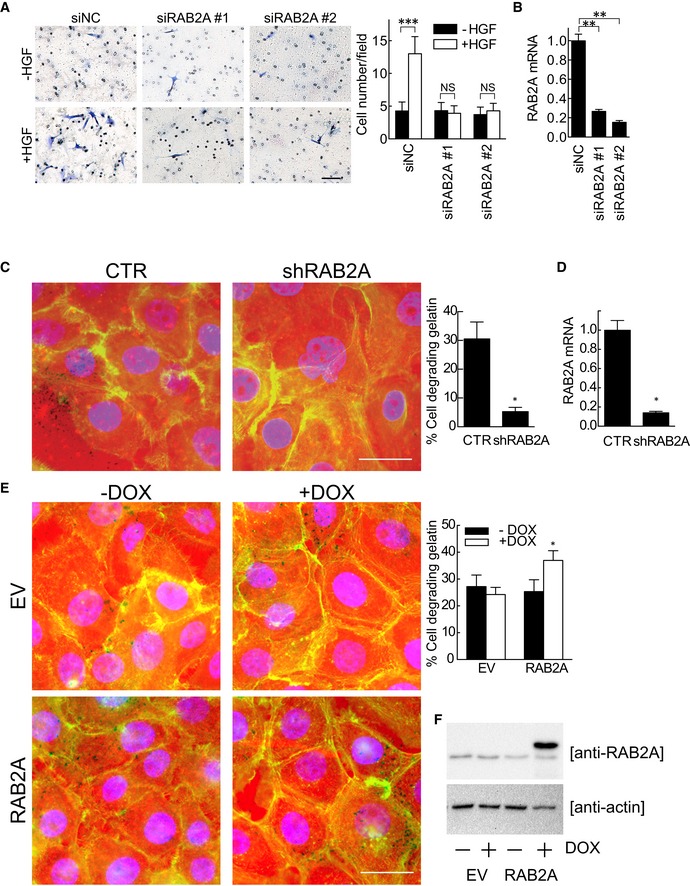
Prompted by this set of findings and in order to define criteria for prioritizing further in depth molecular high‐resolution studies, we interrogated by manual querying the Cancer Genome Atlas (TCGA) database and assess whether any of the selected RABs were altered in human BC. Importantly, RAB2A is the most frequently amplified (as assessed by copy number variation (CNV)) among the candidate RAB GTPases in this tumor type (in about 8% of cases, Appendix Fig S2A and B). Consistently, BC cell lines express high RAB2A protein expression compared with normal mammary epithelial cells such as HMEC and MCF10A (Appendix Fig S2C). Hence, we focused our investigation on RAB2A and set out initially to validate siRNA data by generation of stable knockdown cells with a different short hairpin constructs and reconstitution experiments. To this end, we generated MDA‐MB‐231 cells expressing shRNA that targets RAB2A in a doxycycline‐inducible fashion (Fig 2A). Addition of doxycycline led to a near‐complete silencing of RAB2A and inhibited HGF‐induced invasion in Matrigel‐coated transwell assays (Fig 2B). Similar results were also obtained using two independent siRNA against RAB2A (Fig EV1A and B). RAB2A silencing also impaired 3D spheroid invasion assays without affecting cell proliferation (Fig 2C–E). We further verified that removal of RAB2A by shRNA impaired matrix degradation activity and also of MCF10.DCIS.com (Fig EV1C and D). Furthermore, reconstitution of RAB2A expression using a murine gene that is resistant to siRNA targeting the human sequences nearly fully restored matrix degradation (Fig 2F–H). Notably, the elevation of the levels of RAB2A in the context of wild‐type cells also significantly increased matrix degradation (Figs 2F–H and EV1E and F), suggesting that this protein is not only required for, but also promotes ECM digestion.
Figure 2. RAB2A is not only required for invasion through ECM, but also promotes ECM digestion.
-
ADoxycycline‐inducible empty vector (EV) or RAB2A‐shRNA MDA‐MB‐231 cells were cultured in the absence (−) or presence (+) of doxycycline for 3 days and immunoblotted with anti‐RAB2A and anti‐actin antibodies. The intensity of RAB2A relative to actin is shown on the bottom. Relative density in uninduced EV cells was set to 1.
-
BDoxycycline‐inducible RAB2A‐shRNA MDA‐MB‐231 cells were cultured in the absence (CTR) or presence (shRAB2A) of doxycycline for three days. Invasion of MDA‐MB‐231 cells through Matrigel‐coated transwells toward HGF was assessed after 24 h. Representative images are shown. Scale bar, 200 μm. Data are the mean ± SD (n = 10 field/condition in at least 3 experiments). ***P < 0.001.
-
C–EEV and shRAB2A MDA‐MB‐231 cells were embedded in spheroid formation ECMR in the absence (−) or presence (+) of doxycycline and/or GM6001. After 3 days, the cells were transferred into Invasive MatrixR. Phase contrast images of representative spheroids are shown after 9 days (C). Dashed circle indicates the size of spheroids at day 0. Scale bars, 500 μm. Invasive activity into ECM was expressed as total spheroid area (relative to control cells at day 0) quantified by ImageJ (D). The number of cells at the indicated days was quantified by CyQUANTR Cell Proliferation Assay Kit (E). Data are the mean ± SD (n = 3 independent experiments). *P < 0.05.
-
F–HDoxycycline‐inducible murine RAB2A (mRAB2A) expression MCF10.DCIS.com cells were transfected with scrambled siRNA or siRNA against human RAB2A (siRAB2A) in the absence (−) or presence (+) of doxycycline. Serum‐starved cells were plated onto fluorescently conjugated gelatin (red), stimulated with HGF (100 ng/ml) overnight, and stained with phalloidin (green) and DAPI (blue) (f). Scale bar, 50 μm. Silencing of endogenous RAB2A protein (lower band) and ectopic RAB2A expression (upper band) was verified by immunoblotting (H). Data are the mean ± SEM (error bars; n > 100 cells/experiment in 4 independent ones) (G). *P < 0.05, **P < 0.01.
Source data are available online for this figure.
Figure EV1. Silencing RAB2A impairs, and RAB2A overexpression promotes ECM degradation activity.
-
A, BMDA‐MB‐231 cells were transfected with scrambled siRNA (siNC) or siRNAs against RAB2A (siRAB2A #1 or #2). Invasion of MDA‐MB‐231 cells through Matrigel‐coated transwells toward HGF assessed after 24 h. Representative images are shown (A). Efficacy of RAB2A silencing was verified by qPCR (B). Scale bar, 200 μm. Data are the mean ± SD (n = 10 field/condition). **P < 0.01, ***P < 0.001, NS, not significant.
-
C, DDoxycycline‐inducible RAB2A‐shRNA MCF10.DCIS.com cells were cultured in the absence (CTR) or presence (shRAB2A) of doxycycline for three days. Serum‐starved cells were then plated onto fluorescently conjugated gelatin (red), stimulated with HGF (100 ng/ml) overnight, and stained with phalloidin (green) and DAPI (blue). Efficacy of RAB2A gene silencing was verified by qPCR (D). Scale bar, 50 μm. Data are the mean ± SEM (n > 100 cells/experiment in three independent ones). *P < 0.05.
-
E, FECM degradation activities of doxycycline‐inducible empty vector (EV) or RAB2A expression MCF10.DCIS.com cells cultured in the absence (−) or presence (+) of doxycycline were quantified. Total cell lysate was immunoblotted with anti‐RAB2A and anti‐actin antibodies (F). Scale bar, 50 μm. Data are the mean ± SEM (n > 100 cells in at least 3 independent experiments). *P < 0.05.
Source data are available online for this figure.
RAB2A is a powerful and independent predictor of metastatic recurrence in human BC patient
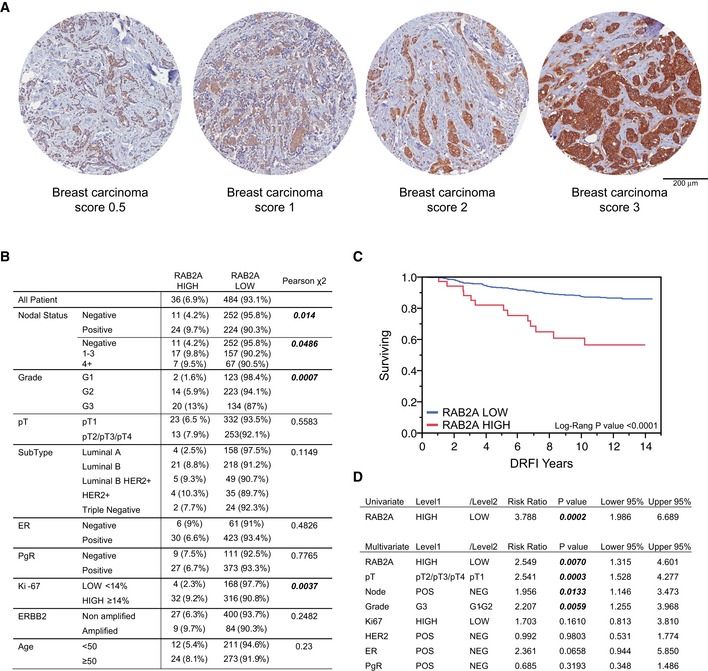
The role of RAB2A in the control of matrix degradation and mammary carcinoma cell invasion and the alteration in CNV detected in human cancer suggest that elevated levels of this protein might be positively selected by invasive human BCs. To test this hypothesis and assess whether expression of RAB2A is linked to a more aggressive BC phenotype, we analyzed by immunohistochemistry its expression on a Consecutive Cohort of Invasive Breast Cancer arrayed on tissue microarray (TMA, Appendix Table S1). We used an anti‐RAB2A antibody, the specificity of which was tested on formalin‐fixed, paraffin‐embedded (FFPE), RAB2A‐silenced, and overexpressing cells as well as on normal and tumorigenic human mammary tissues (Appendix Fig S3A). Notably, elevated expression of RAB2A was consistently detected in BC as compared to adjacent normal mammary tissue (Appendix Fig S3B). RAB2A expression level in breast carcinoma was scored according to the intensity of anti‐RAB2A staining (Fig 3A). Additionally and more importantly, we found that high (IHC score 3, see also Appendix Fig S3C and Materials and Methods) expression of RAB2A was significantly associated with poor prognosis markers, including node‐positive status (P = 0.014), high grade (P = 0.0007), and high proliferative status (Ki67, P = 0.0037) (Fig 3B). Furthermore, among the 520 BC patients with complete follow‐up data, those with primary tumors expressing higher levels of the RAB2A protein had a significant poorer recurrence‐free survival compared to those with lower protein expression, as assessed by Kaplan–Meier analysis (log‐rank P‐value < 0.0001) (Fig 3C). In univariate Cox regression analysis, patients with higher expression levels of RAB2A also have a significantly higher risk of developing distant metastasis (Hazard Ratio: 3.788, [CI] 1.99–6.69, P = 0.0002). Finally and more importantly, in multivariate analysis, RAB2A expression retained its predictive power of distant relapse events in BC patient, independently of other clinical and pathological markers (HR = 2.549, [CI] 1.31–4.60, P = 0.007) (Fig 3D). Thus, elevated expression of RAB2A is a powerful and independent predictor of metastatic recurrence in human BC patients.
Figure 3. RAB2A is an independent predictor of metastatic recurrence in human BC patients.
-
AImages are representative of RAB2A expression scoring according to intensity staining in TMA. In tumor tissues, the IHC signals were associated with the tumor cell component and not with the adjacent or infiltrating stroma.
-
BCorrelation of RAB2A expression with clinicopathological parameters. Only for 520 of 622 samples, expression data for RAB2A were available. Note that the number of scored cases is lower than the total number of cases since: i) in some cases, individual cores detached from the slides during the manipulations; ii) clinical information was not available for all patients. In tumor tissues, the IHC signal was associated with the tumor cell component and not with the adjacent or infiltrating stroma.
-
C, DKaplan–Meier distant recurrence‐free interval survival (DRFI 70) (C) and univariate and multivariate Cox regression analysis (D) show that in BC patients, high levels of RAB2A protein predict a poor prognosis and that RAB2A expression is an independent predictor of higher risk of developing a distant metastatic recurrence.
RAB2A regulates matrix degradation by controlling HOP‐dependent late endocytic trafficking of MT1‐MMP
What are the molecular mechanisms and cellular processes through which RAB2A regulates invasiveness in BC? RAB2A and RAB2B are highly homologous mammalian orthologues of the evolutionary (from plant to protozoa) conserved RAB2. These proteins are typically found on the Golgi apparatus and have been proposed to have a role in Golgi‐to‐ER traffic, to control Golgi stacking and the formation of secretory granules 36, 47. However, silencing of RAB2A did not alter the synthesis, secretion, or the activity of soluble MMPs (Appendix Fig S4A–G). Similarly, neither total protein nor total cell surface‐bound levels of MT1‐MMP or α5β1, both required for matrix degradation in focalized invadopodia 48, were affected by silencing of RAB2A (Appendix Fig S4H–K). RAB2A not only localizes to the endoplasmic reticulum (ER)‐Golgi intermediate compartment (ERGIC), but also participates in COPI‐dependent transport via ERGIC 49. Within this context, RAB2A acts together with its effector, glyceraldehyde‐3‐phosphate dehydrogenase (GAPDH) 37, 50, 51. Thus, we tested whether this trafficking axis is important for ECM degradation activity. However, silencing of GAPDH had no detectable effects on matrix degradation (Fig EV2A and B). Collectively, these results suggest that RAB2A regulates matrix degradation independently from its functional role in controlling Golgi‐to‐ER and ERGIC trafficking.
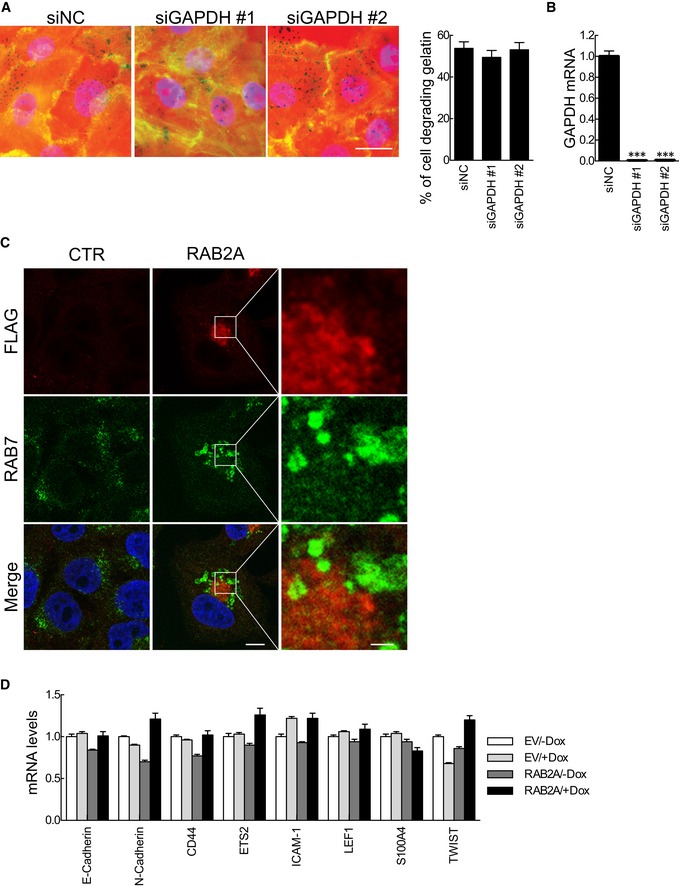
Figure EV2. Silencing GAPDH does not impair ECM degradation. RAB2A causes late endosome enlargement in MCF10A cells, but does not affect prototypical EMT transcription factors and markers.
-
A, BMCF10.DCIS.com cells were transfected with scrambled siRNA (siNC) or siRNAs against GAPDH (siGAPDH). Serum‐starved cells were then plated onto fluorescently conjugated gelatin (red), stimulated with HGF (100 ng/ml) overnight, and stained with phalloidin (green) and DAPI (blue). Efficacy of GAPDH gene silencing was verified by qPCR (B). Scale bar, 50 μm. Data are the mean ± SEM (n > 100 cells/experiment in three independent ones). ***P < 0.001.
-
CDoxycycline‐inducible RAB2A expression MCF10A cells were cultured in the absence (CTR) or presence (RAB2A) of doxycycline and immunostained with anti‐FLAG (red) and anti‐RAB7 (green) antibodies. Merged images with DAPI (blue) are shown on the bottom. Scale bar, 10 μm (inset, 2 μm).
-
DDoxycycline‐inducible empty vector (EV) or RAB2A expression MCF10A cells were cultured in the absence (−Dox) or presence (+Dox) of doxycycline for three days, and the expression of E‐cadherin and mesenchymal genes was quantified by qPCR. Data are the mean ± SEM (n = 3 independent experiments). ***P < 0.001.
Endo/exocytic trafficking has emerged as a critical regulatory step in the control of spatially restricted MT1‐MMP activity 21, 52. Notably, one less investigated, possibly ancestral function of RAB2, is in the regulation of post‐endocytic trafficking. Indeed, the C. elegans orthologous of RAB2, UNC‐108, is required for phagosome biogenesis 53. Whereas, in the fruit fly, active RAB2A was recently shown to be localized in late endosome, where it directly interacts with two critical components of the homotypic fusion and vacuole protein sorting (HOPS) complex, VPS39 and VPS41 involved in fusion events between late endosomes and lysosomes 54. We therefore tested whether RAB2A might control late endosomal recycling of MT1‐MMP. We initially assessed whether constitutively active, GTP‐bound mammalian RAB2A, likewise its Drosophila homologue, localizes into late endosomes and affects endosomal trafficking in BC cell lines. Ectopic expression of constitutively active RAB2A‐Q65L, but not the dominant‐negative RAB2A‐S20N, caused the formation of enlarged vesicular structures, which were positive for both RAB2A and the late endosomal markers RAB7, under conditions in which no alterations nor colocalization of RAB2A with EEA1‐positive early endosome could be detected (Fig 4A and B). Notably, in normal mammary epithelial MCF10A cells, the elevation of wild‐type RAB2A, which prominently localizes into Golgi‐ERGIC structures, was nevertheless sufficient to cause the enlargement of late endosomes (Fig EV2C). Thus, also in mammalian cells, a fraction of RAB2A localizes into late endosomes, where it may control cargo trafficking in these structures. We tested this hypothesis by focusing on MT1‐MMP. We found that RAB2A‐positive late endosomes contained MT1‐MMP (Fig 4C). We further analyzed the recycling of this cargo back to the plasma membranes by employing an MT1‐MMP fused to a pHluorin 14. This fluorophore emits green fluorescent only in a neutral pH environment, thus enabling us to monitor in real‐time exocytic events (revealed as the transient appearance of GFP‐positive, blinking PM spots) of MT1‐MMP‐pHluorin recycling from the acidic endosomal compartment back to the PM by total internal reflection microscopy (TIRF). In control cells, we recorded the frequent appearance of fluorescent‐positive, MT1‐MMP‐pHluorin PM spots (Fig 4D). However, removal of RAB2A significantly reduced the frequency of MT1‐MMP exocytic events (Fig 4D–F, and Movies EV1 and EV2). Taken together, these data indicate that mammalian RAB2A is critically involved in the trafficking of MT1‐MMP from late endosomes to plasma membrane.
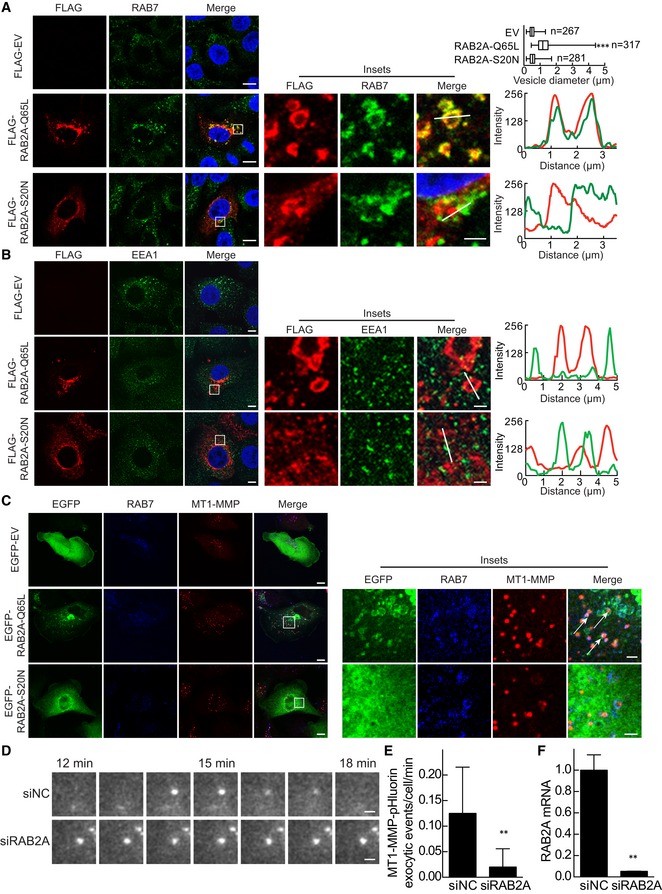
Figure 4. RAB2A localizes on late endosomes positive for MT1‐MMP and is required for MT1‐MMP exocytosis.
-
A, BMCF10.DCIS.com cells were transfected with FLAG empty vector (EV), constitutively active RAB2A‐Q65L, or dominant‐negative RAB2A‐S20N mutant. Cells were immunostained with anti‐FLAG (red) and RAB7 (A, green) or anti‐EEA1 (B, green) antibodies. Merged images with DAPI (blue) are shown on the right. Enlarged endosomes in the boxed region are highly magnified in the insets. Diameters of RAB7‐positive vesicles are also shown. n, number of cells scored for each cell population. The RGB profiler plugin from ImageJ was used to plot colocalization in the lines drawn in the inset images. Scale bars, 10 μm (inset, 2 μm). Data are shown as a box and whiskers diagram. ***P < 0.001.
-
CMDA‐MB‐231 cells were transfected with EGFP‐fused EV, RAB2A‐Q65L, or RAB2A‐S20N. Cells are immunostained with anti‐RAB7 (blue) and anti‐MT1‐MMP (red) antibodies, and their merged images are shown on the right. Enlarged endosomes containing MT1‐MMP in the boxed region are highly magnified in the insets. Note that RAB2A‐Q65L‐ and RAB7‐positive vesicles contain MT1‐MMP (arrows). Scale bars, 10 μm (inset, 2 μm).
-
D–FMDA‐MB‐231 cells expressing MT1‐MMP‐pHluorin transfected with scrambled siRNA (siNC) or siRNA against RAB2A were seeded on type I collagen, and images were acquired for 20‐min period by TIRF microscope. Frequency of MT1‐MMP‐pHluorin exocytic events was quantified (E). The corresponding time‐lapse series are shown in Movie EV1, while an entire cell is shown in Movie EV2. Efficacy of RAB2A gene silencing was verified by qPCR (F). Scale bars, 2 μm. Data are the mean ± SD of 5‐10 cells of least three independent experiments. **P < 0.01.
To gain insights into the molecular pathways underpinning the post‐endosomal function of RAB2A, we focus on the HOPS complex and tested whether, like in Drosophila, mammalian RAB2A directly associates with VPS39 or VPS41. We employed recombinant and purified guanine nucleotide‐loaded, dominant active and dominant‐negative RAB2A proteins to pull down myc‐tagged VPS39 or VPS41 expressed in HEK293T cells. VPS39, but not VPS41 specifically interacted with active, GTP‐loaded RAB2A under conditions in which no association with dominant‐negative RAB2‐S20N, was observed (Fig 5A). The relevance and specificity of the interaction between them was further confirmed by co‐immunoprecipitation experiment using ectopically expressed tagged proteins to overcome the lack of efficient antibodies recognizing endogenous proteins (Fig 5B). Furthermore, the expression of EGFP‐VPS39, but not VPS41, likewise RAB2A, was sufficient to induce the formation of enlarged RAB7‐positive late endosomes, which contained endogenous MT1‐MMP (Fig 5C and D), suggesting that VPS39 is the critical RAB2A effector in the control of MT1‐MMP‐dependent matrix degradation activity. Consistently, silencing of VPS39, but only marginally of VPS41, severely impaired degradation activity to a similar extent as RAB2A knockdown in MCF10.DCIS.com cells (Fig 5E–I) and decreased invasion into Matrigel plugs of MDA‐MB‐231 cells (Fig 5J–L). Additionally and more importantly, VPS39 knockdown abrogated the increase in degradation activity caused by ectopic expression of RAB2A (Fig 5M–Q). Collectively, these results indicate that VPS39 acts as a downstream effector of RAB2A in late endosomes and that a RAB2A–VPS39 post‐endocytic axis is critical for MT1‐MMP‐dependent ECM proteolytic and invasive activity of BC lines.
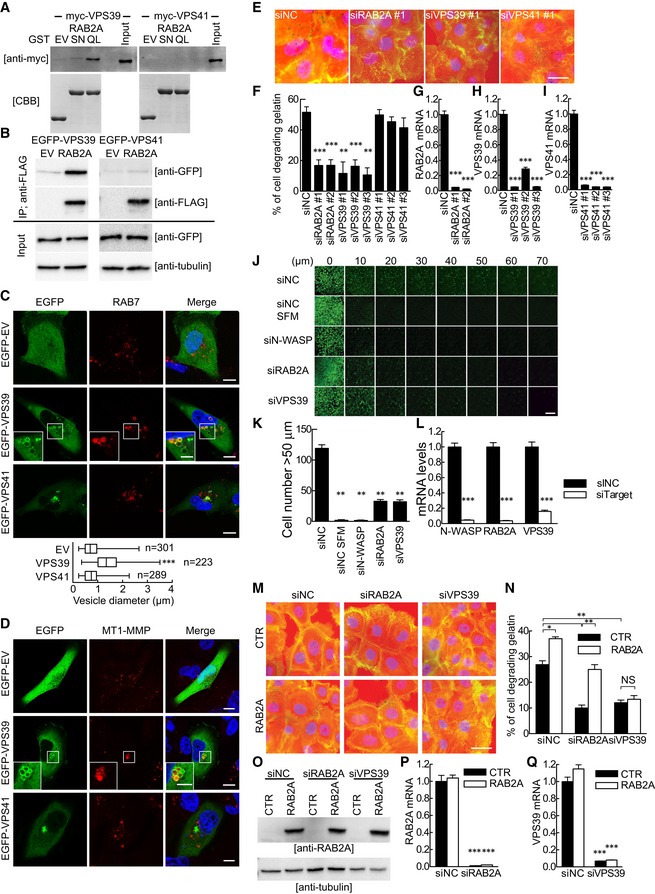
Figure 5. The VPS39–RAB2A axis is crucial for MT1‐MMP‐dependent ECM proteolytic and invasive activity.
-
ATotal cell lysates from HEK293T cells transfected with myc‐VPS39 or VPS41 were incubated with GST empty vector (EV), RAB2A‐S20N (SN), or RAB2A‐Q65L (QL) proteins bound to glutathione sepharose beads. Immunoblotting was performed with anti‐myc antibody. Input lysates are also shown. GST proteins loaded in gels were stained with CBB.
-
BFLAG EV or RAB2A was transiently co‐transfected with EGFP‐VPS39 or VPS41 into HEK293T cells. Immunoprecipitated (IP) fraction from cell lysates with anti‐FLAG antibody and total lysates was immunoblotted with the antibodies indicated on the right.
-
C, DMDA‐MB‐231 cells were transfected with EGFP‐fused EV, VPS39, or VPS41. Cells were immunostained with RAB7 (C, red) or anti‐MT1‐MMP (D, red) antibodies. Merged images with DAPI (blue) are shown on the right. Enlarged endosomes in the boxed region are highly magnified in the insets. Diameters of RAB7‐positive vesicles are also shown. n, number of cells scored for each cell population. Scale bars, 10 μm (inset, 5 μm). Data are shown as a box and whiskers diagram. ***P < 0.001.
-
E–IScrambled siRNA (siNC) or siRNA against RAB2A (siRAB2A), VPS39 (siVPS39), or VPS41 (siVPS41) was transfected into MCF10.DCIS.com cells. Serum‐starved cells were then plated onto fluorescently conjugated gelatin (red), stimulated with HGF (100 ng/ml) overnight, and stained with phalloidin (green) and DAPI (blue). Quantification of gelatin degradation (F) and efficacy of targeted gene silencing verified by qPCR (G–I). Data are the mean ± SEM (n > 100 cells/experiment in at least 4 independent ones). Scale bars, 50 μm. **P < 0.01, ***P < 0.001.
-
J–LInverse invasion assay of MDA‐MB‐231 cells transfected with siRNA oligonucleotides targeting interest genes. Invasive activity is the numbers of cells/field that migrate through Matrigel further than 50 μm (K). Efficacy of targeted gene silencing was verified by qPCR (L). Scale bar, 250 μm. Data are mean ± SD from 3 different fields. **P < 0.01, ***P < 0.001.
-
M–QDoxycycline‐inducible murine RAB2A expression MCF10.DCIS.com cells were transfected with siNC, siRAB2A, or siVPS39 in the absence (CTR) or presence (RAB2A) of doxycycline. Their ECM degradation activities were quantified (n). Total cell lysates were immunoblotted with anti‐RAB2A and anti‐tubulin antibodies (O). Efficacy of targeted gene silencing was verified by qPCR (P, Q). Scale bar, 50 μm. Data are the mean ± SEM (n > 100 cells/experiment in 3 independent ones). *P < 0.05, **P < 0.01, ***P < 0.001, NS, not significant.
Source data are available online for this figure.
RAB2A regulates cell compaction and collective invasion by independently controlling polarized Golgi trafficking of E‐cadherin
Invasive proteolytic programs of BC dissemination can be recapitulated in vitro by monitoring the formation of invasive outgrowth of BC lines in three‐dimensional reconstituted basement membrane overlay cultures. We utilized MCF10.DCIS.com for these assays. These cells form regular, non‐invasive compact spheroids once plated as single cells onto a gel composed of Matrigel and type I collagen. Addition of motogenic factors, including HGF and EGF, triggers an invasive program, which causes the loss of the regular circular shape and the extension of multicellular invasive outgrowth 55 (Fig 6A). Silencing of RAB2A by addition of doxycycline prevented the morphogenetic alteration of the spherical shape and abrogated the formation of HGF‐induced invasive outgrowths. Loss of invasiveness under these conditions is caused by a combination of impaired matrix degradation and increased cell cohesion due to augmented cell–cell adhesion. In normal epithelial cells, the latter process is primarily mediated by E‐cadherin at AJs, the integrity of which is critical for cells to form compact epithelial colonies in 3D as well as in 2D. Conversely, a hallmark of oncogenic transformation is the loss of cohesiveness and of junctional E‐cadherin. Consistently, control, tumorigenic MCF10.DCIS.com cells tend to scatter and form elongated protrusions and loosely adherent colonies when plated sparsely on 2D substrates. Removal of RAB2A increased cell compactness and the formation of epithelial islands (Fig 6B). We quantified these morphological phenotypes and confirmed that removal of RAB2A significantly increased the number of tightly compacted colonies and concomitantly reduced the number of single isolated cells (Fig 6C and D). Next, we monitored the localization of cell–cell junction markers in MCF10.DCIS.com cells. In control MCF10.DCIS.com cells, E‐cadherin, in contrast to what is seen in the normal mammary MCF10A counterpart, was irregularly distributed at the cell surface, formed fragmented AJs, and a sizable fraction of this junctional protein localized in intracellular vesicles, as previously reported 56. Silencing of RAB2A, however, markedly increased cell surface E‐cadherin and ZO‐1, but not P‐cadherin, consistent with the acquisition of epithelial morphological features (Fig 6E). RAB2A silencing induced a similar morphological re‐epithelialization, marked by augmented junctional E‐cadherin and ZO‐1 at the cell surface, also in other MCF10A derivatives, premalignant MCF‐10AneoT and malignant MCF10‐CA1a 57, 58 (Fig 6F and G). In all these cases, the total amount of E‐cadherin was not altered by RAB2A knockdown (Fig 6H), suggesting that RAB2A may impinge on E‐cadherin trafficking.
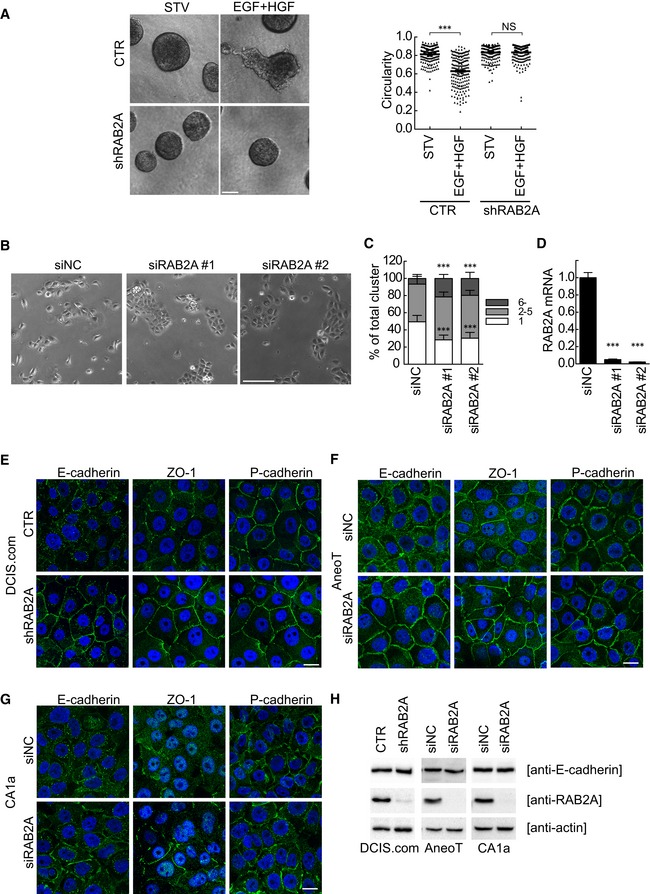
Figure 6. Silencing RAB2A promotes cell compaction and increases cell surface E‐cadherin and ZO‐1.
-
ADoxycycline‐inducible RAB2A‐shRNA MCF10.DCIS.com cells were incubated on a thick layer of Matrigel for 4 days to allow spheroid formation in the absence (CTR) or presence (shRAB2A) of doxycycline. Cells were stimulated with 5 ng/ml EGF and 20 ng/ml HGF (EGF+HGF) or left starved (STV) for 9 days. Representative phase contrast images are shown. Invasive activity of the cells was expressed by circularity (with a value of 1 representing perfect circularity = no invasion) of each acinus. Scale bar, 100 μm. Data are the mean ± SEM (n > 100 spheroids in 4 independent experiments. ***P < 0.001, NS, not significant.
-
B–DMCF10.DCIS.com cells (104 cells) transfected with scrambled siRNA (siNC) or siRNA against RAB2A (siRAB2A) were plated onto 6‐well dish. Representative phase contrast images (B) and the distribution of cell numbers per cluster of the indicated cell number (C) are shown. Efficacy of RAB2A gene silencing was verified by qPCR (D). Scale bar, 200 μm. Data are means ± SD of 10 fields (n > 60 cells/field) of independent 4 independent experiments. ***P < 0.001.
-
EDoxycycline‐inducible RAB2A‐shRNA MCF10.DCIS.com cells were cultured in the absence (CTR) or presence (shRAB2A) of doxycycline for three days and immunostained with antibodies indicated on the top (green) and DAPI (blue). Scale bar, 10 μm.
-
F, GMCF‐10AneoT (E) and MCF10‐CA1a (F) cells were transfected with scrambled siRNA (siNC) or siRNA against RAB2A, and immunostained with antibodies indicated on the top (green) and DAPI (blue). Scale bars, 10 μm.
-
HTotal cell lysates from (E, F and G) were immunoblotted with anti‐E‐cadherin, RAB2A, and anti‐actin antibodies.
Source data are available online for this figure.
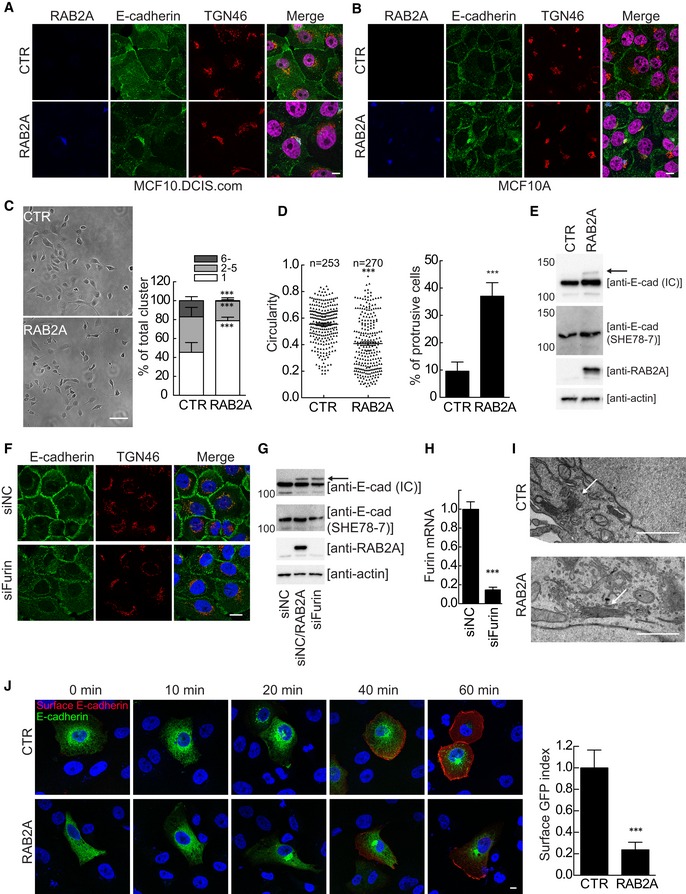
We next investigated whether elevation of RAB2A expression that mimics the alteration found in human BC impacts on E‐cadherin surface distribution and trafficking. Ectopic expression of RAB2A reduced junctional E‐cadherin, the opposite of what is seen following loss of RAB2A in both MCF10.DCIS.com and MCF10A cells (Fig 7A and B). Notably, under these conditions, E‐cadherin accumulated in perinuclear vesicular structures that were positive for the trans‐Golgi network (TGN) marker TGN46. The reduction in junctional E‐cadherin was mirrored by a loss of epithelial cell compaction (significantly lower number of cell in clustered colonies and a concomitant increased of single isolated cells) as revealed by plating MCF10A cells at low density (Fig 7C), without affecting cell survival (Appendix Fig S5). Under these conditions, RAB2A also caused the loss of the typical cuboidal epithelial shape and promoted the extension of elongated, mesenchymal‐looking cellular protrusions (Fig 7D). Importantly, however, this morphological mesenchymal‐like transition was not caused or accompanied by an E‐cadherin/N‐cadherin switch, nor by the up‐regulation of prototypical EMT transcription factors and markers (Fig EV2D).
Figure 7. RAB2A overexpression impairs trafficking of E‐cadherin from Golgi to cell surface.
-
A, BDoxycycline‐inducible RAB2A expression MCF10.DCIS.com (A) and MCF10A (B) cells were cultured in the absence (CTR) or presence (RAB2A) of doxycycline, and immunostained with anti‐RAB2A (blue), anti‐E‐cadherin (green), and anti‐TGN46 (red) antibodies. Merged images with DAPI (magenta) are shown on the right. Scale bars, 10 μm.
-
CCTR and RAB2A MCF10A cells (104 cells) were plated onto 6‐well dish. Representative phase contrast images (left) and the distribution of cell numbers per cluster composed of the indicated number of cells are shown. Scale bar, 100 μm. Data are means ± SD of 10 fields (n > 20 cells/field) from 3 independent experiments. ***P < 0.001.
-
DThe circularity of CTR and RAB2A MCF10A cells and the percentage of cells with protrusive structure were quantified. Data are means ± SD of ten independent fields (n > 100 cells/field). n, number of cells scored for each cell population. ***P < 0.001.
-
ETotal cell lysates from (C) were immunoblotted with antibodies anti‐E‐cadherin, which recognize either an epitope in the cytoplasmic domain (IC), an epitope in the extracellular domain of mature E‐cadherin (SHE78‐7), respectively, or anti‐RAB2A, and anti‐actin. An arrow indicates the unprocessed form of E‐cadherin.
-
F–HMCF10A cells were transfected with scrambled siRNA (siNC) or siRNA against furin, and immunostained with anti‐E‐cadherin (green) and anti‐TGN46 (red) antibodies. Merged images with DAPI (blue) are shown on the right (F). Scale bar, 20 μm. Total cell lysates were immunoblotted with antibodies indicated on the right (G). Efficacy of furin silencing was verified by qPCR (H). Data are the mean ± SEM of three independent experiments. ***P < 0.001.
-
IRepresentative electron micrographs of Golgi stacks (arrows) of CTR and RAB2A MCF10.DCIS.com cells. Scale bars, 1 μm.
-
JCTR and RAB2A MCF10A cells were transfected with Str‐KDEL_SBP‐EGFP‐E‐cadherin (green). At the indicated time points after the addition of biotin, cells were fixed and stained without permeabilization with anti‐GFP antibody, followed by Alexa Fluor 568‐conjugated secondary antibody (red). The cell surface and total levels of SBP‐EGFP‐E‐cadherin at 60 min after the addition of biotin were quantified using ImageJ software on non‐saturated images, and surface/total ratio was expressed as a surface GFP index (relative to control cells). Scale bar, 20 μm. Data are the mean ± SEM (n = 10 cells of 3 independent experiments). ***P < 0.001.
Source data are available online for this figure.
Notably, despite total E‐cadherin protein levels were not affected by the elevation of RAB2A, we noticed the appearance of a low mobility, higher molecular weight form that frequently is the results of alterations of E‐cadherin processing and Golgi transport pathways (Fig 7E). Indeed, E‐cadherin is synthesized as a 140 kDa precursor protein, and its N‐terminal pro‐region is cleaved in the TGN by pro‐protein convertase family proteins, the most important of which is furin 59. This processing is essential for proper TGN exit and to enable homotypic binding of E‐cadherin at adhesive junctions 60. Thus, RAB2A may affect E‐cadherin processing. Consistently, the low mobility reactive band of E‐cadherin was not detected by a monoclonal antibody (SHE78‐7) that recognizes only the mature, cleaved, but not the precursor form of E‐cadherin 61 (Fig 7E). Furthermore, siRNA‐mediated depletion of furin reduced junctional E‐cadherin and caused the appearance of a higher molecular weight form of E‐cadherin similarly to RAB2A overexpression (Fig 7F–H). RAB2A‐dependent alteration in E‐cadherin processing and junctional localization was not affected by silencing VPS39 or GAPDH (Fig EV3), indicating that RAB2A regulates E‐cadherin trafficking independently from VPS39 and GAPDH. Of note, ultrastructural electron microscopy examination revealed that RAB2A caused a significant enlargement of the Golgi stacks (Fig 7I). These alterations were accompanied by extensive intermixing and enlargement of ERGIC‐53‐, GM130‐, and TGN46‐positive structures, but not of calnexin‐positive ER (Fig EV4), providing a plausible reason for defective E‐cadherin Golgi‐to‐PM trafficking.
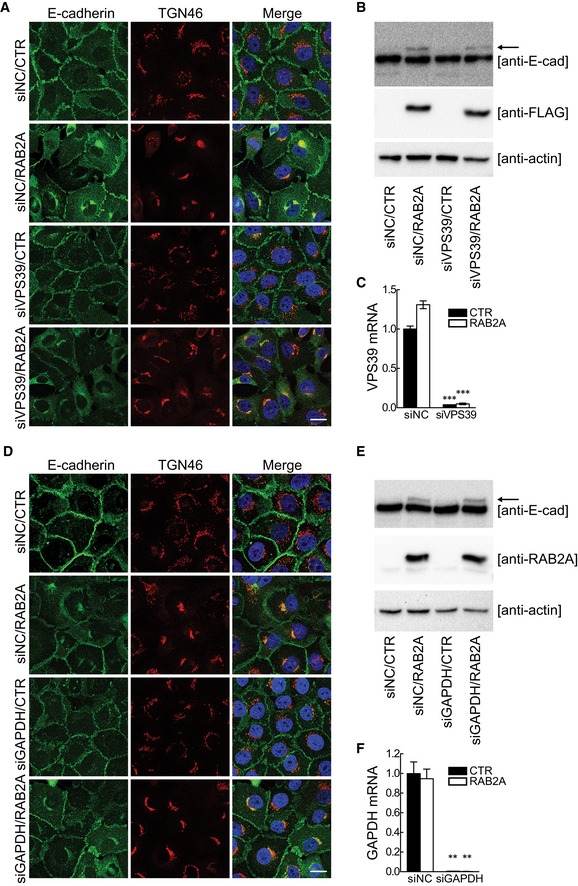
Figure EV3. Silencing of neither VPS39 nor GAPDH restores E‐cadherin trafficking stacked by RAB2A overexpression.
-
A–FDoxycycline‐inducible murine RAB2A expression MCF10.DCIS.com cells were transfected with scrambled siRNA (siNC) or siRNA against VPS39 (siVPS39) (A–C) or GAPDH (siGAPDH) (D–F) in the absence (CTR) or presence (RAB2A) of doxycycline. Cells were immunostained with anti‐E‐cadherin (green) and anti‐TGN46 (red) antibodies (A, D). Merged images with DAPI (blue) are shown on the right. Total cell lysate was immunoblotted with antibodies indicated on the right (B, E). Pro‐region form of E‐cadherin is shown as an arrow. Efficacy of targeted gene silencing was verified by qPCR (C and F). Scale bars, 20 μm. Data are the mean ± SEM (n = 3 independent experiments). **P < 0.01, ***P < 0.001.
Source data are available online for this figure.
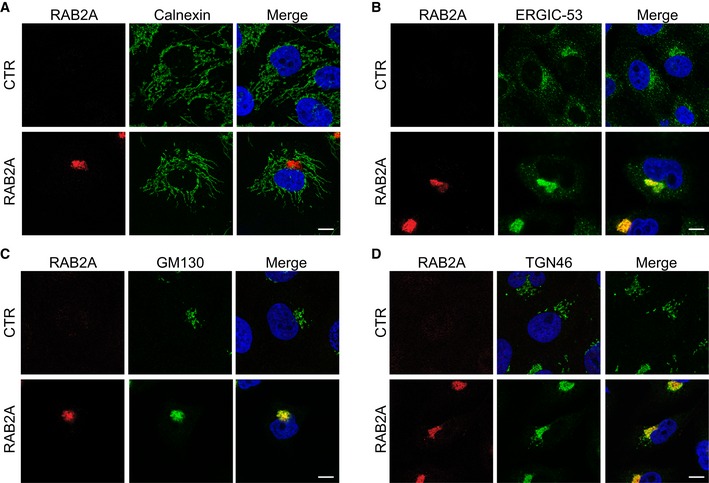
Figure EV4. Golgi compaction in RAB2A overexpression.
-
A–DDoxycycline‐inducible RAB2A expression MCF10A cells were cultured in the absence (CTR) or presence (RAB2A) of doxycycline and immunostained with anti‐RAB2A (red) and anti‐calnexin (A, green), anti‐ERGIC53 (B, green), anti‐GM130 (C, green), or anti‐TGN46 (D, green) antibodies. Merged images with DAPI (blue) are shown on the right. Scale bars, 10 μm.
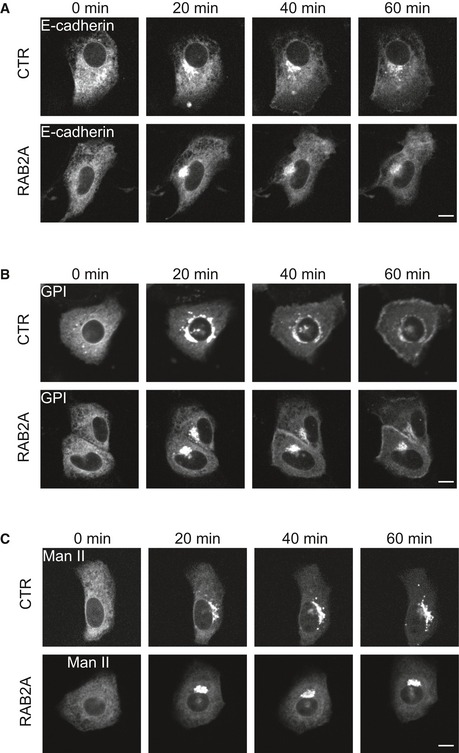
To further investigate the role of RAB2A in this process, we took advantage of the retention using selective hooks (RUSH) system 62. In this system, a reporter protein fused with streptavidin‐binding peptide (SBP) is retained at the donor compartment via binding with the hook fused with streptavidin. Addition of biotin competitively inhibits the interaction between the hook and the reporter, which enables the reporter to be synchronously released from the donor to its acceptor compartment. To monitor the trafficking of E‐cadherin from ER to plasma membrane in living cells, we used the ER retention signal (Lys‐Asp‐Glu‐Leu; KDEL) fused with streptavidin and SBP‐EGFP‐E‐cadherin, as the hook and the reporter, respectively. As expected, in control cells, SBP‐EGFP‐E‐cadherin was prominently localized at ER before treatment of biotin (0 min, Movie EV3 or Fig EV5A). Addition of biotin induced the synchronous release of E‐cadherin from ER to perinuclear Golgi in 20 min and its subsequent trafficking to the PM. Ectopic expression of RAB2A did not affect the trafficking from ER to Golgi, but impaired the trafficking from Golgi to the PM (Movie EV3 or Fig EV5A). Contrary to what seen in control, only rarely we observed the formation of tubulo/vesicular‐like structures emanating from perinuclear Golgi and extending centrifugally toward the PM (Movie EV3). This tubulation defect was accompanied by the accumulation of SBP‐EGFP‐E‐cadherin into perinuclear Golgi compartments. Importantly, no obvious trafficking alterations were seen when other RUSH cargo, including glycosylphosphatidylinositol (GPI), known to follow a similar ER‐to‐Golgi‐to‐PM routes was monitored (Movie EV4 or Fig EV5B). Similarly, RAB2A expression did not affect the transport of the Golgi enzyme α‐mannosidase II (Man II) from ER to Golgi (Movie EV5 or Fig EV5C). These latter findings reinforce the notion that RAB2A acts specifically on E‐cadherin Golgi‐to‐PM transport pathway. In keeping with this latter notion, we also verified the appearance of E‐cadherin at the PM by immunostaining surface SBP‐EGFP‐E‐cadherin with anti‐GFP antibody without permeabilization. Quantification of the PM‐localized anti‐GFP signal intensity with respect to the total EGFP‐E‐cadherin confirmed that RAB2A significantly reduced its translocation to the PM (Fig 7J).
Figure EV5. RAB2A overexpression specifically reduces E‐cadherin translocation to the PM.
-
A–CDoxycycline‐inducible RAB2A expression MCF10A cells cultured in the absence (CTR) or presence (RAB2A) of doxycycline were transfected with Str‐KDEL_SBP‐EGFP‐E‐cadherin (A), Str‐KDEL_SBP‐EGFP‐GPI (B), or Str‐KDEL_ManII‐SBP‐EGFP (C). Biotin was added to the media to release the reporters from the hook Str‐KDEL at the ER synchronously. Still images are from Movies EV3, EV4, and EV5. Scale bars, 10 μm.
Discussion
Through functional screening for RAB family members, here, we identified RAB2A as a major oncogenic player in the progression of human BC via promoting a proteolytic‐dependent invasive program of mesenchymal dissemination. We showed that RAB2A elevation in CNV and protein levels is a frequent occurrence in human BC and significantly associates with poor prognosis markers. Furthermore, among more than 500 BC patients, elevated expression of RAB2A is specifically associated with dramatically reduced recurrence‐free survival and its predictive power of distant relapse events is independent of other clinical and pathological parameters. It is worth noting that while this study was in progress, RAB2A has also been shown to promote the expansion of BC stem‐like cells, to increase tumorigenicity in in vivo murine models, and to be associated with increased cancer mortality 63. The small size of human tumor samples (~65) tested in the latter study prevented, however, to assess the predictive power of RAB2A. Our analysis instead clearly indicates that elevated expression of RAB2A is a powerful and independent predictor of metastatic recurrence in human BC patients and may thus represent a useful prognosis biomarker. This latter notion is further strengthened and mirrored by the diverse roles played by RAB2A in the biology of BC that the studies by Luo et al 63 and ours reveal. Indeed, RAB2A elevation may couple increase self‐renewal, inextricably linked to the expansion of stem cell features, with augmented invasiveness due to the acquisition of proteolytic, mesenchymal migratory properties. Whether these two apparently distinct functions of RAB2A represent two faces of the same coin occurring simultaneously or are temporally distinct, evolutionary stages in the course of tumor progression remains to be determined. Notably, RAB2A induction of BC stemness is accompanied by the emergence of mesenchymal features and transcriptional programs 63. We also noticed that elevation of RAB2A promotes pericellular proteolytic activity and loss of surface E‐cadherin, hallmarks of a switch to a more mesenchymal identity. However, in the BC cells we tested, RAB2A does so without any detectable changes in the transcriptional program canonically associated with EMT (Fig EV2D), but by controlling different trafficking routes. These apparently diverse results can be reconciled within the emerging notion indicating that EMT as well as the paths to the acquisition stemness and invasiveness is reversible and frequently unstable processes that cannot be captured by an “all or none” binary logic 25. Rather, these processes are better described as an analogical spectrum of partial states. Interconversion among these states is not only achieved through alteration of transcriptional programs, but also by exploiting transient biochemical and cellular processes, including trafficking networks 25. Thus, elevation of RAB2A may, in some instance, tip the transcriptional balance toward more mesenchymal features. This transition, however, can also be achieved by rewiring membrane trafficking routes.
At the molecular levels, some of these diverse functional roles, including aberrant ERK1/2 activation 63 and altered PM transport of junctional E‐cadherin (our work), can be interpreted within the well‐established role exerted by RAB2A in vesicular trafficking. RAB2A has been shown to control ER‐to‐Golgi trafficking, epitomized by its specific localization into ERGIC and its requirement for COPI‐dependent transport via ERGIC 49, and for Golgi transport, as outlined by its interactions with GRASP55 a factor required for the stacking of the Golgi cisternae 36. Through regulation of transport within ERGIC, for example, RAB2A may facilitate the activation of ERK1/2, which has also been reported to localize in this compartment 63, albeit the molecular mechanisms through which this might be achieved remain unclear. Conversely, RAB2A regulation of Golgi stacking appears critical for the maturation and subsequent plasma membrane transport of E‐cadherin. Indeed, we showed that: i) RAB2A silencing fragments Golgi stacks (not shown), which are, instead, enlarged by elevation of the protein; ii) aberrant expression of RAB2A delays the trafficking to the PM of E‐cadherin, which becomes entrapped in the enlarged Golgi stacks, where altered furin‐mediated proteolytic processing further concurs to impair the proper surface localization of this critical junctional protein. What are the exact molecular players RAB2A uses to control E‐cadherin trafficking remains to be investigated as none of the known RAB2A effectors that have so far been identified seem to participate in the process. While the identification of novel RAB2A effectors may shed some lights onto how this small GTPase acts in the control of E‐cadherin Golgi‐to‐PM polarized transport, it remains possible that the structural alteration of the Golgi stacks is the critical determinant of altered E‐cadherin trafficking and processing. Whatever the case, the biological consequences of the aberrant E‐cadherin Golgi‐to‐PM transport are remarkable since they directly contribute to the loss of epithelial features, decrease cell compactness in 2D, and increase dispersal of tumor spheroid in 3D that accompanies the manipulations of RAB2A levels we performed.
Our data further illuminate on an unconventional, possibly more ancestral trafficking role of RAB2A. Consistently with its function in C. elegans and more recently also in Drosophila 53, 54, also mammalian RAB2A appears to be critical for the control of post‐endocytic cargo trafficking. A number of evidence support this contention: i) the presence of activated RAB2A in RAB7‐positive late endosomes; ii) the localization of a typical, at least in cancer cell lines, late endosomal cargo, MT1‐MMP, in these structures and the aberrant regulation of the exocytic transport of this metalloprotease from late endosome to the PM; iii) the physical interaction with the HOPS complex component, VPS39 64; iv) the finding that downregulation of VPS39 not only mimics RAB2A loss‐of‐function phenotypes, but also prevents RAB2A‐induced increase in MT1‐MMP‐dependent matrix degradation activity. It is of note that the action of RAB2A is specifically restricted to the control of post‐endocytic transport of MT1‐MMP that is internalized from PM. It must be pointed out that MT1‐MMP, at the PM, is thought to be rapidly inactivated by association with tissue inhibitors of metalloproteases 65 that are particularly abundant in cancer cells 3, 16. Hence, a fraction of MT1‐MMP must be constantly delivered from intracellular endosomal compartment to PM invadopodia, where its transient activity can be exerted before inhibition ensues 66. This mode of action accounts also for the finding that total surface MT1‐MMP is not affected by the loss of RAB2A, which, instead, specifically impairs endosomal recycling of the protease. Mechanistically, how RAB2 controls this step remains to be investigated. However, preliminary evidence indicates that the loss of RAB2A as well as VPS39 dramatically impairs the motility of MT1‐MMP‐positive late endosomes, which aberrantly accumulate around the nucleus. The motility and spatial alterations of endosomal compartment caused by RAB2A silencing likely impede the delivery of MT1‐MMP to invadopodia, presumably by impacting on microtubule transport as it has been recently proposed 67: a possibility that is currently under investigation. It is also noteworthy that it is primarily activated RAB2A to be found on late endosomal structures. This suggests that some cell types may have learned to use the function of a Golgi localized key factor, such as RAB2A, for subsequent regulation of endosomal function. This unconventional function may be promoted by and eventually exploited in all those situations where aberrant elevation of RAB2A levels is selected, such as in human BC.
In summary, our data reveal that RAB2A is new critical membrane trafficking players in the regulation of mesenchymal properties of normal and tumorigenic cells and a critical determinant of an invasive, proteolytic mode of BC progression. They further highlight the extraordinary flexibility of the trafficking circuitries which can be adapted to control the proper location, activity of diverse cargos, increasing tumor cells plasticity, and ultimately enhancing tumor progression.
Materials and Methods
Plasmids, antibodies, and reagents
The plasmids pKKACEMam1‐N‐EGFP‐Vps39 and pKKACEMam1‐N‐EGFP‐Vps41 were gifts from K. Kontani (Meiji Pharmaceutical University, Tokyo, Japan). Str‐KDEL_ManII‐SBP‐EGFP, Str‐KDEL_SBP‐EGFP‐GPI, and Str‐KDEL_SBP‐EGFP‐E‐cadherin were gifts from F. Perez (Institute Curie, Paris, France) based on the pIRESneo3 (Takara Bio Inc.). Murine RAB2A was amplified from mouse embryonic fibroblast cDNA and inserted into pEGFP vector (Takara Bio Inc.) or pCMV vector with FLAG tag. Constitutively, active (Q65L) and dominant‐negative (S20N) RAB2A mutants were generated by PCR‐mediated mutagenesis. For overexpression by lentiviral infection, FLAG‐tagged mouse RAB2A was subcloned in pENTRY vector and recombined to TET ON pSLIK‐hygro (Addgene). For shRNA for human RAB2A, three pairs of cDNA oligonucleotides were designed to target human RAB2A mRNA with web‐based software from RNAi Codex (cancan.cshl.edu/cgi-bin/Codex/Tools.cgi). After synthesized, the double‐strand oligos were inserted to the vector pENTR/U6 (Thermo Fisher Scientific) and recombined to pSLIK‐hygro. Lentiviruses from the plasmids were infected to MDA‐MB‐231 cells. Real‐time PCR was performed to validate gene silencing efficiency of these shRNA after 3 days with 400 ng/ml doxycycline treatments. The double‐strand oligo‐DNAs with the best silencing efficiency for RAB2A were as follows:
5′‐AGCGCGGAGCTTTACTAGTTTACGATTAGTGAAGCCACAGATGTAATCGTAAACTAGTAAAGCTCCT‐3′ and
5′‐GGCAAGGAGCTTTACTAGTTTACGATTACATCTGTGGCTTCACTAATCGTAAACTAGTAAAGCTCCG‐3′.
Antibodies used were as follows: rabbit polyclonal anti‐RAB2A (#15420‐1‐AP, Proteintech), mouse monoclonal anti‐MT1‐MMP (#MAB9181, R&D Systems); rabbit polyclonal anti‐RAB7 (#9367, Cell Signaling Technology); goat polyclonal anti‐EEA1 (N‐19) (#sc‐6415, Santa Cruz Biotechnology, Inc.); mouse monoclonal anti‐E‐cadherin (#610181), GM130 (#610822), and P‐cadherin (#610228) (BD Transduction Laboratories); mouse anti‐actin (clone AC‐74), FLAG (#F1804), α‐tubulin (clone DM1A), and vinculin (clone hVIN‐1) (Sigma‐Aldrich); sheep polyclonal anti‐TGN46 (#AHP500GT, Serotec); mouse monoclonal anti‐E‐cadherin (SHE78‐7), rabbit polyclonal anti‐ZO‐1 (#PA5‐21965), mouse monoclonal anti‐calnexin (#MA3‐027) (Thermo Fisher Scientific); mouse anti‐ERGIC‐53 (#ALX‐804‐602, Enzo Life Sciences); mouse monoclonal anti‐MT1‐MMP (LEM‐2/15.8, EMD Millipore); and mouse monoclonal anti‐α5/β1 (clone P1D6, Immunological Sciences). Mouse anti‐myc (hybridoma 9E10) was produced in‐house in our departmental antibody facility. Rabbit immunopurified anti‐GFP was a gift from Jan Faix (Medizinische Hochschule Hannover, Hannover, Germany).
The following materials were used: recombinant human HGF (PROSPEC); GM6001 (EMD Millipore); calcein AM (Corning Life Sciences); rat‐tail type I collagen High Concentration, Matrigel Basement Membrane Matrix High Concentration (BD Transduction Laboratories); TRITC/FITC‐phalloidin (Sigma‐Aldrich); gelatin from pig skin, Oregon Green 488 Conjugate, Alexa Fluor 594 protein labeling kit, CyQUANT Cell Proliferation Assay Kit, BioCoat Matrigel Invasion Chamber with GFR Matrigel Matrix (Thermo Fisher scientific); and Cultrex 3D Spheroid Cell Invasion Assay (Trevigen).
siRNA experiments
All the sequences of Silencer Select siRNAs (Thermo Fisher Scientific) are shown as a table (Appendix Table S2). For all siRNA experiments, Silencer Select Negative Control No. 2 siRNA (Thermo Fisher Scientific) was used as scrambled siRNA (siNC).
Cell lines
BT474, BT483, HCC1954, HEK293T, HMEC, JIMT‐1, MCF7, MCF10A, MDA‐MB‐175, MDA‐MB‐231, MX‐1, UACC‐812, and ZR‐75‐1HeLa, HT1080, BT‐20, BT‐549, SUM‐149, HCC‐1428, HS‐578T, 4T1, U937, and MDA‐MB‐231 cells were obtained from ATCC and grown according to ATCC specifications. MCF10.DCIS.com cells were described in 44. MDA‐MB‐231 cells stably expressing MT1‐MMP‐pHLuorin were previously described 44. MCF10ANeoT and MCF10ACA1a cells were obtained from the Barbara Ann Karmanos Center (Detroit, MI, USA).
Screening by matrix degradation
ViewPlate‐96 Black, Optically Clear Bottom (PerkinElmer) microplates were coated with 0.25 mg/ml gelatin from pig skin, Oregon Green 488 Conjugate, and cross‐linked with 0.5% glutaraldehyde. MDA‐MB‐231 cells were reverse‐transfected with siRNA (5 nM) using Lipofectamine RNAiMAX transfection reagent (Thermo Fisher Scientific) according to the manufacturer's instructions in the presence of 20 μM GM6001. Two days after transfection, each well was replaced with fresh media without GM6001. After further one‐day incubation to allow gelatin degradation, plates were fixed with 4% paraformaldehyde, permeabilized with 0.2% Triton X‐100, washed in PBS, and stained with DAPI and TRITC‐phalloidin.
Matrix degradation assay
Labeling of gelatin with the Alexa Fluor 594 dye was performed using the Alexa Fluor 594 protein labeling kit according to the manufacturer's instructions. Glass coverslips (20 mm in diameter) were coated with 2 mg/ml Alexa Fluor 594–gelatin and cross‐linked with 0.5% glutaraldehyde. Cells were plated onto matrix‐coated coverslips and incubated at 37°C to allow degradation by 100 ng/ml HGF, then fixed with 4% paraformaldehyde, permeabilized with 0.2% Triton X‐100, washed in PBS, and stained with DAPI and FITC‐phalloidin.
Matrix degradation activity was measured by counting the number of cells degrading gelatin identified as dark black foci (similar results were obtained by measuring the total relative area of degradation with respect to total area of degradation in control samples normalized for the number of cells).
Inverse invasion assay
Inverse invasion assays were performed as described previously 46, 68. Briefly, Matrigel was diluted in an equal volume of ice‐cold PBS supplemented with 25 μg/ml fibronectin. 100 μl of the diluted Matrigel mix was pipetted into a transwell inserts containing permeable support polycarbonate membrane of 8.0 μm pore size, inserted into a well of a 24‐well tissue culture plate, and left to set at 37°C. The transwells were then inverted, and 4 × 10⁴ MDA‐MB‐231 cells were seeded on the other side of the filter for 4 h at 37°C, covered with the lid of 24‐well tissue culture plate. The transwells were inverted again, washed three times with serum‐free medium, and finally placed with 600 μl of serum‐free medium at the lower chamber of the plate, while 100 μl of DMEM supplemented with 10% FCS and 100 ng/ml HGF was added on top of the transwell. In this assay, cells invade upwards in Matrigel toward the gradient of serum and HGF for up to 2 days. Cells were then stained with 4 μM calcein AM for 1 h at 37°C and viewed by confocal microscopy (Leica TCS SP2 microscope). Optical sections were captured at 5‐μm intervals. The resulting images were analyzed and quantified by ImageJ software. Cells in the 20 μm or 50 μm section and above were considered invasive for quantitation purposes. Data were generated from three different transwells, and optical sections were taken from three areas of each transwell.
IHC analysis
Immunohistochemical (IHC) analysis of RAB2A expression was performed on formalin‐fixed, paraffin‐embedded tissue microarrays, prepared with tumor breast specimens, using a commercial rabbit anti‐RAB2A antibody (Proteintech, Catalog number: 15420‐1‐AP) which was tested for specificity (see Appendix Fig S3A) used at a dilution of 1:500 following an antigen retrieval procedure in citrate pH 6.0. Immunocomplexes were visualized by the EnVision™+ HRP Rabbit (DAB+) kit (DAKO) (Catalog number: K4011), and acquired with the Aperio ScanScope system (Leica Biosystems). RAB2A high expression was initially defined as low (IHC score 0.5–1), moderate (IHC score 1.5–2), or high (IHC score 3). Since only RAB2A high expressing tumor shows the worst prognosis, and low or moderate RAB2A expression shows overlapping Kaplan–Meier curves and no statistical differences in a univariate Cox proportional hazards model test (see Appendix Fig S3C), we categorized tumor samples in high expression and low–moderate expression and presenting data as high vs. low protein expression. P‐values (Pearson) were measured by chi‐square test. For univariate and multivariate analysis, hazard ratio (HR) and 95% confidence intervals were obtained from the Cox proportional regression method. Data analysis was performed using JMP 10.0 statistical software (SAS Institute, Inc).
Quantification of secreted matrix metalloproteinase‐related proteins
Confluent BC cells were cultured in serum‐free medium for 24 h. The conditioned medium was collected, and matrix metalloprotease‐related proteins in the medium were detected with Quantibody Human MMP Array 1 (RayBiotech), a multiplexed sandwich ELISA‐based array platform, according to the manufacturer's instructions. Images were acquired by GenePix 4000B Microarray Scanner and quantified by GenePix Pro 5.1 software (Molecular Devices).
Flow cytometric analysis
Expression of MT1‐MMP or integrin at the cell surface was analyzed by flow cytometry as described previously 31. Briefly, 5 × 10⁵ cells were harvested and incubated with mouse anti‐MT1‐MMP or mouse anti‐integrin α5β1 at 4°C for 1 h and then incubated with the secondary antibody at 4°C for 1 h. After fixation with 4% paraformaldehyde, fluorescence‐activated cell sorting data were acquired with the FACSCanto (Becton Dickinson) flow cytometer. Analysis was performed using FlowJo version 4.6.2 (Treestar).
Zymography
Confluent MCF10.DCIS.com cells were cultured in serum‐free medium for 24 h. The conditioned medium was harvested and mixed with non‐reducing SDS gel sample buffer and applied without boiling to 8% polyacrylamide gel containing 1 mg/ml gelatin. After electrophoresis, the gels were washed twice in 100 ml of 2.5% Triton X‐100 for 30 min at room temperature and incubated in developing buffer (50 mM Tris–HCl (pH 7.6), 5 mM CaCl2, 200 mM NaCl) at 37°C for 20 h. Gels were stained with Coomassie Brilliant Blue (CBB) and destained appropriately. The intensities of the bands in zymogram gels were quantified by ImageJ.
MT1‐MMP‐pHLuorin exocytosis assay
MDA‐MB‐231 cells stably expressing MT1‐MMP‐pHluorin were plated on 28‐mm coverslips coated with 2.2 mg/ml polymerized type I collagen. Cells were incubated for 1 h at 37°C, and images were acquired for 20 min by TIRF microscopy (4 images/min). The number of exocytic events of MT1‐MMP‐pHluorin (i.e., GFP flashes) was manually measured per minute and per cell as described 20.
RUSH system
Standard procedures using RUSH system were as previously described 62. MCF10A cells were transiently transfected with plasmids encoding both the hook and the reporter by FuGENE HD (Promega). Cells are placed on gelatin‐coated coverslips in the media containing 100 nM avidin for retention of the reporter efficiently. 40 μM D‐biotin final was introduced at time 0 to release the reporter. For cell surface labeling, fixed cells without permeabilization cells are immunostained with rabbit anti‐GFP followed by incubation with anti‐rabbit Alexa Fluor 568‐conjugated antibody.
Co‐immunoprecipitation
Standard procedures of co‐immunoprecipitation were as described previously 69. In brief, HEK293T cells were transiently transfected using Lipofectamine 2000 (Thermo Fisher Scientific) according to the manufacturer's instructions. 48 h after transfection, cells were solubilized with 0.4 ml buffer A consisting of 40 mM Hepes‐NaOH (pH 7.4), 75 mM NaCl, 15 mM NaF, 1 mM Na3VO4, 10 mM Na4P2O7, 2 mM EDTA, 1% NP‐40, and Protease Inhibitor Cocktail Set III, EDTA‐Free (EMD Millipore). The supernatants were pre‐cleared and immunoprecipitated with Protein G Fast Flow (10 μl) conjugated with 2 μg of anti‐FLAG monoclonal antibody. After incubation at 4°C for 90 min, the resin was washed three times with TBS containing 0.1% NP‐40 and three more times with 100 μl buffer consisting of 75 mM Tris–HCl (pH 7.6), 100 mM NaCl, 1 mM EDTA, and 0.1% NP‐40. Immunoprecipitated proteins were incubated with Laemmli buffer containing β‐mercaptoethanol, boiled and analyzed by SDS–PAGE for immunoblotting detection with anti‐FLAG, anti‐GFP, and anti‐α tubulin antibodies followed by incubation with secondary antibodies coupled to horseradish peroxidase (Cell Signaling).
GST pull‐down
The association between RAB2A and myc‐tagged VPS39 or VPS41 was assayed as described previously 69 with small modifications. HEK293T cells were transfected with pCMV5 that contains the cDNA encoding myc‐VPS39 or VPS41. The cells were solubilized with lysis buffer containing 20 mM Hepes‐NaOH (pH 7.4), 100 mM NaCl, 1 mM DTT, 5 mM MgCl2, 15 mM NaF, 1 mM Na3VO4, 1% (3‐[(3‐cholamidopropyl)‐dimethylammonio]‐1‐propanesulfonate (CHAPS), and Protease Inhibitor Cocktail Set III, EDTA‐Free. GST‐fused RAB2A mutants were induced by isopropyl β‐D‐1‐thiogalactopyranoside treatment of pGEX6P‐1‐transformed DH5a E. coli bacteria, and bound to glutathione Sepharose 4B (GE Healthcare Life Sciences). To prepare guanosine 5′‐[γ‐thio] triphosphate (GTPγS)‐ and GDP‐bound forms of RAB2A, the GST‐RAB2A Q65L or S20N mutants bound to resin were incubated with GTPγS or GDP (1 mM), respectively, at room temperature for 90 min in 20 mM Hepes‐NaOH (pH 7.4), 100 mM NaCl, 1 mM DTT, 10 mM EDTA, and 5 mM MgCl2. The resin was washed with lysis buffer containing 1 mM GTPγS or GDP to terminate the reaction, followed by incubation with HEK293T lysates at 4°C for 2 h. The resin was washed three times with lysis buffer containing 10 μM nucleotide and another three times with lysis buffer containing 250 mM NaCl without CHAPS. Proteins bound to resin were boiled in Laemmli buffer containing β‐mercaptoethanol, and analyzed by SDS–PAGE for CBB staining or immunoblotting detection with anti‐myc.
3D invasion assay
Cultrex 3D Spheroid Cell Invasion Assay kit (Trevigen) was used for 3D invasion assay, according to the manufacturer's instructions. Invasive activity of each spheroid was quantified as the surface area of the invasive structure by using ImageJ.
3D morphological analysis of cells embedded in Matrigel
Neutralized collagen I (Vitrogen) with 0.1 M NaOH, 0.1 M HCl, and PBS was mixed with Matrigel such that the final collagen concentration is 1.6 mg/ml on ice. 50 μl of the mixed gel was spread to each 8‐well chamber slide (ibidi) and incubated at 37°C to be solidified. On the thin layer of mixed gel, MCF10.DCIS.com (2.5 × 10³) cells were plated with 400 μl of the medium containing 2% Matrigel solution and 5 ng/ml EGF, and incubated for 4 days to allow spheroid formation. 20 ng/ml HGF was added to each chamber to promote invasion, and images were acquired at every 2 days. Individual acini were outlined and circularity determined using ImageJ with a value of 1 representing perfect circularity.
Quantitative RT–PCR
Total RNA was extracted from cells with RNeasy kit (QIAGEN). 1.5 μg of total RNA was used for reverse transcription (Superscript Vilo; Thermo Fisher Scientific). GAPDH or 18S ribosomal RNA was used as internal controls. PCR experiments were performed in triplicate, and standard deviations calculated and displayed as error bars. Primer assay IDs were as follows: furin, Hs00965485_g1; GAPDH, Hs99999905_m1; MT1‐MMP, Hs00237119_m1; N‐WASP, Hs00187614_m1; RAB2A, Hs00234094_m1; RAB18, Hs00222021_m1; RAB20, Hs00215134_m1; RAB23, Hs00212407_m1; RAB26, Hs00205016_m1; RAB28, Hs01017480_m1; RAB33A, Hs00191243_m1; RAB36, Hs01016871_m1; TKS5, Hs00206037_m1; VPS39, Hs00385779_m1; and VPS41, Hs00205216_m1 (Thermo Fisher Scientific). All the data are shown as mean ± SD (n > 3).
Image acquisition
RAB GTPase screening was performed on an inverted microscope (Olympus) equipped with a 20× objective lens (LUC Plan FLN 20×/0.45, Olympus). Confocal microscopy was performed on a Leica TCS SP2 confocal microscope controlled by Leica Confocal Software and equipped with violet (405 nm laser diode), blue (argon, 488 nm), yellow (561 nm solid state laser), and red (633 nm HeNe laser) excitation laser lines. A 63× oil‐immersion objective lens (HCX Plan‐Apochromat 63×/1.4 Lbd Bl, Leica) was used for analysis. Image acquisition conditions were set to remove channel cross talk, optimizing spectral detection bands and scanning modalities. ImageJ software was used for data analysis.
Time‐lapse imaging of reporter proteins by RUSH system was performed on an UltraVIEW VoX spinning‐disk confocal system (PerkinElmer) equipped with an Eclipse Ti inverted microscope (Nikon) provided with a Nikon Perfect Focus System, a Hamamatsu EM‐CCD camera (C9100‐50), and an incubation chamber (OKOLab) maintained at 37°C in an atmosphere of 5% CO2, and driven by Volocity software (Perkin Elmer).
Total internal reflection microscopy imaging of cells was performed on a Leica AM TIRF MC system equipped with Andor iXon DU‐885, blue (argon, 488 nm) excitation laser line, an incubation chamber (OKOLab) maintained at 37°C. Cells plated on glass coverslips were viewed through a high‐aperture 63 × objective lens (HCX PL APO 63 × /1.47).
Statistical analysis
For cell biology, differences between experimental groups were examined for statistical significance using the paired Student's t‐test. Data are expressed as mean ± SEM.
Author contributions
HK, YK, EF, SC, AO, GB, MG, GB, AP, and MV performed experiments and analyzed data; GV, and PPDF provided human tumor samples and archival material; PC and FP provided key reagents, cell lines, and protocols and read critically the manuscript. HK and GS conceived the experimental design, analyzed the data, and wrote the paper.
Conflict of interest
The authors declare that they have no conflict of interest.
Supporting information
Appendix
Expanded View Figures PDF
Movie EV1
Movie EV2
Movie EV3
Movie EV4
Movie EV5
Review Process File
Source Data for Figure 2
Source Data for Figure 5
Source Data for Figure 6
Source Data for Figure 7
Source Data for Expanded View and Appendix
Acknowledgements
We thank Valentina Mattei and the molecular pathology unit at the Molecular Medicine Program of the European Institute of Oncology for technical assistance with IHC analysis. Work is supported by grants from the following agencies: the Associazione Italiana per la Ricerca sul Cancro (AIRC) (#10168), MIUR (the Italian Ministry of University and Scientific Research), the Italian Ministry of Health: Worldwide Cancer Research (AICR‐14‐0335), and the European Research Council (Advanced ERC: #268836) (to GS); the Associazione Italiana per la Ricerca sul Cancro (AIRC IG 14404 and MCO 10.000), MIUR (the Italian Ministry of University and Scientific Research), the Italian Ministry of Health, and the Monzino Foundation (to PPDF); Ligue Nationale Contre le Cancer (Equipe Labellisée 2015) and by core funding from Institut Curie and CNRS (to PC); Fondation pour la Recherche Médicale (DEQ20120323723) and the Agence Nationale pour la Recherche (ANR‐12‐BSV2‐0003‐01) (to FP). HK was supported by a Marie Curie/AIRC TRAIN fellowship. YK was supported by Grant‐in‐Aid for Japan Society for the Promotion of Science (JSPS) Fellows.
EMBO Reports (2016) 17: 1061–1080
[Correction added on 1 July 2016 after first online publication: author affiliations have been corrected.]
References
- 1. Friedl P, Wolf K (2010) Plasticity of cell migration: a multiscale tuning model. J Cell Biol 188: 11–19 [DOI] [PMC free article] [PubMed] [Google Scholar]
- 2. Friedl P, Locker J, Sahai E, Segall JE (2012) Classifying collective cancer cell invasion. Nat Cell Biol 14: 777–783 [DOI] [PubMed] [Google Scholar]
- 3. Kessenbrock K, Plaks V, Werb Z (2010) Matrix metalloproteinases: regulators of the tumor microenvironment. Cell 141: 52–67 [DOI] [PMC free article] [PubMed] [Google Scholar]
- 4. Hotary K, Li XY, Allen E, Stevens SL, Weiss SJ (2006) A cancer cell metalloprotease triad regulates the basement membrane transmigration program. Genes Dev 20: 2673–2686 [DOI] [PMC free article] [PubMed] [Google Scholar]
- 5. Hotary KB, Allen ED, Brooks PC, Datta NS, Long MW, Weiss SJ (2003) Membrane type I matrix metalloproteinase usurps tumor growth control imposed by the three‐dimensional extracellular matrix. Cell 114: 33–45 [DOI] [PubMed] [Google Scholar]
- 6. Ferguson SM, Brasnjo G, Hayashi M, Wolfel M, Collesi C, Giovedi S, Raimondi A, Gong LW, Ariel P, Paradise S et al (2007) A selective activity‐dependent requirement for dynamin 1 in synaptic vesicle endocytosis. Science 316: 570–574 [DOI] [PubMed] [Google Scholar]
- 7. Rozanov DV, Savinov AY, Williams R, Liu K, Golubkov VS, Krajewski S, Strongin AY (2008) Molecular signature of MT1‐MMP: transactivation of the downstream universal gene network in cancer. Cancer Res 68: 4086–4096 [DOI] [PMC free article] [PubMed] [Google Scholar]
- 8. Sounni NE, Rozanov DV, Remacle AG, Golubkov VS, Noel A, Strongin AY (2010) Timp‐2 binding with cellular MT1‐MMP stimulates invasion‐promoting MEK/ERK signaling in cancer cells. Int J Cancer 126: 1067–1078 [DOI] [PMC free article] [PubMed] [Google Scholar]
- 9. Perentes JY, Kirkpatrick ND, Nagano S, Smith EY, Shaver CM, Sgroi D, Garkavtsev I, Munn LL, Jain RK, Boucher Y (2011) Cancer cell‐associated MT1‐MMP promotes blood vessel invasion and distant metastasis in triple‐negative mammary tumors. Cancer Res 71: 4527–4538 [DOI] [PubMed] [Google Scholar]
- 10. Lodillinsky C, Infante E, Guichard A, Chaligne R, Fuhrmann L, Cyrta J, Irondelle M, Lagoutte E, Vacher S, Bonsang‐Kitzis H et al (2015) p63/MT1‐MMP axis is required for in situ to invasive transition in basal‐like breast cancer. Oncogene 35: 344–357 [DOI] [PubMed] [Google Scholar]
- 11. Zhai Y, Hotary KB, Nan B, Bosch FX, Munoz N, Weiss SJ, Cho KR (2005) Expression of membrane type 1 matrix metalloproteinase is associated with cervical carcinoma progression and invasion. Cancer Res 65: 6543–6550 [DOI] [PubMed] [Google Scholar]
- 12. Frittoli E, Palamidessi A, Disanza A, Scita G (2011) Secretory and endo/exocytic trafficking in invadopodia formation: the MT1‐MMP paradigm. Eur J Cell Biol 90: 108–114 [DOI] [PubMed] [Google Scholar]
- 13. Poincloux R, Lizarraga F, Chavrier P (2009) Matrix invasion by tumour cells: a focus on MT1‐MMP trafficking to invadopodia. J Cell Sci 122: 3015–3024 [DOI] [PubMed] [Google Scholar]
- 14. Lizarraga F, Poincloux R, Romao M, Montagnac G, Le Dez G, Bonne I, Rigaill G, Raposo G, Chavrier P (2009) Diaphanous‐related formins are required for invadopodia formation and invasion of breast tumor cells. Cancer Res 69: 2792–2800 [DOI] [PubMed] [Google Scholar]
- 15. Hoshino D, Koshikawa N, Suzuki T, Quaranta V, Weaver AM, Seiki M, Ichikawa K (2012) Establishment and Validation of Computational Model for MT1‐MMP Dependent ECM Degradation and Intervention Strategies. PLoS Comput Biol 8: e1002479 [DOI] [PMC free article] [PubMed] [Google Scholar]
- 16. Zhu L, Yu H, Liu SY, Xiao XS, Dong WH, Chen YN, Xu W, Zhu T (2015) Prognostic value of tissue inhibitor of metalloproteinase‐2 expression in patients with non‐small cell lung cancer: a systematic review and meta‐analysis. PLoS One 10: e0124230 [DOI] [PMC free article] [PubMed] [Google Scholar]
- 17. Scita G, Di Fiore PP (2010) The endocytic matrix. Nature 463: 464–473 [DOI] [PubMed] [Google Scholar]
- 18. Sigismund S, Confalonieri S, Ciliberto A, Polo S, Scita G, Di Fiore PP (2012) Endocytosis and signaling: cell logistics shape the eukaryotic cell plan. Physiol Rev 92: 273–366 [DOI] [PMC free article] [PubMed] [Google Scholar]
- 19. Frittoli E, Palamidessi A, Marighetti P, Confalonieri S, Bianchi F, Malinverno C, Mazzarol G, Viale G, Martin‐Padura I, Garre M et al (2014) A RAB5/RAB4 recycling circuitry induces a proteolytic invasive program and promotes tumor dissemination. J Cell Biol 206: 307–328 [DOI] [PMC free article] [PubMed] [Google Scholar]
- 20. Monteiro P, Rosse C, Castro‐Castro A, Irondelle M, Lagoutte E, Paul‐Gilloteaux P, Desnos C, Formstecher E, Darchen F, Perrais D et al (2013) Endosomal WASH and exocyst complexes control exocytosis of MT1‐MMP at invadopodia. J Cell Biol 203: 1063–1079 [DOI] [PMC free article] [PubMed] [Google Scholar]
- 21. Steffen A, Le Dez G, Poincloux R, Recchi C, Nassoy P, Rottner K, Galli T, Chavrier P (2008) MT1‐MMP‐dependent invasion is regulated by TI‐VAMP/VAMP7. Curr Biol 18: 926–931 [DOI] [PubMed] [Google Scholar]
- 22. Williams KC, Coppolino MG (2011) Phosphorylation of membrane type 1‐matrix metalloproteinase (MT1‐MMP) and its vesicle‐associated membrane protein 7 (VAMP7)‐dependent trafficking facilitate cell invasion and migration. J Biol Chem 286: 43405–43416 [DOI] [PMC free article] [PubMed] [Google Scholar]
- 23. Bravo‐Cordero JJ, Marrero‐Diaz R, Megias D, Genis L, Garcia‐Grande A, Garcia MA, Arroyo AG, Montoya MC (2007) MT1‐MMP proinvasive activity is regulated by a novel Rab8‐dependent exocytic pathway. EMBO J 26: 1499–1510 [DOI] [PMC free article] [PubMed] [Google Scholar]
- 24. Hoshino D, Kirkbride KC, Costello K, Clark ES, Sinha S, Grega‐Larson N, Tyska MJ, Weaver AM (2013) Exosome secretion is enhanced by invadopodia and drives invasive behavior. Cell Rep 5: 1159–1168 [DOI] [PMC free article] [PubMed] [Google Scholar]
- 25. Corallino S, Malabarba MG, Zobel M, Di Fiore PP, Scita G (2015) Epithelial‐to‐Mesenchymal Plasticity Harnesses Endocytic Circuitries. Front Oncol 5: 45 [DOI] [PMC free article] [PubMed] [Google Scholar]
- 26. Thiery JP, Lim CT (2013) Tumor dissemination: an EMT affair. Cancer Cell 23: 272–273 [DOI] [PubMed] [Google Scholar]
- 27. Brabletz T (2012) To differentiate or not–routes towards metastasis. Nat Rev Cancer 12: 425–436 [DOI] [PubMed] [Google Scholar]
- 28. Chaffer CL, Weinberg RA (2011) A perspective on cancer cell metastasis. Science 331: 1559–1564 [DOI] [PubMed] [Google Scholar]
- 29. Reynolds AB, Roczniak‐Ferguson A (2004) Emerging roles for p120‐catenin in cell adhesion and cancer. Oncogene 23: 7947–7956 [DOI] [PubMed] [Google Scholar]
- 30. Bryant DM, Stow JL (2004) The ins and outs of E‐cadherin trafficking. Trends Cell Biol 14: 427–434 [DOI] [PubMed] [Google Scholar]
- 31. Rolland Y, Marighetti P, Malinverno C, Confalonieri S, Luise C, Ducano N, Palamidessi A, Bisi S, Kajiho H, Troglio F et al (2014) The CDC42‐Interacting Protein 4 Controls Epithelial Cell Cohesion and Tumor Dissemination. Dev Cell 30: 553–568 [DOI] [PubMed] [Google Scholar]
- 32. Shaye DD, Casanova J, Llimargas M (2008) Modulation of intracellular trafficking regulates cell intercalation in the Drosophila trachea. Nat Cell Biol 10: 964–970 [DOI] [PubMed] [Google Scholar]
- 33. Stenmark H (2009) Rab GTPases as coordinators of vesicle traffic. Nat Rev Mol Cell Biol 10: 513–525 [DOI] [PubMed] [Google Scholar]
- 34. Aizawa M, Fukuda M (2015) Small GTPase Rab2B and Its Specific Binding Protein Golgi‐associated Rab2B Interactor‐like 4 (GARI‐L4) Regulate Golgi Morphology. J Biol Chem 290: 22250–22261 [DOI] [PMC free article] [PubMed] [Google Scholar]
- 35. Ni X, Ma Y, Cheng H, Jiang M, Guo L, Ji C, Gu S, Cao Y, Xie Y, Mao Y (2002) Molecular cloning and characterization of a novel human Rab (Rab2B) gene. J Hum Genet 47: 548–551 [DOI] [PubMed] [Google Scholar]
- 36. Short B, Preisinger C, Korner R, Kopajtich R, Byron O, Barr FA (2001) A GRASP55‐rab2 effector complex linking Golgi structure to membrane traffic. J Cell Biol 155: 877–883 [DOI] [PMC free article] [PubMed] [Google Scholar]
- 37. Sugawara T, Kano F, Murata M (2014) Rab2A is a pivotal switch protein that promotes either secretion or ER‐associated degradation of (pro)insulin in insulin‐secreting cells. Sci Rep 4: 6952 [DOI] [PMC free article] [PubMed] [Google Scholar]
- 38. Tisdale EJ, Balch WE (1996) Rab2 is essential for the maturation of pre‐Golgi intermediates. J Biol Chem 271: 29372–29379 [DOI] [PubMed] [Google Scholar]
- 39. Galardy RE, Cassabonne ME, Giese C, Gilbert JH, Lapierre F, Lopez H, Schaefer ME, Stack R, Sullivan M, Summers B et al (1994) Low molecular weight inhibitors in corneal ulceration. Ann N Y Acad Sci 732: 315–323 [DOI] [PubMed] [Google Scholar]
- 40. Ayala I, Baldassarre M, Giacchetti G, Caldieri G, Tete S, Luini A, Buccione R (2008) Multiple regulatory inputs converge on cortactin to control invadopodia biogenesis and extracellular matrix degradation. J Cell Sci 121: 369–378 [DOI] [PubMed] [Google Scholar]
- 41. Courtneidge SA, Azucena EF, Pass I, Seals DF, Tesfay L (2005) The SRC substrate Tks5, podosomes (invadopodia), and cancer cell invasion. Cold Spring Harb Symp Quant Biol 70: 167–171 [DOI] [PubMed] [Google Scholar]
- 42. Nakahara H, Howard L, Thompson EW, Sato H, Seiki M, Yeh Y, Chen WT (1997) Transmembrane/cytoplasmic domain‐mediated membrane type 1‐matrix metalloprotease docking to invadopodia is required for cell invasion. Proc Natl Acad Sci USA 94: 7959–7964 [DOI] [PMC free article] [PubMed] [Google Scholar]
- 43. Yamaguchi H, Lorenz M, Kempiak S, Sarmiento C, Coniglio S, Symons M, Segall J, Eddy R, Miki H, Takenawa T et al (2005) Molecular mechanisms of invadopodium formation: the role of the N‐WASP‐Arp2/3 complex pathway and cofilin. J Cell Biol 168: 441–452 [DOI] [PMC free article] [PubMed] [Google Scholar]
- 44. Miller FR, Santner SJ, Tait L, Dawson PJ (2000) MCF10DCIS.com xenograft model of human comedo ductal carcinoma in situ. J Natl Cancer Inst 92: 1185–1186 [DOI] [PubMed] [Google Scholar]
- 45. Hendrix A, Maynard D, Pauwels P, Braems G, Denys H, Van den Broecke R, Lambert J, Van Belle S, Cocquyt V, Gespach C et al (2010) Effect of the secretory small GTPase Rab27B on breast cancer growth, invasion, and metastasis. J Natl Cancer Inst 102: 866–880 [DOI] [PMC free article] [PubMed] [Google Scholar]
- 46. Hennigan RF, Hawker KL, Ozanne BW (1994) Fos‐transformation activates genes associated with invasion. Oncogene 9: 3591–3600 [PubMed] [Google Scholar]
- 47. Edwards SL, Charlie NK, Richmond JE, Hegermann J, Eimer S, Miller KG (2009) Impaired dense core vesicle maturation in Caenorhabditis elegans mutants lacking Rab2. J Cell Biol 186: 881–895 [DOI] [PMC free article] [PubMed] [Google Scholar]
- 48. Destaing O, Block MR, Planus E, Albiges‐Rizo C (2011) Invadosome regulation by adhesion signaling. Curr Opin Cell Biol 23: 597–606 [DOI] [PubMed] [Google Scholar]
- 49. Appenzeller‐Herzog C, Hauri HP (2006) The ER‐Golgi intermediate compartment (ERGIC): in search of its identity and function. J Cell Sci 119: 2173–2183 [DOI] [PubMed] [Google Scholar]
- 50. de Bolle X, Letesson JJ, Gorvel JP (2012) Small GTPases and Brucella entry into the endoplasmic reticulum. Biochem Soc Trans 40: 1348–1352 [DOI] [PubMed] [Google Scholar]
- 51. Fugier E, Salcedo SP, de Chastellier C, Pophillat M, Muller A, Arce‐Gorvel V, Fourquet P, Gorvel JP (2009) The glyceraldehyde‐3‐phosphate dehydrogenase and the small GTPase Rab 2 are crucial for Brucella replication. PLoS Pathog 5: e1000487 [DOI] [PMC free article] [PubMed] [Google Scholar]
- 52. Yu X, Zech T, McDonald L, Gonzalez EG, Li A, Macpherson I, Schwarz JP, Spence H, Futo K, Timpson P et al (2012) N‐WASP coordinates the delivery and F‐actin‐mediated capture of MT1‐MMP at invasive pseudopods. J Cell Biol 199: 527–544 [DOI] [PMC free article] [PubMed] [Google Scholar]
- 53. Chun DK, McEwen JM, Burbea M, Kaplan JM (2008) UNC‐108/Rab2 regulates postendocytic trafficking in Caenorhabditis elegans. Mol Biol Cell 19: 2682–2695 [DOI] [PMC free article] [PubMed] [Google Scholar]
- 54. Gillingham AK, Sinka R, Torres IL, Lilley KS, Munro S (2014) Toward a comprehensive map of the effectors of rab GTPases. Dev Cell 31: 358–373 [DOI] [PMC free article] [PubMed] [Google Scholar]
- 55. Lee GY, Kenny PA, Lee EH, Bissell MJ (2007) Three‐dimensional culture models of normal and malignant breast epithelial cells. Nat Methods 4: 359–365 [DOI] [PMC free article] [PubMed] [Google Scholar]
- 56. Li Q, Mattingly RR (2008) Restoration of E‐cadherin cell‐cell junctions requires both expression of E‐cadherin and suppression of ERK MAP kinase activation in Ras‐transformed breast epithelial cells. Neoplasia 10: 1444–1458 [DOI] [PMC free article] [PubMed] [Google Scholar]
- 57. Dawson PJ, Wolman SR, Tait L, Heppner GH, Miller FR (1996) MCF10AT: a model for the evolution of cancer from proliferative breast disease. Am J Pathol 148: 313–319 [PMC free article] [PubMed] [Google Scholar]
- 58. Santner SJ, Dawson PJ, Tait L, Soule HD, Eliason J, Mohamed AN, Wolman SR, Heppner GH, Miller FR (2001) Malignant MCF10CA1 cell lines derived from premalignant human breast epithelial MCF10AT cells. Breast Cancer Res Treat 65: 101–110 [DOI] [PubMed] [Google Scholar]
- 59. Posthaus H, Dubois CM, Laprise MH, Grondin F, Suter MM, Muller E (1998) Proprotein cleavage of E‐cadherin by furin in baculovirus over‐expression system: potential role of other convertases in mammalian cells. FEBS Lett 438: 306–310 [DOI] [PubMed] [Google Scholar]
- 60. Ozawa M, Kemler R (1990) Correct proteolytic cleavage is required for the cell adhesive function of uvomorulin. J Cell Biol 111: 1645–1650 [DOI] [PMC free article] [PubMed] [Google Scholar]
- 61. Laur OY, Klingelhofer J, Troyanovsky RB, Troyanovsky SM (2002) Both the dimerization and immunochemical properties of E‐cadherin EC1 domain depend on Trp(156) residue. Arch Biochem Biophys 400: 141–147 [DOI] [PubMed] [Google Scholar]
- 62. Boncompain G, Divoux S, Gareil N, de Forges H, Lescure A, Latreche L, Mercanti V, Jollivet F, Raposo G, Perez F (2012) Synchronization of secretory protein traffic in populations of cells. Nat Methods 9: 493–498 [DOI] [PubMed] [Google Scholar]
- 63. Luo ML, Gong C, Chen CH, Hu H, Huang P, Zheng M, Yao Y, Wei S, Wulf G, Lieberman J et al (2015) The Rab2A GTPase promotes breast cancer stem cells and tumorigenesis via Erk signaling activation. Cell Rep 11: 111–124 [DOI] [PMC free article] [PubMed] [Google Scholar]
- 64. Peplowska K, Markgraf DF, Ostrowicz CW, Bange G, Ungermann C (2007) The CORVET tethering complex interacts with the yeast Rab5 homolog Vps21 and is involved in endo‐lysosomal biogenesis. Dev Cell 12: 739–750 [DOI] [PubMed] [Google Scholar]
- 65. Lafleur MA, Handsley MM, Edwards DR (2003) Metalloproteinases and their inhibitors in angiogenesis. Expert Rev Mol Med 5: 1–39 [DOI] [PubMed] [Google Scholar]
- 66. Watanabe A, Hoshino D, Koshikawa N, Seiki M, Suzuki T, Ichikawa K (2013) Critical role of transient activity of MT1‐MMP for ECM degradation in invadopodia. PLoS Comput Biol 9: e1003086 [DOI] [PMC free article] [PubMed] [Google Scholar]
- 67. Marchesin V, Castro‐Castro A, Lodillinsky C, Castagnino A, Cyrta J, Bonsang‐Kitzis H, Fuhrmann L, Irondelle M, Infante E, Montagnac G et al (2015) ARF6‐JIP3/4 regulate endosomal tubules for MT1‐MMP exocytosis in cancer invasion. J Cell Biol 211: 339–358 [DOI] [PMC free article] [PubMed] [Google Scholar]
- 68. Dozynkiewicz MA, Jamieson NB, Macpherson I, Grindlay J, van den Berghe PV, von Thun A, Morton JP, Gourley C, Timpson P, Nixon C et al (2012) Rab25 and CLIC3 Collaborate to Promote Integrin Recycling from Late Endosomes/Lysosomes and Drive Cancer Progression. Dev Cell 22: 131–145 [DOI] [PMC free article] [PubMed] [Google Scholar]
- 69. Kajiho H, Saito K, Tsujita K, Kontani K, Araki Y, Kurosu H, Katada T (2003) RIN3: a novel Rab5 GEF interacting with amphiphysin II involved in the early endocytic pathway. J Cell Sci 116: 4159–4168 [DOI] [PubMed] [Google Scholar]
- 70. Hudis CA, Barlow WE, Costantino JP, Gray RJ, Pritchard KI, Chapman JA, Sparano JA, Hunsberger S, Enos RA, Gelber RD et al (2007) Proposal for standardized definitions for efficacy end points in adjuvant breast cancer trials: the STEEP system. J Clin Oncol 25: 2127–2132 [DOI] [PubMed] [Google Scholar]
Associated Data
This section collects any data citations, data availability statements, or supplementary materials included in this article.
Supplementary Materials
Appendix
Expanded View Figures PDF
Movie EV1
Movie EV2
Movie EV3
Movie EV4
Movie EV5
Review Process File
Source Data for Figure 2
Source Data for Figure 5
Source Data for Figure 6
Source Data for Figure 7
Source Data for Expanded View and Appendix