Abstract
Primary tumors of spine are rare accounting for less than 5% of new bone tumors diagnosed every year. These tumors may exhibit characteristic imaging features that can help in early diagnosis and improved prognosis. Plasmacytoma/multiple myeloma and lymphoproliferative tumors are the most common malignant primary spinal tumors. Hemangioma is the most common benign tumor of the spine. Computed tomography is useful to assess tumor matrix and osseous change. Magnetic resonance is useful to study associated soft tissue extension, marrow infiltration, and intraspinal extension. Confusing one tumor with the other based on only imaging findings is not uncommon. However, radiologic manifestations of these tumors need to be correlated with the age, sex, location, and presentation to arrive at a close clinical diagnosis.
Keywords: Hemangioma, lymphoproliferative disorders, multiple myeloma, osteoblastoma, plasmacytoma, spinal tumors
Introduction
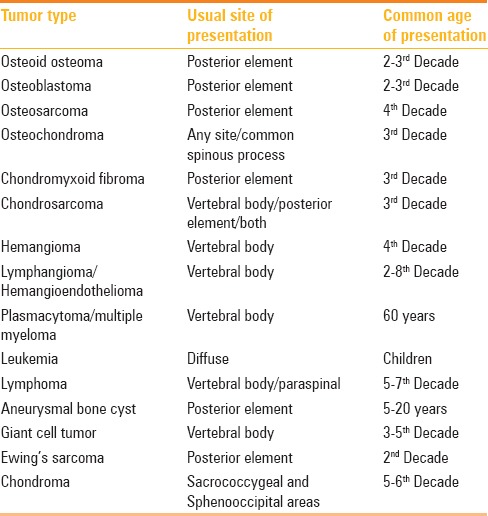
Primary tumors of the spine are rare with a reported incidence of 2.5 to 8.5 per 100,000 people per year.[1] They account for less than 5% of new bone tumors diagnosed every year in the United States.[2] These tumors exhibit characteristic imaging features that can help in early diagnosis and improved prognosis. It is important to realize that imaging features have to be correlated with the age, sex, and the site of presentation to reach a diagnosis or differential diagnosis [Table 1]. The imaging features and clues to diagnosis of all important tumors have been reviewed in this article.
Table 1.
Various primary spinal tumors, the sites of common occurrence, and time-window of presentation
Imaging Workup
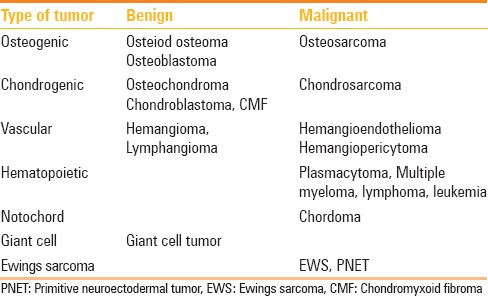
Conventional radiography has a limited role because of the complex anatomy of spine, and usually it is used as a complementary study to computed tomography (CT) and magnetic resonance imaging (MRI). CT scan is best suited to evaluate the extent of lesion, delineate cortical outline, and to know matrix calcification/ossification. It is unique for performing guided biopsy. However, MRI is the method of choice. The extent of lesion both osseous, extra-osseous, marrow infiltration, epidural, nerve, and cord involvement can be better depicted in MRI. Contrast-enhanced Scan is useful to know the treatment response and diffusion weighted images (DWI) can depict the tumor necrosis both before and after treatment. Radionuclide scans are useful to detect multiple lesions and lesions as small as 2 mm, and are helpful for a precise diagnosis and staging. Approximately 5–15% bone turnover can be detected by radionuclide scan.[3] Positron emission tomography (PET)-CT is useful for surveillance. Angiography is reserved for highly vascular tumors, especially where preoperative embolization is essential. Preoperative biopsy is reserved for cases where diagnosis is doubtful and surgery is not contemplated. As most malignant tumors undergo surgery and excision biopsy is done. If preoperative biopsy is done, the track is to be planned such that the mass along with tracks has to be removed en bloc to reduce the tumor spillage. Cervical spinal tumors require CT/MR angiography to depict their relationship to supraaortic trunks. In thoracic tumors, it is essential to know the exact relationship of tumors with pleura, mediastinal structures and ribs, whereas in lumbar spinal tumors, the relationship with retroperitoneum is important. In sacral tumors, lesion extension to SI joint and pelvis has to be defined. The World Health Organisation has classified the primary tumors of spine as osteogenic, chondrogenic, vascular, hematopoietic, notochordal, giant cell type, and miscellaneous [Table 2].[4]
Table 2.
Classification of bone tumors involving bony spine
Benign Tumors
Osteoid osteomas
These accounts for 1% of all spinal tumors and 10% of osteoid osteomas of bones.[5] They commonly occur in the 2nd decade with male predominance. Posterior element is more often involved than anterior elements. Pedicle, lamina, facet joint are affected in 75% and spinous and transverse processes in 18% cases. Lumbar spine is the most common site (59%), followed by cervical spine (27%), dorsal spine (12%), and sacrum (2%). Radiograph shows the central lucent area with varying degree of mineralization and surrounding sclerosis. Central lucency represents the nidus and is less than 1.5 cm. Sometimes nidus may be obscured by sclerosis. CT is the modality of choice for accurate localization and to appreciate the mineralization of nidus [Figure 1]. On MRI, nidus is hypo on T1W image and variable signal on T2W images. On contrast administration, there is enhancement. MR shows nonspecific changes such as edema in bone marrow and adjacent soft tissue mimicking infective etiology. However, spared intervertebral disk confirms the diagnosis of osteoid osteoma rather than infective spondylitis. Bone scintigraphy is advocated to localize the level of vertebral involvement in strongly clinically suspected osteoid osteoma prior to CT and to decide the number of niduses preoperatively. It shows double density sign. Close differential is osteomyelitis where the sequestrum is irregular; whereas the nidus in osteoid osteomas is rounded and smooth.
Figure 1 (A and B).
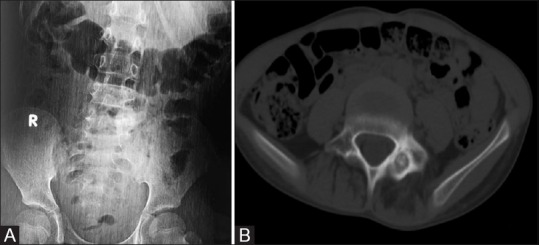
14M presented with night pain, a case of osteiod osteoma. (A) Plain radiographs AP of LS spine reveals sclerosis along the left pedicle of L5 vertebra. (B) Axial noncontrast CT through L5 vertebral body reveals round lucent nidus surrounded by sclerosis in the left posterior element
Osteoblastomas
Spinal osteoblastomas account for 30–40% of all osteoblastomas. They most commonly occur in 2nd to 3rd decade (slightly later age than osteoid osteomas). Males are more commonly affected than female with a ratio of 2:1.[6] Osteoblastoma originates in the neural arch and often extends to vertebral body. Thoracic, cervical, and lumbar segments are equally affected. Only vertebral body involvement is seen in 3% of cases. Radiograph demonstrates expansile lytic lesion of more than 1.5 cm with matrix mineralization. Variable amount of sclerosis is noted surrounding the lesion. CT shows expansion of bone and lytic lesion with little evidence of nidus calcification [Figure 2]. Sometimes, multiple foci of matrix mineralization or extensive sclerosis may be observed. Cortical expansion is sometimes demarcated by thin shell of bone [Figure 3]. On T1W, lesion is hypointense and mixed signal on T2W due to variable matrix mineralization. All tumors enhance on intravenous Gadolinium administration. Rarely, tumor may be aggressive with bone destruction, breaking the cortex, wide zone of transition, characteristic perilesional edema in bone and soft tissue extending beyond the lesion resulting in flare phenomenon. Bone edema also enhances on contrast injection resulting in overestimation of size of lesion and leading to sampling error. Osteoid osteoma, osteosarcoma, either chondroblastic or talengiectatic, varieties are close differential diagnoses.
Figure 2.
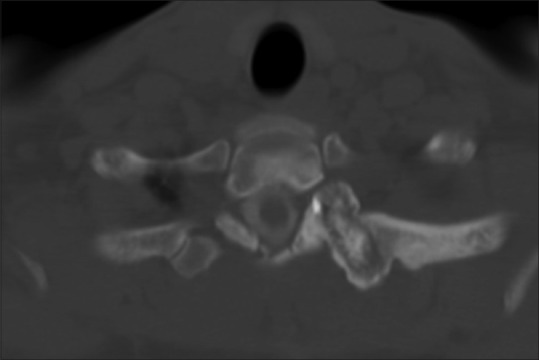
A case of osteoblastoma in a 23-year-old male; axial CT myelogram through the upper dorsal spine in bone window. A well-defined lytic lesion more than 1.5 cm in the left transverse process having central calcification and surrounding sclerosis
Figure 3 (A-C).
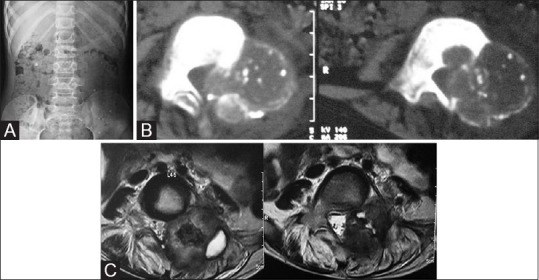
A case of osteoblastoma in an 8-year-old male. (A) AP Radiograph of lumbar spine—expansile lytic lesion in left pedicle of L4 vertebra. (B) Noncontrast axial CT scan through L4 in the soft tissue window demonstrates the blown out pedicle with thin imperceptible cortex and varying degree of calcification. (C) T2-weighted (T2W) axial images through L4 in the same patient on MRI—the lesion appears mixed signal on T2W images with central hypointensity with spinal canal compromise
Osteochondromas
Spinal Osteochondromas account for 1–4% of solitary and 9% of all multiple Osteochondromas. Solitary lesions are more common in males than females and are common in the 2nd decade. Single lesion is more common in the cervical spine whereas multiple lesions in the thoracolumbar region. The tip of spinous process and transverse process are more preferred sites than body and pedicles. Radiation induced osteochondromas occur within or at the periphery of radiation field. Osteochondromas are developmental lesions rather than tumors. This lesion is caused by the separation of a fragment of growth plate cartilage, which grows, and as a result of this, progressive enchondral ossification leading to subperiosteal osseous excrescence with a cartilage cap that projects from bone surface develops.[7] Osteochondromas enlarge as a result of growth at the cartilage cap, similar to growth plate. Enchondral ossification leads to medullary bone with fatty/hematopoietic marrow. Malignant change may occur in 1% of solitary and 5–15% of multiple hereditary exostosis [Figure 4].[6]
Figure 4 (A-D).
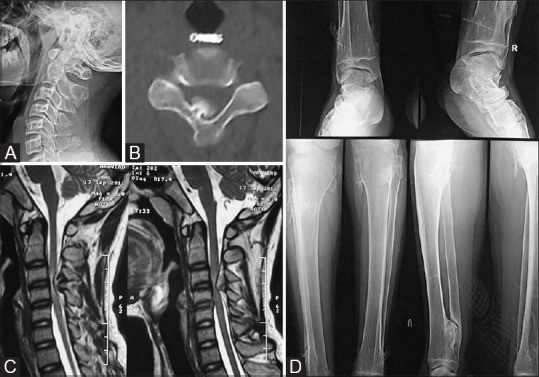
15M presented with occasional paraesthesia of bilateral upper limbs. (A) Lateral radiograph of cervical spine appears normal. (B) NECT axial CT images in the bone window clearly delineates small bony outgrowth from posterior element with cortex; medulla continuous with the adjacent bone. (C) T2 sagittal scan of cervical spine; the thecal sac and cord compression is well appreciated. (D) AP radiograph of ankles and AP and lateral radiograph of both legs reveals multiple exostoses in the upper and lower end of the bilateral tibia (a case of hereditary exostosis)
Radiographically, lesions protrude from the spinous process with cortical and medullary continuity between the lesion and parent bone. Because of complex anatomy, conventional radiography is less useful. CT and MRI are the best diagnostic tools. Density and signal characteristics of these lesions are best demonstrated. At MR, the central fatty marrow appear hyper in T1W and T2W images with peripheral hypointense rim representing the cortex. The T2W hyperintensity beyond cortex represents the cartilaginous cap [Figure 5]. MRI has an added advantage of delineating the lesions and its relation to spinal canal and its content as shown in Figure 5. Cartilaginous cap thicker than 1 cm in an adult suggests sarcomatous degeneration.
Figure 5 (A-C).

(A) AP radiograph of LS spine; 14M osteochondroma arising from L4 spinous process. Plain radiographs reveal faint opacity close to L4 spinous process. (B) Axial NECT through L4 vertebra in the bone windows clearly demonstrates the bony outgrowth from the L4 spinous process. (C) Axial T2 image through L4: Fatty marrow and cortex are well demonstrated on MRI T2W; thin T2 hyperintensity surrounding the hypointense cortex represents the cartilaginous cap
Chondroblastoma and chondromyxoid fibroma
Spinal chondroblastomas are very rare, accounting for 1–4% of all chondroblastomas. Most patients present during the 3rd decade with male predominance. They preferentially involve vertebral body and posterior elements. Radiographically the tumor presents as expansile lytic (geographic) lesion with sclerotic border. CT demonstrates matrix calcification. T2 hypointensity within matrix represents immature chondroid, hypercellularity, hemosiderin and calcification on histologic analysis.
Approximately 5% chondromyxoid fibromas occur in the spine. Occurrence is common in cervical region but can be seen dorsal, lumbar spine with predilection for spinous process. They present as lobulated mass having mixed chondroid, fibrous, myxoid areas. Extensive erosion, cortical break, and soft tissue component suggest malignancy.
Hemangiomas
Hemangiomas are the most common benign vertebral tumors and are considered to be hamartomatous lesions. These may be solitary or multiple, and are commonly seen in the thoracic, lumbar spine. Prevalence is greater after middle age with a female predominance. Hemangioma consists of thin walled vessels and sinuses lined by endothelium interspersed among longitudinal trabeculae of bone. Accumulation of lipid material is a secondary phenomenon. These lesions are generally asymptomatic and symptoms may occur when there is expansion, epidural extension, pathological fracture, or hematoma formation. Hemangioma is usually confined to vertebral body and presents with rarefaction of bone, vertical striation, or coarse honeycomb appearance. CT shows polka dot and corduroy appearance [Figure 6]. MR demonstrates T1 and T2 hyperintensity interspersed with thick low signal intensity vertical bony struts [Figure 6]. Lesion shows avid enhancement. Aggressive hemangiomas show the involvement of the entire vertebral body with extension to neural arch, cortical expansion, irregular honeycombing, and soft-tissue mass and avid enhancement [Figure 7]. Bone scan may show no uptake/increased uptake/decreased uptake. Angiography reveals the vascularity and arterial embolization may be helpful preoperatively [Figure 7].
Figure 6 (A and B).
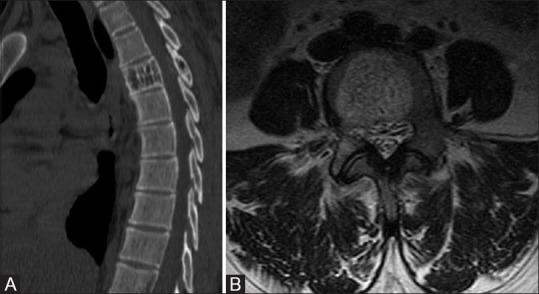
(A) Vertebral hemangioma in a 32-year-old female; sagittal reconstructed images of the dorsal spine in bone window reveals characteristic corduroy appearance of hemangioma. (B) Axial T2 through lumbar spine; T2 image depicts the hypointense bony struts within hyperintense lesion
Figure 7 (A-D).
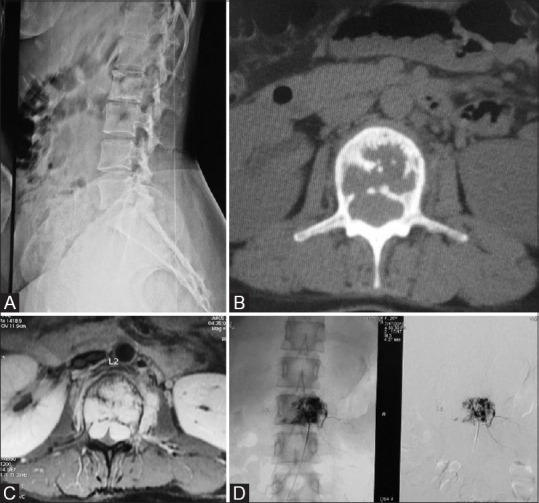
(A) Case of aggressive Hemangioma in a 27-year-old female presented with low back ache. X-ray of LS spine in the lateral view shows lytic lesion of L2 vertebral body. (B) Axial CT Scan through L2 in bone window; the lesion appears lytic with internal bony struts. (C) Contrast enhanced axial T1-weighted MRI clearly delineates the lesion which is bulging posteriorly indenting on the theca and small enhancing Left paravertebral soft tissue. (D) Digital subtraction angiogram images; pre and postembolization of hemangioma showing reduction in size
Lymphangioma
Extremely rare and presents with coarse trabeculation of vertebra with preservation of the shape of vertebra. MRI shows inhomogenously hyperintense on T2WI and heterogenous enhancement on contrast administration.
Giant-cell tumor
Approximately 7% of giant-cell tumors (GCTs) occurs in the spine.[2] They are more common in mature skeleton, that is, in the 3rd to 5th decade of life with female predominance. Primary site is vertebral body. Sacrum is more commonly involved than dorsal, cervical, or lumbar spine. Upper sacrum is the most preferred site. During pregnancy, the size may increase. Sometimes GCT may be associated with aneurysmal bone cyst, osteoid osteoma or osteoblastoma. Spinal GCTs are unique because they are more aggressive with high recurrence rate, unpredictable outcome, and can cause cord compression.
Radiographically, the lesions are well defined lytic without matrix calcification and sclerotic rim. Sacral lesions are at midline extending to either side and can cross the SI joint [Figure 8]. In thoracic spine, the GCT may simulate posterior mediastinal mass. Intervertebral disk and adjacent vertebral involvement may be seen. Extra-osseous involvement of soft tissue is seen in 79% of cases.[8] Lesions are hypointense on T1W images. Areas of T1 hyperintensity may be seen which representing haemorrhages. Low to intermediate signal intensity on T2W images due to hemosiderin, high collagen content on MRI [Figure 9]. Cystic areas, foci of hemorrhage, and fluid-fluid levels may be observed [Figure 8]. Enhancement on contrast scan reflects the vascularity. At times there may be collapse of vertebra [Figure 10].
Figure 8 (A and B).
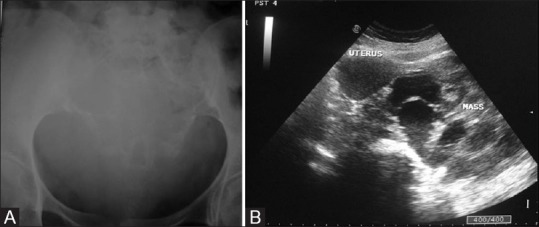
(A) A case of giant cell tumor in a 42-year-old female; AP radiograph of pelvis depicts expansile lytic lesion without sclerotic border in the sacrum. (B) Multiple fluid–fluid levels and curvilinear septa are noted in the sagittal section on ultrasonogram
Figure 9.
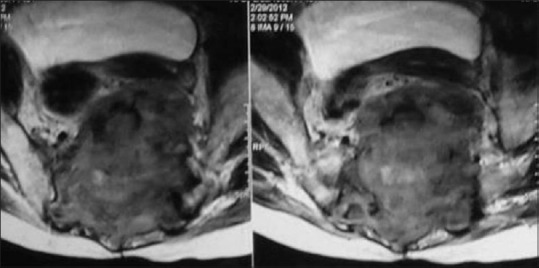
Axial T2-weighted MRI in a case of giant cell tumor in a 49-year-old male depicts the lesion crossing midline with involvement of SI joints. Note the areas of T2 hypointensity within the matrix representing dense collagen and hemosiderin
Figure 10 (A and B).
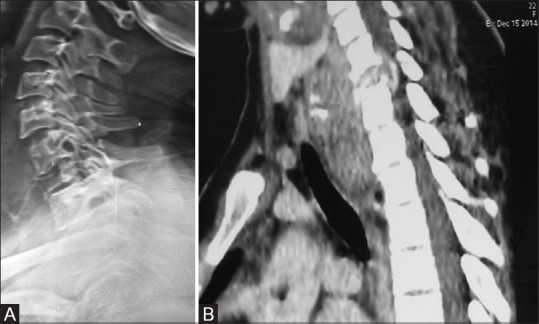
A 22-year-old female with giant cell tumor presenting as collapse of vertebra; (A) Lateral radiograph shows the collapse of C7 vertebral body. (B) Sagittal reconstructed image of cervical spine shows the collapse of C7 vertebral body having large prevertebral epidural soft tissue component compressing the thecal sac
Malignant Tumors of the Spine
Osteosarcoma
Spinal osteosarcomas account for 4% of all osteosarcomas and 4–14% of all primary malignant tumors of spine.[6] Peak incidence is slightly at a later age as compared to conventional appendicular osteosarcoma and equal incidence in male and female. Thoracic and lumbar vertebrae are commonly involved. Posterior elements are the preferred sites [Figure 11]. Extension to adjacent vertebrae is seen in 17% cases.[9] Radiologically, these tumors show osteoblastic lesions with varying amount of osteoid production, cartilage, and fibrous tissue. CT demonstrates the matrix mineralisation and it is the modality of choice. Rarely, sclrerosing osteoblastic osteosarcoma may present as ivory vertebra [Figure 12]. Talengiectatic osteosarcoma presents as lytic lesion and on MRI fluid-fluid levels can be appreciated. The thick enhancing septa and nodular solid components differentiate it from aneurysmal bone cyst. Prognosis is poor in spinal osteosarcoma as compared to peripheral variety. Secondary osteosarcoma can occur after radiation therapy or in Paget's disease.
Figure 11.

A 22-year-old male with the osteosarcoma of sacrum; axial CT through the sacrum in soft-tissue window reveals large osseous growth from posterior elements of sacrum with soft-tissue component surrounding it
Figure 12.
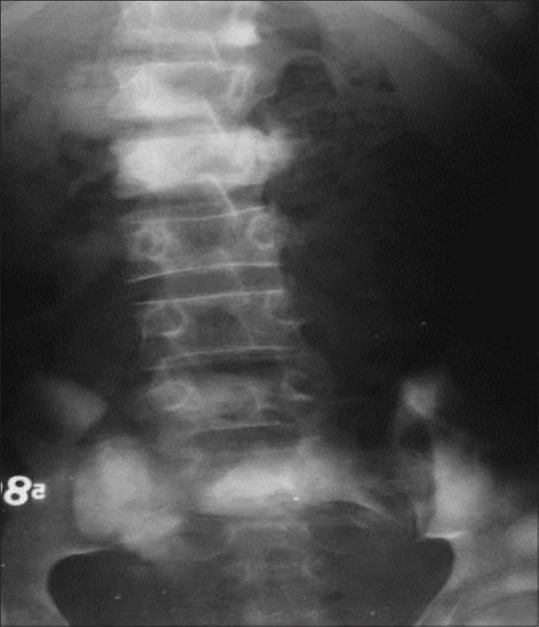
A 14-year-old male with multicentric osteosarcoma; AP radiograph of LS spine reveals sclerotic lesions involving the D12, L1, S1 vertebral bodies (Ivory vertebra) and multiple sclerotic metastasis of L4 vertebra and iliac bones
Chondrosarcoma
Spinal chondrosarcoma accounts for 7–12% of all chondrosarcomas; commonly occurring in 3rd to 7th decade with male to female ratio of 4:1.[5] Thoracic and lumbar regions are common and sacrum is a rare site.[10,11] Tumor arises from posterior elements (40% of cases) and both posterior elements and vertebral body (in 45% cases) and only vertebra body (15% of cases) at presentation [Figure 13].[12] Imaging reveals lytic destruction with chondroid matrix. This matrix calcification may look like ring and arc [Figure 14]. Chondroid matrix mineralization is better demonstrated by CT [Figure 15] and appears as signal void on MRI. Non-mineralized portion of tumor characteristically appears with very high signal due to water content of hyaline cartilage. Enhancement may be lobular, nodular, septal, or diffuse reflecting lobulated growth pattern [Figures 13 and 16]. When cartilaginous cap is more than 1 cm sarcomatous change is indicated. Adjacent vertebrae through disk and adjacent ribs may be involved in 35% of cases.
Figure 13.
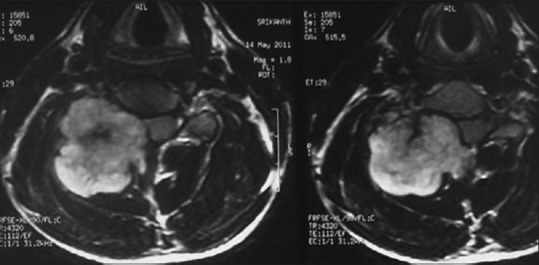
Chondrosarcoma of C5 in a 20-year-old male; T1-weighted contrast enhanced axial MRI images reveal that lobular enhancing mass may be arising from the right of lamina, compressing and displacing the cord
Figure 14.
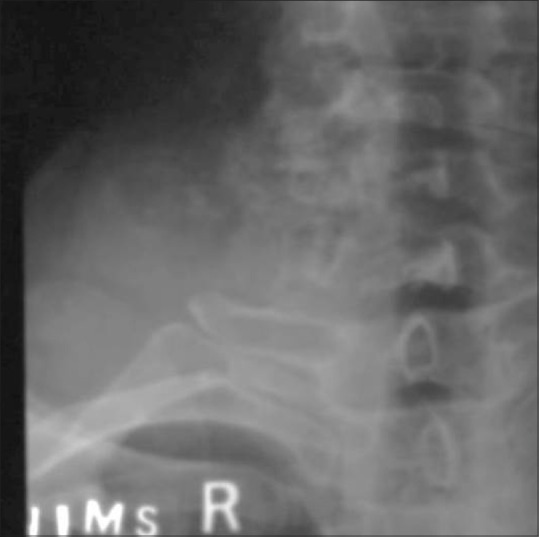
A case of chondrosarcoma of C7 transverse process in a 45-year-old male. Plain AP radiographs of cervical spine demonstrates the ring, arc-like calcifications in large soft tissue along with the destruction of the right transverse process of the C7 vertebra
Figure 15.
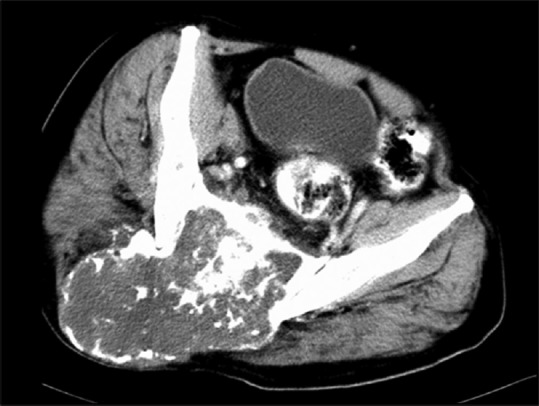
CECT axial image of sacrum: Chondrosarcoma of the sacrum arising from posterior elements and showing classical ring and arc-like calcification with contrast enhancement
Figure 16.
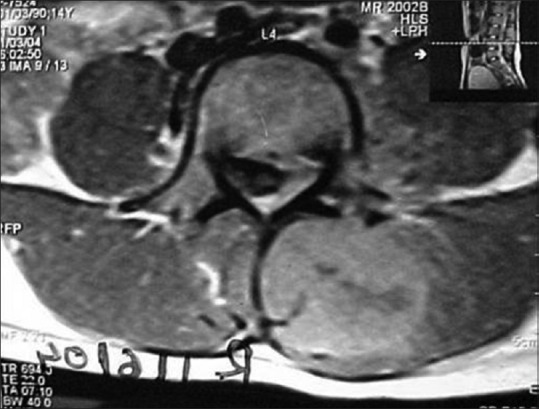
Chondrosarcoma of left transverse process of L4 in a 14-year-old female; axial contrast enhanced T1- weighted image through L4 showing large enhancing soft-tissue along with destruction of the left transverse process. Epidural component is displacing the thecal sac to the right
Hemangioendothelioma and hemangiopericytoma
Hemangioendothelioma is the proliferation of blood vessels endothelial cells forming thin-walled blood vessels and sheets of neoplastic cells. It commonly occurs in the 2nd to 8th decade with male predominance. They have variable malignant behaviour. Thoracic and lumbar spines are the preferred sites. Most lesions involve vertebral body and rarely posterior elements. Imaging reveals lytic lesion with honeycomb appearance. CT scan reveals soft tissue component in addition. Rarely, they may present as sclerotic vertebra. Serpentine signal void in background of heterogeneously enhancing soft tissue is highly characteristic.
Hemangiopericytoma arises from the cells of Zimmermann which surrounds blood vessels. Both benign and malignant forms are encountered. Mostly, it occurs at 4th to 6th decade. Radiological features are similar to hemangioendothelioma presenting as lytic lesion with soft tissue enhancing lesion [Figure 17].
Figure 17 (A-C).
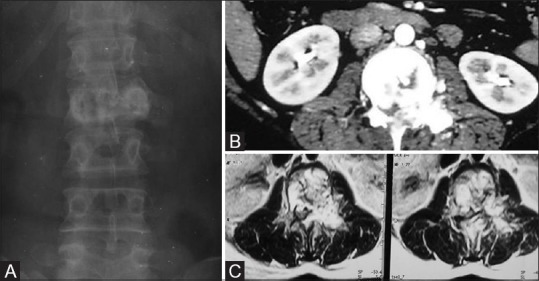
Case of Hemangiopericytoma in a 26-year-old female. (A) Plain AP radiographs of LS spine demonstrating mild collapse of L2 vertebral body and lytic lesion of body, left pedicle. (B) Contrast-enhanced CT scan through L2 vertebral body depicting marked enhancement of the lesion. (C) MRI contrast-enhanced T1 axial images reveal intense enhancement of lesion with multiple curvilinear flow voids characteristic of hemangiopericytoma
Plasmacytoma
Spinal involvement occurs in 25–60% of patients of plasmacytoma and is seen in patients older than 60 years. Dorsal spine followed by lumbar followed by cervical and sacral vertebrae is involved. Tumor involves vertebral body extending to pedicles. Radiographs reveals lytic lesion having soap-bubble appearance [Figure 18]. Variable degrees of collapse may be observed. T1 hypo T2 hyperintense lesion with T1, T2 hypointense thick bony struts representing residual trabeculae and peripheral cortex gives mini-brain appearance on T2W images [Figure 19]. Lesions can cross disk and vertebra. When one lesion is detected, search should be done for a second lesion. Hemangioma is a close differential diagnosis.
Figure 18 (A and B).

(A) Case of plasmacytoma of the sacrum. Plain radiograph image reveals expansile lytic lesion with soap bubble appearance involving the sacrum and crossing left SI joint. (B) Axial nonenhancing CT of the sacrum images reveal expansile lytic lesion with soap-bubble appearance crossing the left SI joint
Figure 19.
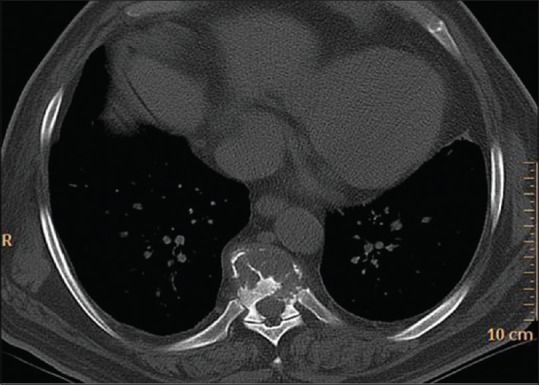
Noncontrast axial CT of the dorsal spine of a 78-year-old male showing lytic lesion of vertebral body with thinning of cortex and characteristic thick bony struts in a case of plasmacytoma
Lymphoma
Primary lymphoma of the spine accounts for 1–3% of all lymphomas. It occurs in 5–7th decade with male: female ratio of 8:1.[6] Involvement of the spine can occur due to paraspinal tumor extending to the spine or tumor originating in the vertebra [Figure 20]. Spinal involvement may manifest as paraspinal, vertebral, or epidural lesions either in isolation or combination [Figure 20]. Radiologically, the lesions are lytic, mixed, or rarely sclerotic causing ivory vertebra [Figure 21]. Pathological fracture and large soft tissue component appearing T1 hypo, T2 variable signal intensity, and variable enhancement on MRI. A focus of marrow replacement and a large surrounding soft tissue mass without large area of cortical destruction is highly suggestive of lymphoma.[13] Sometimes cortical destruction may not be appreciable on radiograph or CT scan [Figure 20]. Contiguous vertebral involvement can occur.
Figure 20.
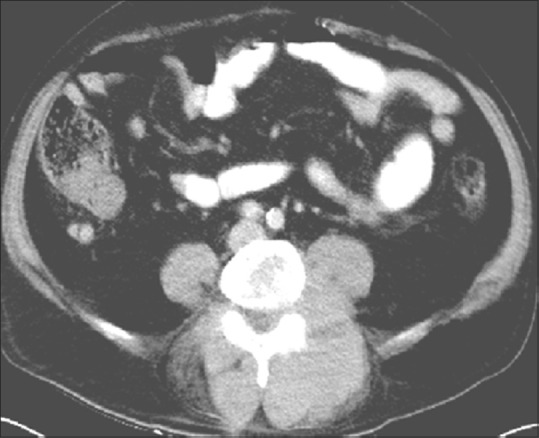
Axial contrast-enhanced CT scan of a 46-year-old female through lumbar vertebra in soft-tissue reveals large soft tissue component with little or no bone destruction, characteristic of lymphoma
Figure 21.
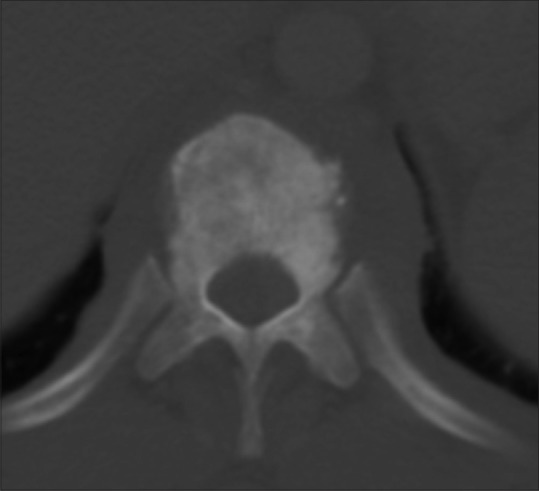
Axial noncontrast CT image through the dorsal vertebra depicts sclerotic lesion of the vertebral body with soft tissue prevertebrally, well depicted in a case of Hodgkin's disease
Leukemia
Leukemia occurs in children and predominately in males. Focal or multiple lytic lesions are seen which appear T1 hypo, T2 hyperintense [Figure 22]. Sometimes there may be sclerotic lesions appearing T1, T2 hypointense. Diffuse enhancement is seen on contrast administration. Sometimes there may be large soft tissue component [Figure 23] extending to the spinal canal causing cord compression.
Figure 22.
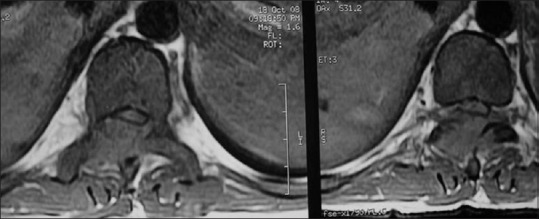
CML in a 30-year-old male; axial T1-weighted image through L1 shows altered signal intensity in form of T1 hypointense lesion involving vertebral body, posterior elements, having minimal soft tissue component and spinal canal compromise
Figure 23.
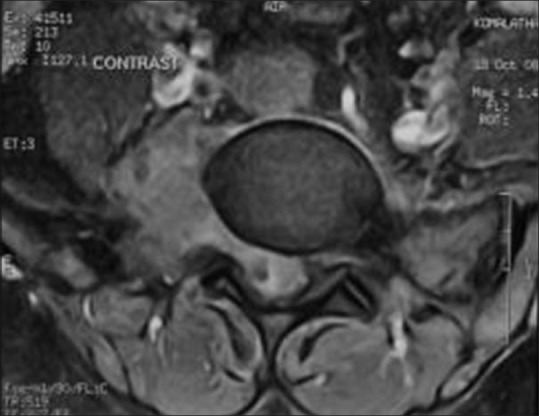
AML in a 27-year-old male; T1 contrast image through L5: Enhancing paravertebral soft tissue along with altered signal lesion involving the right pedicle; transverse process of L5 extending into spinal canal
Chordoma
Chordoma is the second most common tumor of the spine; it occurs mostly in 5–6th decade with a male predominance. Chordoma occurs in the sacrococcygeal region (50%), sphenooccipital region (35%), and vertebrae (15%). Cervical spine is more commonly affected than dorsal or lumbar spine. Chordoma appears as expansile bone destruction with large soft tissue component having appearance of mushroom, collar button [Figure 24]. Amorphous calcification seen in 40% of cases. When two adjacent vertebrae are involved without disk, lesion appears as dumb-bell shaped tumor. T1 hyperintensity may represent hemorrhage, high protein content of myxoid, and mucinous collection. T2 hypointensity represents hemosiderin and fibrous tissue whereas T2 hyperintensity represents high water content. Hypointense fibrous septa divide the gelatinous component of tumor [Figure 24]. Ring/arc-like, heterogenous enhancement is seen on contrast administration. Vertebral chordomas are less expansile and 30% show calcification [Figure 25]. Recurrence is seen in 90%, lymph nodal metastasis is seen in 15%, and distant metastases to lung and bone is noted in 5%.
Figure 24.
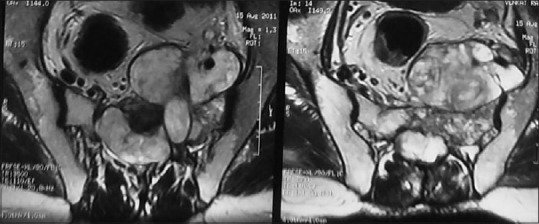
Chordoma of the sacrum in a 45-year-old female; STIR axial MRI depicts large soft tissue component (collar button or mushroom-shaped) prevertebrally with lytic destruction of sacrum at midline. Note the hypointense septa within the mass
Figure 25 (A and B).
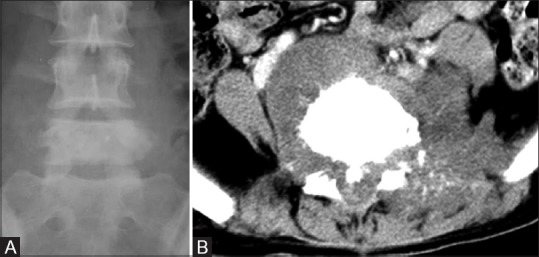
Recurrent chordoma of the vertebral body in a 28-year-old female. (A) Plain radiograph in AP view of LS spine shows sclerotic vertebra (L5). (B) Axial NECT of lumbar spine through L5 shows periosteal reaction in form of sunray speculation along with prevertebral soft tissue
Ewing's sarcoma
From 3–10% of Ewing's sarcoma occurs in the spine. It predominantly occurs in 2nd decade with a male predominance. Sacrum is the most frequently affected (55.2%) followed by lumbar spine (25%). Cervical spine is the least commonly affected site (3.3% of cases).[14] In nonsacral spine, lesion originates from posterior elements extending to the vertebral body [Figure 26]. Ala of the sacrum is the most preferred site involving more than one segment without involving the discs.[14] Radiologically, aggressive lytic destruction with variable degree of collapse and large soft tissue component is characteristic [Figures 26 and 27]. Paraspinal soft tissue is usually larger than osseous lesion and homogenous due to lack of calcification, appearing T1hypo, T2 hyperintense on MRI. Purely sclerotic lesion is rare and it may be due to necrosis and reactive bone formation. Other rare findings are vertebra plana, ivory vertebra and pseudohemangioma pattern [Figure 27].
Figure 26.
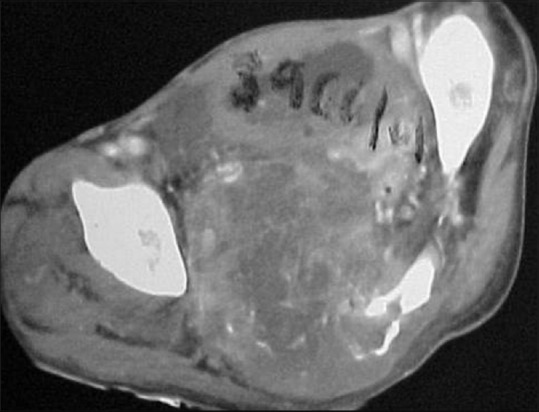
Case of Ewing's sarcoma of the sacrum; contrast-enhanced CT through the sacrum showing permeative type of bone destruction with heterogeneous large soft tissue component
Figure 27.
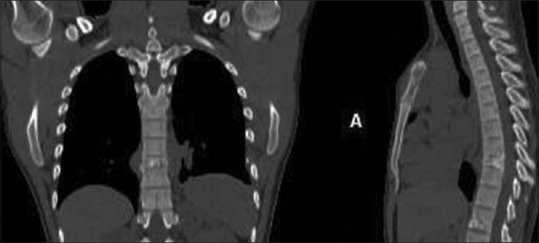
Coronal, sagittal reconstructed CT images of the dorsal spine demonstrating vertebra plana in a case of Ewing's sarcoma in a 23-year-old male
Primitive neuroectodermal tumor
Primitive neuroectodermal tumor (PNET) are extremely rare. Imaging appearance of vertebral PNET is similar to Ewing's sarcoma. They are more aggressive in behaviour.
Other rare primary tumors–Leiomyoma/leiomyosarcoma and spindle cell tumor
Spindle cell tumors are a type of connective tissue cancer in which the cells are spindle shaped. These are heterogenous group of tumors; malignant fibrous histiocytoma, spindle cell sarcoma, leiomyosarcoma, fibrosarcoma and angiosarcoma and its benign counterpart leiomyoma. Leiomyosarcoma of bone arises from preexisting smooth muscle cells in the media of intraosseous blood vessels. Alternately, a close relationship may exist between fibroblast and smooth muscle cells such that an intermediate cellular form, the myofibroblast, may give rise to the leiomyosarcoma.[15] It occurs in 4th to 7th decade with equal frequency in males and females. Metastasis needs to be ruled out before diagnosis of primary leiomyosarcoma of the spine. In regards to imaging, lesions are permeative lytic with indistinct outline and minimal to no sclerosis or periosteal reaction. They have soft tissue component better demonstrated in CT or MRI [Figures 28 and 29]. Spindle cell tumors are extremely rare with only a few reported case reports. Imaging features are similar to leiomyosarcoma [Figure 30].
Figure 28 (A and B).
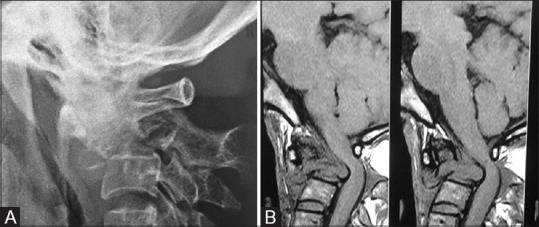
(A) Primary leiomyosarcoma of the C2 vertebral body in a 40-year-old female; lateral radiograph of cervical spine at the CV junction reveals lytic lesion of C2. (B) Sagittal T1-weighted MRI reveals lytic lesion with collapse of C2 having large prevertebral and epidural soft tissue characteristic of leiomyosarcoma
Figure 29.
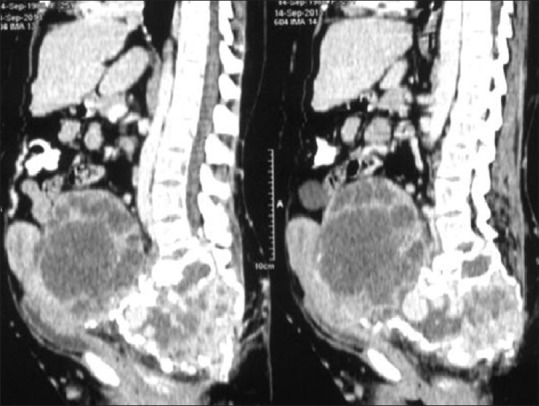
Leiomyosarcoma of the sacrum in a 24-year-old female; contrast-enhanced CT sagittal reconstructed images reveal expansile lytic destruction with large enhancing soft tissue extending to pelvis compressing the uterus and bladder
Figure 30.
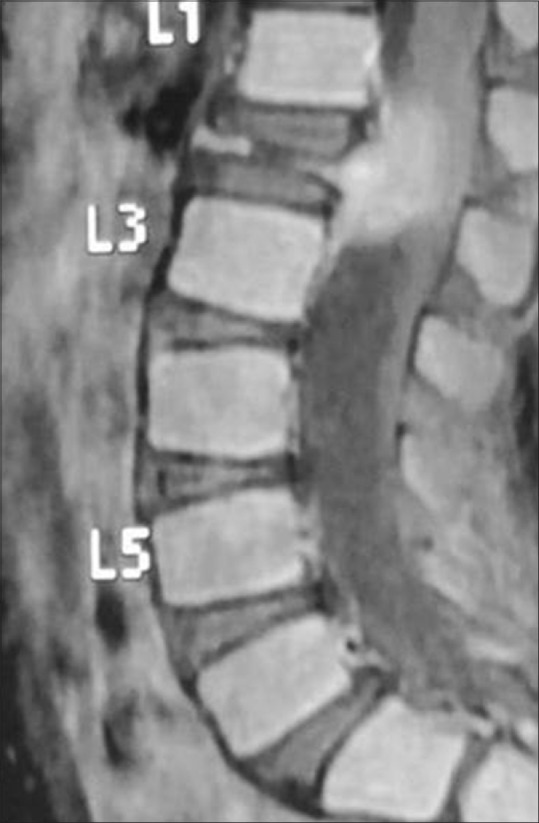
Spindle cell tumor of L1 vertebra in an 8-year-old boy. Contrast-enhanced T1-weighted sagittal image of LS spine reveals the collapse of L1 vertebral body and large enhancing soft tissue comprising the thecal sac
Conclusion
Plasmacytoma/multiple myeloma and lymphoproliferative tumors are the most common malignant primary spinal tumors. Hemangioma is the most common benign tumor of the spine. Although rare, leiomyoma/leiomyosarcoma and spindle cell tumors can occur in the spine. Imaging plays an important role in early diagnosis. CT is useful to assess tumor matrix and osseous change. MR is useful to study associated soft tissue extension, marrow infiltration, and intraspinal extension. However, radiologic manifestations of these tumors need to be correlated with the age, sex, location, and presentation to arrive at a close differential diagnosis that can help the clinician for treatment planning.
Financial support and sponsorship
Nil.
Conflicts of interest
There are no conflicts of interest.
References
- 1.Dreghorn CR, Newman RJ, Hardy GJ, Dickson RA. Primary tumours of the axial skeleton. Experience of the Leeds Regional Bone Tumour Registry. Spine. 1990;15:137–40. doi: 10.1097/00007632-199002000-00018. [DOI] [PubMed] [Google Scholar]
- 2.Abdel Razek AA, Castillo M. Imaging appearance of primary bony tumors and pseudo-tumors of the spine. J Neuroradiol. 2010;37:37–50. doi: 10.1016/j.neurad.2009.08.006. [DOI] [PubMed] [Google Scholar]
- 3.Gates GF. SPECT bone scanning of spine. Semin Nucl Med. 1998;28:78–94. doi: 10.1016/s0001-2998(98)80020-2. [DOI] [PubMed] [Google Scholar]
- 4.Theodorou D, Theodorou SJ, Sartoris D. An imaging overview of primary tumors of the spine: Part 2. Malignant tumors. Clinical imaging. 2008;32:204–11. doi: 10.1016/j.clinimag.2007.09.013. [DOI] [PubMed] [Google Scholar]
- 5.Fletcher CDM, Unni KK, Mertens F, editors. Tumors of soft tissue and bone. Lyon: IARC Press; 2002. World Health Organisation Classification of Tumors. Pathology and Genetics of tumours of soft tissue and bone; pp. 227–32. [Google Scholar]
- 6.Rodallec M, Feldy A, Larousserie F, Anract P, Campagna R, Babinet A, et al. Diagnostic imaging of solitary tumors of the spine: What to do and say? Radiographics. 2008;28:1019–41. doi: 10.1148/rg.284075156. [DOI] [PubMed] [Google Scholar]
- 7.Murphey MD, Choi JJ, Kransdorf MJ, Flemming DJ, Gannon FH. Imaging of Osteochondroma variants and complications with radiologic pathologic correlation. Radiographics. 2000;20:1407–34. doi: 10.1148/radiographics.20.5.g00se171407. [DOI] [PubMed] [Google Scholar]
- 8.Hart RA, Briana S, Biagini R, Currier B, Weinstein JN. A system for surgical staging and management of spine tumors: A clinical outcome study of giant cell tumors of spine. Spine. 1997;22:1773–83. doi: 10.1097/00007632-199708010-00018. [DOI] [PubMed] [Google Scholar]
- 9.Ilasian H, Sundaram M, Unni KK, Shives TC. Primary vertebral osteosarcoma: Imaging findings. Radiology. 2004;230:697–702. doi: 10.1148/radiol.2303030226. [DOI] [PubMed] [Google Scholar]
- 10.Murphey MD, Walker EA, Wilson AJ, Kransdorf MJ, Temple HT, Gannon FH. Imaging of primary chondrosarcoma: Radiologic-pathologic correlation. Radiographics. 2003;23:1245–78. doi: 10.1148/rg.235035134. [DOI] [PubMed] [Google Scholar]
- 11.Boriani S, De Iure F, Bandiera S, Campanacci L, Biagini R, Di Fiore M, et al. Chondrosarcoma of the mobile spine: Report on 22 cases. Spine. 2000;25:804–12. doi: 10.1097/00007632-200004010-00008. [DOI] [PubMed] [Google Scholar]
- 12.Murphey MD, Andrews CL, Flemming DJ, Temple HT, Smith WS, Smirniotopoulos JG. Primary tumors of the spine: Radiologic-pathologic correlation. Radiographics. 1996;16(5):1131–58. doi: 10.1148/radiographics.16.5.8888395. [DOI] [PubMed] [Google Scholar]
- 13.Mulligan ME, McRae GA, Murphey MD. Imaging features of primary lymphoma of bone. AJR Am J Roentgenol. 1999;173:1691–7. doi: 10.2214/ajr.173.6.10584821. [DOI] [PubMed] [Google Scholar]
- 14.Ilaslan H, Sundaram M, Unni KK, Dekutoski MB. Primary Ewing's sarcoma of the vertebral column. Skeletal Radiology. 2004;33:506–13. doi: 10.1007/s00256-004-0810-x. [DOI] [PubMed] [Google Scholar]
- 15.Lo TH, van Rooii WJ, Teepen JL, Verhagen IT. Primary Leiomyosarcoma of the spine. Neuroradiology. 1995;37:465–67. doi: 10.1007/BF00600095. [DOI] [PubMed] [Google Scholar]


