Abstract
Chronic ethyl alcohol (EtOH) consumption results in reactive oxygen species (ROS) generation in bone and osteopenia due to increased bone resorption and reduced bone formation. In this study, transgenic C57Bl/6J mice overexpressing human catalase (TgCAT) were used to test whether limiting excess hydrogen peroxide would protect against EtOH-mediated bone loss. Micro–computed tomography analysis of the skeletons of 6-week-old female chow-fed TgCAT mice revealed a high bone mass phenotype with increased cortical bone area and thickness as well as significantly increased trabecular bone volume (P < 0.05). Six-week-old wild-type (WT) and TgCAT female mice were chow fed or pair fed (PF) liquid diets with or without EtOH, approximately 30% of calories, for 8 weeks. Pair feeding of WT had no demonstrable effect on the skeleton; however, EtOH feeding of WT mice significantly reduced cortical and trabecular bone parameters along with bone strength compared with PF controls (P < 0.05). In contrast, EtOH feeding of TgCAT mice had no effect on trabecular bone compared with PF controls. At 14 weeks of age, there was significantly less trabecular bone and cortical cross-sectional area in TgCAT mice than WT mice (P < 0.05), suggesting impaired normal bone accrual with age. TgCAT mice expressed less collagen1α and higher sclerostin mRNA (P < 0.05), suggesting decreased bone formation in TgCAT mice. In conclusion, catalase overexpression resulted in greater bone mass than in WT mice at 6 weeks and lower bone mass at 14 weeks. EtOH feeding induced significant reductions in bone architecture and strength in WT mice, but TgCAT mice were partially protected. These data implicate ROS signaling in the regulation of bone turnover in an age-dependent manner, and indicate that excess hydrogen peroxide generation contributes to alcohol-induced osteopenia.
Introduction
Bone turnover is the result of a delicate balance between osteoblast activity and osteoclast activity, forming new bone while simultaneously resorbing already existing bone (Capulli et al., 2014; Sims and Vrahnas, 2014). This process is regulated precisely and differentially throughout life (Almeida and O'Brien, 2013; Quiros-Gonzalez and Yadav, 2014). Bone modeling and increased bone formation occur early in development until peak bone mass is attained. Thereafter, bone is maintained through bone remodeling and homeostatic regulation of the balance between bone resorption and new bone formation. Typically, in the mouse, rapid pubertal bone accrual stops at approximately 12 weeks of age, with some variations in time due to strain differences (Ke, 2005).
Reactive oxygen species (ROS) are known disruptors of both bone modeling and bone remodeling (Wauquier et al., 2009; Chen et al., 2010; Atashi et al., 2015 ). Hydrogen peroxide in particular has a substantial impact on bone turnover through the inhibition of osteoblastogenesis (Almeida et al., 2007; Liu et al., 2012). Hydrogen peroxide also inhibits the proliferation of bone marrow–derived mesenchymal stromal cells (Chen et al., 2010). Prolonged oxidative stress damages DNA, lipids, and proteins, and increases the rate of bone cell apoptosis (Droge, 2002; Balaban et al., 2007).
Alcohol consumption is on the rise in adolescent females, with 20.6% of eighth-grade females and 45.1% of twelfth-grade females reporting recent alcohol use (Johnston et al., 2002). Chronic alcohol consumption results in systemic oxidative stress and has multiple negative effects on bone turnover and homeostasis (Turner, 2000; Chakkalakal, 2005; Ronis et al., 2011). Chronic alcohol consumption causes an increase in osteoclastogenesis by activating intracellular signaling as a result of prolonged phosphorylation of the mitogen-activated protein kinase Extracellular Signal Regulated Kinase (ERK) and signal transducer and activator of transcription 3 in both osteoblasts and osteoblast precursors to elevate expression of the tumor necrosis factor family member, receptor activator of nuclear factor kappa-B ligand (RANKL). RANKL, in turn, binds to its receptor RANK on the surface of osteoclast precursors to drive osteoclast differentiation and bone resorption (Chen et al., 2006, 2008; Shankar et al., 2008). Alcohol also blocks nuclear β-catenin expression and signaling in mesenchymal stromal cells (MSCs), causing a decrease in osteoblast differentiation and activity. The decrease in Wnt signaling causes an elevation in Peroxisome Proliferator Activated Receptor Gamma PPARγ signaling, shifting the lineage commitment of multipotential MSCs from osteoblastogenesis to adipogenesis, thus elevating bone marrow adiposity (Chen et al., 2010).
It has been suggested that ethyl alcohol (EtOH) effects on bone cells can be attributed to a rise in intracellular ROS (Chen et al., 2006; Ronis et al., 2011; Mercer et al., 2014). Although the sources of alcohol-derived ROS have not been fully elucidated, a study using a model of total enteral nutrition in rats found that feeding of the antioxidant and glutathione precursor N-acetylcysteine and treatment with the flavoprotein inhibitor diphenyleneiodonium (DPI) protected against EtOH-induced bone loss (Chen et al., 2011). A specific set of flavoproteins that produce ROS, NADPH oxidases (NOX), have been found to be upregulated with chronic alcohol consumption and blocked by the coadministration of DPI, implicating them as a key player in the pathology of alcohol in the bone. Further evidence for the involvement of NOX enzymes comes from a chronic alcohol feeding study using p47phox−/− mice; these genetically altered mice have a functionally inactive NOX1/2 as the result of genetic ablation of an essential cytosolic cofactor of the enzymes. It was found that the p47phox−/− mice were resistant to alcohol induction of RANKL expression and osteoclastogenesis (Mercer et al., 2014).
However, although excess NOX-derived ROS has been linked to bone pathology after alcohol consumption, NOX-mediated ROS signaling cannot be viewed as a strictly negative regulator of bone turnover. A recent study demonstrated the effects of aging in p47phox−/− mice (Chen et al., 2015). These studies revealed that, in early life (6 weeks), p47phox−/− mice had higher bone mass compared with wild-type mice of the same age. However, 2-year-old p47phox−/− mice had lower bone mass compared with wild-type controls, likely due to increased inflammation and bone cell senescence (Chen et al., 2015). This observation lends support to the idea of a dual role for physiologic ROS signaling in the regulation of bone turnover, with ROS signaling a negative regulator of bone turnover in early development but necessary for the maintenance of bone mass in aging. There is also ample evidence in the literature that ROS has both negative and positive biologic functions in multiple tissues (Gough and Cotter, 2011).
In this study a well characterized transgenic mouse model that overexpresses the human catalase gene was used to determine whether the removal of excess hydrogen peroxide would affect bone development and protect against alcohol-induced bone loss.
Materials and Methods
Animals and Experimental Design.
Transgenic C57Bl/6 mice overexpressing human catalase in all tissues (TgCAT) were produced at the University of Texas Health Science Center (San Antonio, TX) (Chen et al., 2003) and were received under an Material Transfer Agreement (MTA) from Dr. Holly Van Remmen. All experimental procedures involving animals were approved by the Institutional Animal Care and Use Committee at the University of Arkansas for Medical Sciences. Mice were housed in an Association Assessment and Accreditation of Laboratory Animal Care–approved animal facility. Twenty 6-week-old wild-type (WT) female C57Bl/6 mice (Jackson Laboratories, Bar Harbor, ME) and 20 TgCAT 6-week-old female mice were randomly assigned to one of three weight-matched groups: rodent chow feeding ad libitum, a 30% EtOH liquid diet, and a corresponding pair-fed (PF) control. All groups had access to water ad libitum. EtOH was added to the Lieber-DeCarli liquid diet (35% of energy from fat, 18% from protein, 47% from carbohydrates) by slowly substituting carbohydrate calories with EtOH calories (#710260; Dyets, Inc., Bethlehem, PA) in a stepwise manner until an EtOH concentration of 4.99% (v/v) (30% total calories) was attained. This level of EtOH was maintained until sacrifice (60 days; Mercer et al., 2012). Mice being pair fed a Lieber-DeCarli control diet (#710027; Dyets, Inc.) were isocalorically matched to their corresponding EtOH group with dextrose based on the diet consumption of the previous day (PF). At sacrifice, trunk blood was collected, and femurs were frozen at −80°C for mRNA extraction or mechanical strength testing. Right tibial bones were fixed in formalin for peripheral quantitative computerized tomography (pQCT) and micro–computed tomography (Micro-CT) analyses. Left tibial bones were fixed in EtOH for immunohistochemistry.
pQCT Analyses.
Ex vivo cortical Bone Mineral Density (BMD), cortical bone area, and trabecular BMD were measured in the tibias collected from all PF and EtOH-treated mouse groups using a STRATEC XCT Research SA+ pQCT machine (Orthometrix, White Plains, NY) in a blinded fashion, as previously described (Shankar et al., 2008). Proximal tibias were analyzed using the manufacturer's software version 5.40 (Orthometrix). Three contiguous sections, 1 mm apart, distal to the proximal end were measured for cortical and trabecular BMD and cortical area with a spatial resolution of 100 μm. Thresholds of 207 and 285 mg/cm3 were used to distinguish trabecular and cortical bone, respectively. Average values for all slices were calculated for statistical analysis.
MicroCT Analyses.
All MicroCT analyses were consistent with current guidelines for the assessment of bone microstructure in rodents (Bouxsein et al., 2010). Formalin-fixed tibias were imaged using a MicroCT 40 (Scanco Medical AG, Bassersdorf, Switzerland) using a 12-μm isotropic voxel size in all dimensions. The region of interest selected for analysis comprised 240 transverse CT slices representing the entire medullary volume extending 1.24 mm distal to the end of the primary spongiosa with a border lying 100 μm from the cortex. Bone was segmented from soft tissue using the same threshold, 247 mg HA/cm3 for trabecular bone. Fractional bone volume [bone volume/tissue volume (BV/TV)] and architectural parameters of trabecular bone [trabecular thickness (Tb.Th), millimeters], trabecular number (Tb.N, per millimeter), and trabecular separation (Tb.Sp; millimeters) were calculated. For cortical bone assessment, MicroCT slices were segmented into bone and marrow regions by applying a visually chosen, fixed threshold for all samples after smoothing the image with a three-dimensional Gaussian low-pass filter (σ = 0.8; support = 1.0) to remove noise. Cortical geometry was assessed in a 1-mm-long region centered at the tibial midshaft. The outer contour of the bone was found automatically by using the built-in Scanco contouring tool Scanco (Nokomis, FL). Total area was calculated by counting all voxels within the contour, bone area was calculated by counting all voxels that were segmented as bone, and marrow area was calculated as total area − bone area. This calculation was performed on all 25 slices (one slice = ∼12.5 μm) using the average for the final calculation. The outer and inner perimeter of the cortical midshaft was determined by a three-dimensional triangulation of the bone surface of the 25 slices, and cortical thickness and other cortical parameters were determined as described previously (Suva et al., 2008). Parameters assessed included total cortical surface area [tCSA (unit)], diameter/thickness, periosteal perimeter, endosteal perimeter, medullary perimeter, and medullary area.
Real-Time Reverse-Transcriptase Polymerase Chain Reaction Analyses.
Total RNA was isolated first by crushing the whole femur shaft in RLT buffer (Qiagen, Hilden, Germany), then by using the RNeasy RNA isolation kit (Qiagen) as per the manufacturer’s instructions. All RNA was reverse transcribed using IScript cDNA synthesis (Bio-Rad Laboratories, Hercules, CA) according to the manufacturer’s instructions, and subsequent real-time polymerase chain reaction analysis was carried out using SYBR green and an ABI 7500 sequence detection system (Applied Biosystems, Foster City, CA). Gene expression from the whole femur shaft was quantified using the change in cycle threshold (ΔΔCT) method relative to 18s, then the appropriate control. Comparisons of raw CT values did not differ between groups, indicating that 18s was an appropriate normalizer. Gene-specific primers were as follows: 18s,GAG GCC CTTG TAA TTG GAA TGA G (forward) and CGC TAT TGG AGG TGG AAT TAC C (reverse); PPARγ, CAC AAT GCC ATC AGG TTT GG (forward) and GCT GGT CGA TAT CAG TGG AGA TC (reverse); Sclerostin (SOST),AAGGGAAGGGAGTGTGGAACGAAA (forward) and AGAGAACCACGTAGCCCAACATCA (reverse); Col1,TGG TTT GGA TGG TGC CAA AGG A (forward) and AGC ACC AAC AGC ACC ATC GTT A (reverse).
Assessment of Mechanical Strength and Stiffness.
Whole-femur mechanical strength testing was done by three-point bending using an MTS 858 Bionix test system load frame (MTS, Eden Prairie, MN) as described previously (Brown et al., 2002). The loading point was displaced at 0.1 mm/s until failure, and load displacement data were recorded at 100 Hz. Test curves were analyzed by using TestWorks software (MTS) to determine measures of whole-bone strength, which are peak load and stiffness. Load to failure was recorded as the load after a 2% drop from peak load.
Measurement of Serum Osteocalcin.
Detection of serum osteocalcin was done using a commercially available enzyme-linked immunosorbent assay kit (Biomedical Technologies, Inc., Stoughton, MA), and results were obtained according to manufacturer instructions.
Ex Vivo Osteoclast Cultures and Tartrate-Resistant Acid Phosphatase Staining.
Bone marrow cells were harvested from the left femur of 6-week-old wild type and 6-week-old transgenic catalase mice (n = 4/group) and plated for osteoclast differentiation, as described previously (Chen et al., 2008). Nonadherent bone marrow cells were plated at a density of 105 cells per well and cultured in Dulbecco's modified Eagle's medium containing l-glutamine, 10% fetal bovine serum, 100 U/ml penicillin and streptomycin, 15 ng of RANKL, and 20 nM 1,25(OH)2D3 for 10 days followed by tartrate-resistant acid phosphatase (TRAP) staining, according to the manufacturer's instructions (Sigma-Aldrich, St. Louis, MO). Mature multinucleated osteoclasts, containing five or more nuclei, were counted under a microscope at 20× magnification.
Measurement of Hydrogen Peroxide.
EtOH-stimulated hydrogen peroxide was measured in primary bone marrow cell culture using the Amplex Red hydrogen peroxide/peroxidase assay (Invitrogen Molecular Probes, Eugene, OR), as per the manufacturer’s instructions. In brief, bone marrow cells were washed twice in suspension with Hanks’ balanced salt solution and seeded in triplicate (2 × 10⁴ per well) in 96-well clear bottom microplates. The Amplex Red reaction buffer (50 μM Amplex Red, 0.1 U⋅ml−1 horseradish peroxidase) was added to the cells, followed by EtOH (50 mM) or phorbol myristate acetate (PMA) (25 ng/ml) treatment for 1 hour at 37°C before measuring absorbance at 560 nm. Data are expressed as the rate of H202 production per minute, which was corrected for nonspecific H202 production by subtracting experimental values from values obtained from control wells.
Statistical Analysis.
Data were expressed as means ± S.E.M. Student’s t test and two-way analysis of variance followed by Student-Newman-Keuls post hoc analysis was used to compare groups. Values were considered statistically significant at P < 0.05 and are reported as such.
Results
Bone Marrow Cells from Wild-Type Mice Produce More Hydrogen Peroxide than Bone Marrow Cells from Transgenic Catalase Mice.
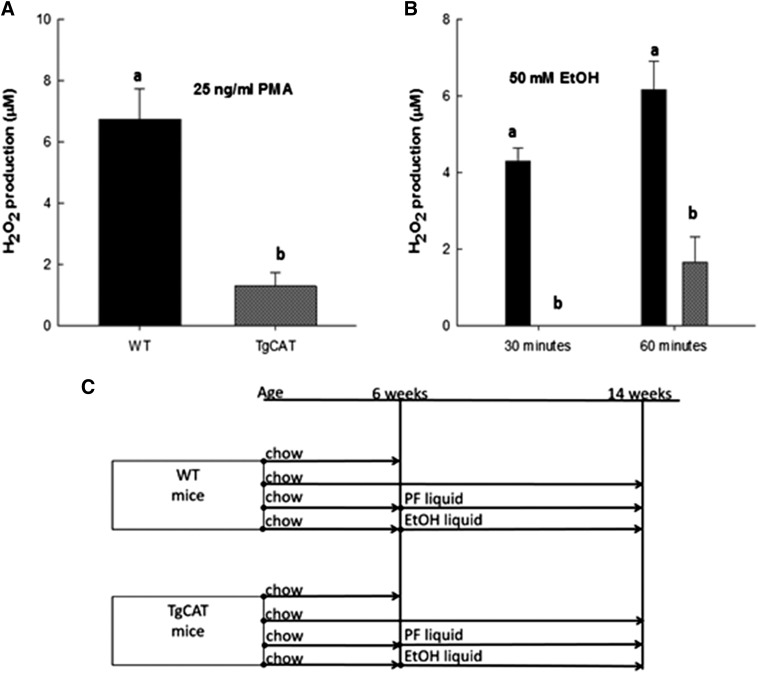
Bone marrow cells were cultured from 6-week-old female WT and TgCAT mice and treated with PMA (25 ng/ml), a known stimulant of hydrogen peroxide production. Hydrogen peroxide levels produced were measured using the Amplex Red assay and compared. Consistent with the findings of Chen et al. (2003), bone marrow cells from TgCAT mice produced 75% less hydrogen peroxide compared with the WT upon PMA stimulation (P < 0.05) (Fig. 1A). We have previously shown that EtOH is a potent stimulator of hydrogen peroxide production in bone (Mercer et al., 2014). After treatment with 50 mM EtOH, bone marrow cells from TgCAT mice produced significantly less hydrogen peroxide at both 30 and 60 minutes of treatment (P < 0.05) compared with WT (Fig. 1B).
Fig. 1.
Hydrogen peroxide measurements in primary bone cells after stimulation with 25 ng/ml PMA (A) and 50 mM EtOH (B). Statistical differences were determined by Student’s t test; values with different letter subscripts are statistically different from each other (P < 0.05). (C) Design of the feeding studies.
TgCAT Mice Have Increased Serum Osteocalcin Along with Decreased Osteoclastogenesis at 6 Weeks of Age.
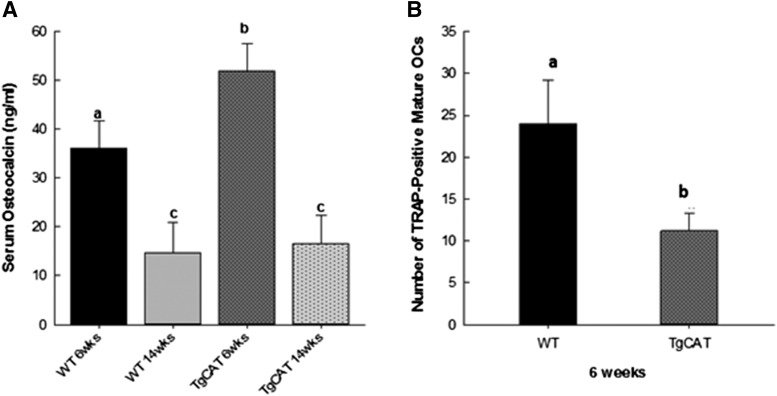
The effect of the TgCAT genotype on bone morphology and turnover was next examined early in development in chow-fed mice at 6 weeks of age. Serum bone biochemical marker assays were performed to measure levels of the bone formation marker osteocalcin in female WT and TgCAT mice at 6 and 14 weeks of age. WT mice had significantly higher levels of osteocalcin at 6 weeks compared with 14 weeks. Interestingly, 6-week-old TgCAT mice had significantly higher levels of serum osteocalcin than the 6-week-old WT group, whereas osteocalcin levels in TgCAT mice at 14 weeks were not different from the WT group at that age (Fig. 2A). Separately, bone marrow cells were isolated from female WT and TgCAT mice at 6 weeks and cultured in media containing the active vitamin D metabolite [1,25(OH)2D3] and RANKL to stimulate osteoclastogenesis, and TRAP-stained multinucleated cells were enumerated after 10 days. Bone marrow cultures from 6-week-old TgCAT mice produced significantly less multinucleated TRAP-positive osteoclasts compared with WT (Fig. 2B).
Fig. 2.
(A) Measurement of serum osteocalcin concentration from 6- and 14-week-old WT and TgCAT mice. Statistical significance was determined by one-way analysis of variance followed by Student-Newman-Keuls post hoc analysis; values with different letter subscripts are statistically different from each other (P < 0.05). (B) Total number of mature osteoclasts from WT and TgCAT bone marrow cells as identified by TRAP staining after culture in media containing 15 ng of RANKL and 20 nM 1,25(OH)2D3 for 10 days. Statistical differences were determined by Student’s t test; values with different letter subscripts are statistically different from each other (P < 0.05). OC, osteocalcin.
TgCAT Mice Have Elevated Trabecular Bone Mass at 6 Weeks but Lower Trabecular Bone at 14 Weeks.
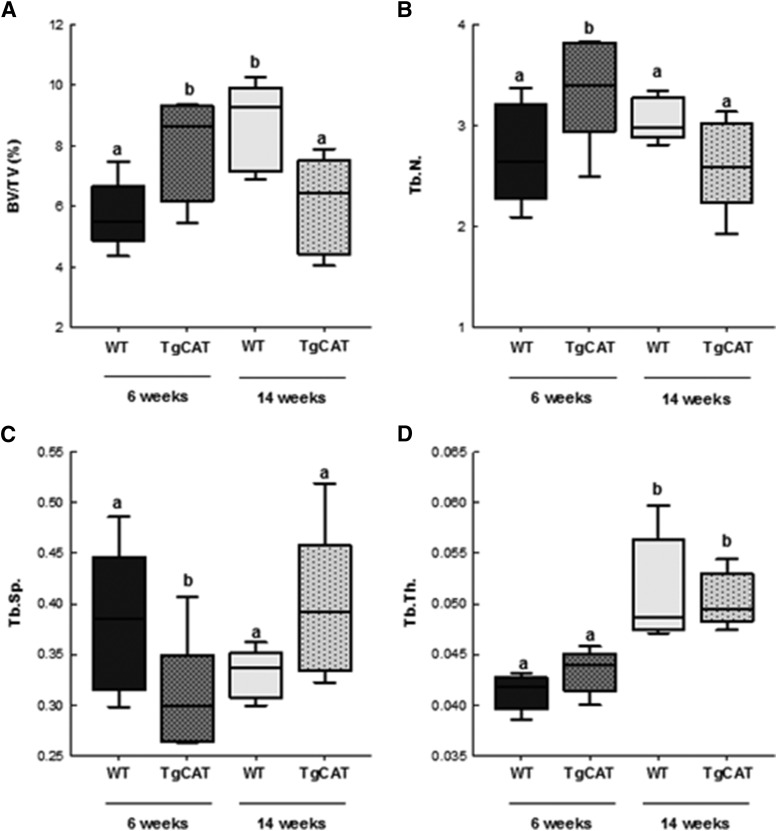
Trabecular microarchitecture of the tibiae from chow-fed female WT and TgCAT mice was measured by MicroCT at 6 and 14 weeks of age (Fig. 3). Examination of TgCAT trabecular microarchitecture at 6 weeks of age revealed a significantly higher BV/TV percentage compared with the WT, as well as significantly higher Tb.N and a lower Tb.Sp. However, at 14 weeks of age, TgCAT mice had significantly decreased BV/TV percentage compared with both the 6-week-old TgCAT mice and the 14-week-old WT mice. In addition, TgCAT mice also had significantly decreased Tb.N and increased Tb.Sp compared with 6-week-old TgCAT mice.
Fig. 3.
MicroCT analysis of tibial trabecular bone—BV/TV percentage (A), Tb.N (B), Tb.Sp (C), and Tb.Th (D)—in 6- and 14-week-old WT and TgCAT mice. Data are expressed with the center line indicating the mean and error bars as ± S.E.M. Statistical significance was determined by two-way analysis of variance followed by Student-Newman-Keuls post hoc analysis. Values with different letter subscripts are statistically different from each other (P < 0.05).
TgCAT Mice Display Elevated Cortical Bone Parameters at 6 Weeks, then a Reduction in Cortical Bone Parameters at 14 Weeks.
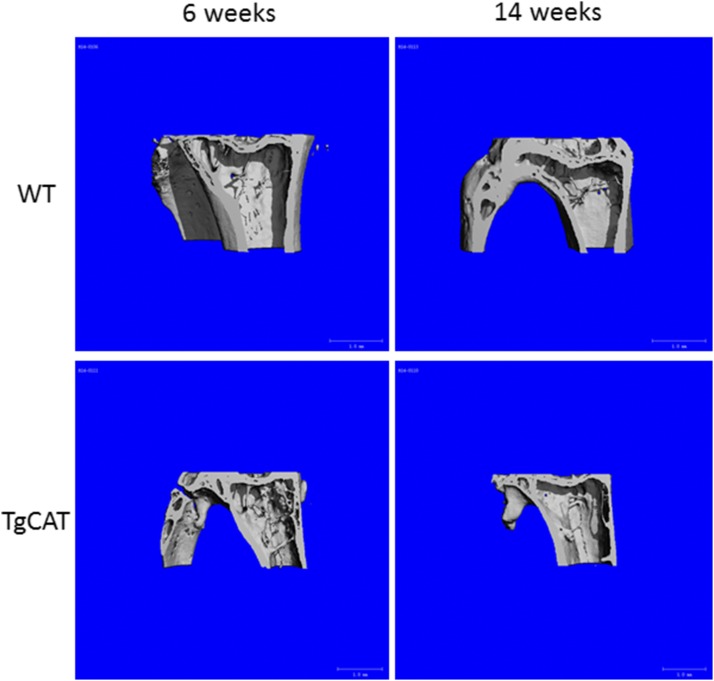
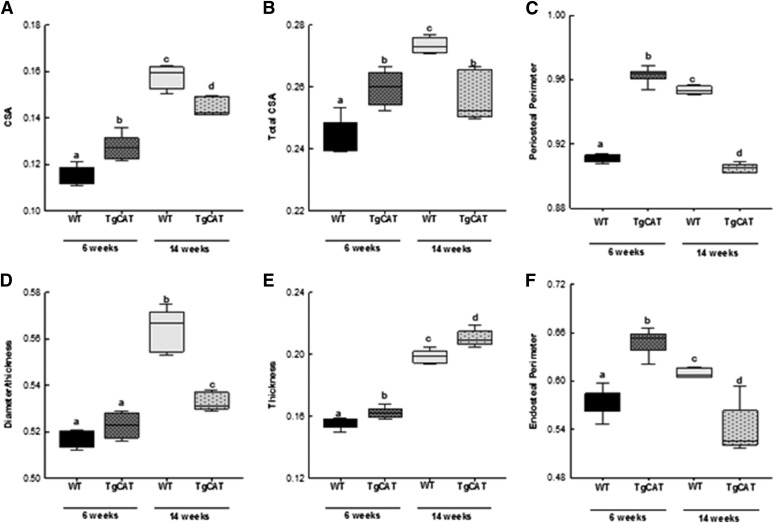
Consistent with the trabecular bone phenotype, 6-week-old TgCAT mice also had significantly increased cortical thickness, tCSA, periosteal perimeter, and endosteal perimeter compared with 6-week-old WT mice (Fig. 4, Fig. 5). In WT mice, the expected increases in cortical thickness, tCSA, diameter, periosteal perimeter, and endosteal perimeter occurred due to growth from 6 to 14 weeks of age. In contrast, 14-week-old TgCAT mice had significantly decreased tCSA, diameter, periosteal perimeter, and endosteal perimeter compared with the WT mice. Periosteal perimeter and endosteal perimeter in the 14-week-old TgCAT mice were also significantly decreased compared with 6-week-old female TgCAT mice. Thus, 14-week-old TgCAT bones were significantly smaller than bones from 6-week-old TgCAT mice and smaller than 14-week-old WT bones. Interestingly, although smaller, TgCAT mice had significantly higher cortical bone thickness compared with the WT group (Fig. 4). (Fig. 5)
Fig. 4.
Representative three-dimensional reconstructed images from MicroCT scans of both 6- and 14-week-old WT and TgCAT mice.
Fig. 5.
MicroCt analysis of tibial cortical bone—cross-sectional area (A), total cross-sectional area (B), periosteal perimeter (C), diameter (D), thickness (E), and endosteal perimeter (F)—in 6- and 14-week-old WT and TgCAT mice. Data are expressed with the center line indicating the mean and error bars as ± S.E.M. Statistical significance was determined by two-way analysis of variance followed by Student-Newman-Keuls post hoc analysis. Values with different letter subscripts are statistically different from each other (P < 0.05).
Mechanical Strength Differences in TgCAT Mice and WT Mice at 6 and 14 Weeks.
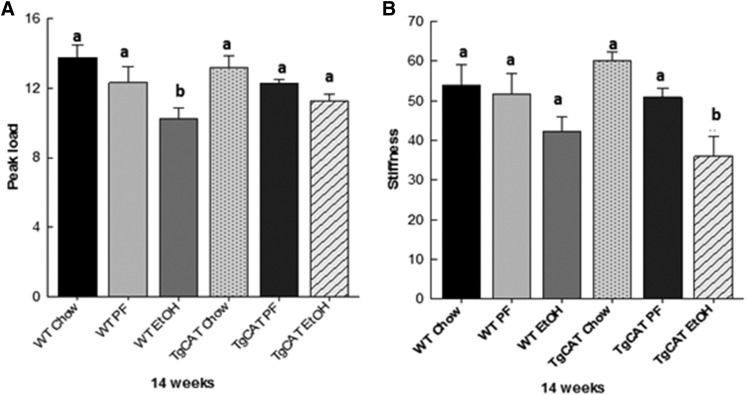
Peak load and stiffness measurements were made using femurs from both WT and TgCAT mice. There was no significant difference in peak load between 6-week-old WT and TgCAT mice (data not shown). There was no significant difference in peak load between 14-week old WT and TgCat mice (Fig. 6). Both the 14-week-old WT and TgCAT mice had significantly higher stiffness compared with both the WT and TgCAT mice at 6 weeks (data not shown), but there was no significant genotype effect on stiffness at 14 weeks of age (Fig. 6).
Fig. 6.
Assessment of mechanical strength of the femur, peak load (A) and stiffness (B), for chow-fed, PF, and EtOH-fed WT mice and chow-fed, PF, and EtOH-fed TgCAT mice (n = 5/group). Data are expressed as the mean ± S.E.M. Statistical significance was determined by one-way analysis of variance followed by Student-Newman-Keuls post hoc analysis; values with different letter subscripts are statistically different from each other (P < 0.05).
TgCAT Mice Express Higher Levels of Sclerostin at 14 Weeks of Age Compared with 6 Weeks of Age.
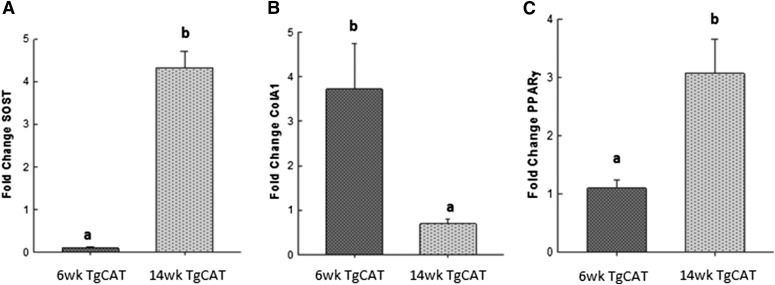
After observing a reduction in bone parameters at age 14 weeks compared with 6 weeks in the TgCAT mice, the underlying molecular mechanisms were examined by comparing femur mRNA expression between the two groups. In 14-week-old female TgCAT mice, sclerostin mRNA expression was significantly elevated compared with expression levels in the 6-week-old TgCAT mice (Fig. 7A), potentially indicative of feedback inhibition of osteoblastogenesis. Consistent with this idea, 14-week-old TgCAT mice expressed significantly less collagen 1 mRNA compared with the 6-week-old TgCAT mouse femurs (Fig. 7B). Similarly, 14-week-old TgCAT mice also expressed significantly higher levels of PPARγ mRNA than the 6-week-old TgCAT mice (Fig. 7C).
Fig. 7.
Total mRNA was extracted from 6- and 14-week-old femurs of TgCAT mice, and expression of sclerostin (A), collagen 1 (B), and PPARγ (C) was compared. Statistical differences were determined by Student’s t test; values with different letter subscripts are statistically different from each other (P < 0.05). SOST, Sclerostin.
Transgenic Catalase Mice Are Partially Protected against Alcohol-Induced Skeletal Toxicity.
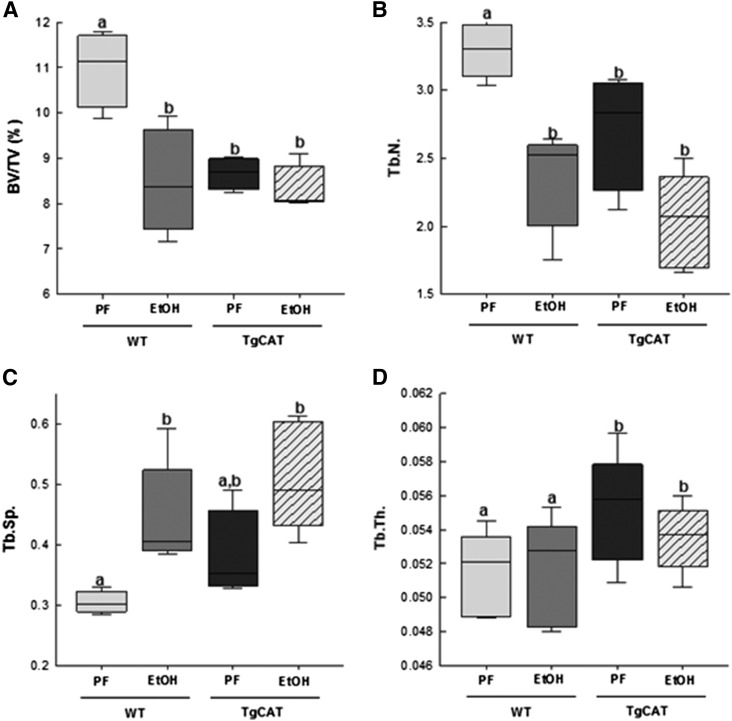
For 8 weeks, starting at 6 weeks of age, both WT and TgCAT mice were either fed a Lieber-DeCarli liquid diet with EtOH substituted for up to 30% of calories or pair fed a control high-fat diet. Blood ethanol concentrations were not different between WT [168.86 mg/dl (S.E.M. 30.78)] and TgCAT [161.18 mg/dl (S.E.M. 46.86)] mice after feeding. Ethanol feeding in WT mice significantly reduced body weight [21.11 g (S.E.M. 0.85)] compared with PF WT controls [24.80 g (S.E.M. 0.75)]. Ethanol-fed TgCAT mice [23.24 g (S.E.M. 0.85)] did not statistically differ in weight from PF TgCAT controls [26.01 g (S.E.M. 0.71)] nor from WT EtOH-fed mice [21.11 g (S.E.M. 0.85)]. MicroCT measurements of trabecular bone were made ex vivo (Fig. 8). As expected, a significant decrease in bone volume (BV/TV percentage) and Tb.N along with an increase in Tb.Sp was observed in WT mice fed EtOH compared with their PF controls. There was no difference in BV/TV percentage between the PF and EtOH-fed TgCAT mice. EtOH-treated TgCAT mice showed a statistically significant increase in Tb.Sp, but neither WT nor TgCAT mice had any statistically significant differences in Tb.Th between the EtOH and PF groups; however, both groups of TgCAT mice had a significantly greater Tb.Th than WT. Interestingly, the PF TgCAT mice had a significantly decreased BV/TV percentage as well as Tb.N compared with WT PF mice; Tb.Sp in TgCAT mice was also significantly elevated compared with the WT. In contrast to trabecular bone, EtOH treatment significantly reduced cortical BMD, along with cortical Bone Mineral Content (BMC), and cortical thickness in both the WT and TgCAT mice (Table 1).
Fig. 8.
MicroCT analysis of tibial trabecular bone—BV/TV percentage (A), Tb.N (B), Tb.Sp (C), and Tb.Th (D)—in WT PF mice, WT EtOH-fed mice, TgCAT PF, and TgCAT EtOH-fed mice. Data are expressed with the center line indicating the mean and error bars as ± S.E.M. Statistical significance was determined by two-way analysis of variance followed by Student-Newman-Keuls post hoc analysis. Values with different letter subscripts are statistically different from each other (P < 0.05).
TABLE 1.
Effects of catalase genotype and EtOH on cortical bone parameters in female mice
pQCT analysis of cortical bone from chow-fed, PF, and EtOH-fed WT mice and chow-fed, PF, and EtOH-fed TgCAT mice (n = 5/group). Data are expressed as the mean with S.E.M. in parentheses. Statistical significance was determined by two-way analysis of variance followed by Student-Newman-Keuls post hoc analysis.
| WT |
TgCAT |
|||||
|---|---|---|---|---|---|---|
| Chow | PF | EtOH | Chow | PF | EtOH | |
| BMD (mg/cm3) | 873.31 (5.73)a | 863.31 (5.84)a | 815.58 (6.99)b | 874.22 (5.73)a | 876.84 (5.84)a | 858.05 (6.99)c |
| BMC (mg) | 0.78 (0.02)a | 0.77 (0.02)a | 0.65 (0.02)b | 0.76 (0.02)a | 0.79 (0.02)a | 0.72 (0.02)c |
| Total area (mm2) | 0.903 (0.02)a | 0.898 (0.02)a | 0.802 (0.02)b | 0.871 (0.02)a | 0.904 (0.02)a | 0.848 (0.02)b |
| Thickness (mm) | 0.279 (0.00)a | 0.276 (0.02)a | 0.253 (0.00)b | 0.284 (0.02)a | 0.285 (0.02)a | 0.269 (0.02)c |
BMC, bone mineral content.
Values with different letter subscripts are statistically different from each other (P < 0.05). a>b; a>c; b<c.
After 60 days of Lieber-DeCarli liquid diet with or without EtOH, mechanical strength parameters were tested in the femurs of WT and TgCAT mice (Fig. 6). No significant differences in either peak load or stiffness were observed between chow-fed WT and liquid diet PF WT mice. Similarly, no differences in peak load and stiffness were observed in chow-fed TgCAT and liquid diet PF TgCAT. However, 60 days of EtOH feeding significantly reduced peak load in WT mice, but not TgCAT mice. Interestingly, EtOH feeding did not significantly reduce stiffness in WT mice, but stiffness was significantly lower in TgCAT mice fed EtOH compared with TgCAT PF and chow-fed controls.
Discussion
Through the use of female rodent models of chronic EtOH consumption, our group has consistently observed that EtOH exposure results in osteopenia through the upregulation of osteoclastogenesis coupled with the suppression of osteoblastogenesis (Chen et al., 2006, 2008, 2011; Shankar et al., 2008; Mercer et al., 2012; Yang et al., 2014). We have also reported that chronic EtOH feeding causes an increase in ROS in bone, and that this excess ROS is responsible for the deleterious effects of EtOH on bone turnover (Chen et al., 2010, 2011; Mercer et al., 2014). Elevated ROS production causes an increase in RANKL expression in osteoblasts and osteoblast precursors in vitro and in bone in vivo (Chen et al., 2006; Mercer et al., 2014). Increased RANK-RANKL signaling, in turn, leads to increased osteoclast differentiation and bone resorption (Chen et al., 2008). EtOH-induced ROS also inhibits Wnt–β-catenin signaling in vitro in MSCs and in vivo in bone, resulting in a decrease in osteoblast differentiation and decreased bone formation (Chen et al., 2010).
Alcohol is metabolized to acetaldehyde in osteoblasts by Alcohol Dehydrogenase (ADH) but not by cytochrome P450 2E1, which is not expressed in the osteoblast (Chen et al., 2006). Both the pan-NOX inhibitor DPI as well as the antioxidant N-acetylcysteine were able to completely protect against EtOH effects on bone in the female rat, indicating a potential role for NOX enzymes as a source of ROS derived from EtOH consumption (Chen et al., 2011). Indeed when p47phox knockout mice, which contain functionally inactive NOX1/2 enzymes, were fed EtOH, protection against the EtOH-induced elevation in bone resorption was observed (Mercer et al., 2014). NOX1, NOX2, and NOX4 are all expressed in bone, making it highly possible that these NOX enzymes play a role in increasing ROS in bone cells after EtOH consumption. However, it is also likely that EtOH-induced ROS in bone is multisourced with contributions from NOX enzymes, changes in cellular redox status from NADH formation coincident with EtOH metabolism, and “leakiness” of the electron transport chain, resulting in excess mitochondrial ROS. The overall increase in ROS ultimately results in excess production of H2O2 as a result of the action of superoxide dismutase (SOD). H2O2, among many other effects, has been shown to act as a cell signaling molecule as the result of inhibition of tyrosine phosphatase activity and stimulation of mitogen-activated protein kinases (Robinson et al., 2001; Torrie et al., 2001).
In the current study, transgenic mice overexpressing human catalase globally to remove the excess H2O2 were used to determine whether this would provide protection against EtOH effects in the skeleton. It is important to note that significant reductions in hydrogen peroxide production were observed in bone marrow cells derived from TgCAT mice compared with WT mice upon stimulation with either PMA or 50 mM EtOH, which corresponds to an attainable blood alcohol level of 0.23% as demonstrated by concentrations observed in emergency rooms (Urso et al., 1981). After establishing that the TgCAT mice did, in fact, have reduced ROS production in bone cells, WT and TgCAT animals were subjected to a Lieber-DeCarli liquid diet, with or without substitution of alcohol, starting at 6 weeks of age and continuing until sacrifice at 14 weeks of age. The TgCAT genotype displays a partial protection against EtOH-induced bone loss. It is clear that excess ROS production due to EtOH negatively impacts bone, but it was difficult to elucidate the specific role of EtOH-derived hydrogen peroxide in this study since the TgCAT genotype has an impact on the basal level of ROS production and endogenous ROS signaling. It is possible that H2O2 is not the only form of ROS generated after EtOH exposure that decreases bone mass and strength. The initial product of NOX2 is superoxide, whereas NOX4 produces H2O2; each of these may have distinct effects on bone turnover. Additional studies in mice with genetic manipulation of Superoxide Dismutase (SOD) enzymes or after treatment with SOD mimetics are needed to distinguish between these effects. Additionally, EtOH’s effects on bone are not only driven by ROS production. EtOH has been shown to act as an endocrine disruptor suppressing bone anabolic factors, including serum estradiol (Shankar et al., 2008), the growth hormone–IGF-1 axis (Badger et al., 1993), vitamin D3 (Mercer et al., 2012), and fibroblast growth factors (Zhao et al., 2015). EtOH also causes bone cell apoptosis (Mercer et al., 2012). Lipid peroxidation products and glutathione reduction have also been shown to have negative impacts on bone turnover (Almeida et al., 2009; Jilka et al., 2010). It is therefore likely that EtOH impacts cortical bone of TgCAT mice via such ROS-independent actions.
It is well known that ROS, and specifically hydrogen peroxide, negatively impact bone with age (Harman, 1956; Muller et al., 2007; Jilka et al., 2010). Based on our findings that bone mass is upregulated early in the life of TgCAT mice due to increased bone formation and reduced bone resorption, it appears that hydrogen peroxide is a negative regulator of osteoblastogenesis and positive regulator of osteoclastogenesis even at younger ages. However, regardless of diet, TgCAT mice had significantly decreased trabecular bone compared with WT mice at age 14 weeks. This finding suggests that hydrogen peroxide signaling has a critical role in the acquisition of bone mass in growing female mice.
MicroCT analysis of the cortical bone of 6-week-old TgCAT and WT mice showed results consistent with the changes observed in trabecular bone. TgCAT mice displayed significant increases in cross-sectional area, endosteal perimeter, periosteal perimeter, and medullary perimeter compared with their WT counterparts. At 6 weeks of age, hydrogen peroxide inhibits both the trabecular and cortical bone compartments. Perhaps, in this case, hydrogen peroxide is acting as a balancing molecule during early bone development, stimulating bone resorption to respond to the potential of excess bone accrual during development. Increases in hydrogen peroxide and ROS in general have been shown to reduce bone mass (Almeida et al., 2007; Li et al., 2011); here, however, we demonstrate clearly that hydrogen peroxide plays an important role in maintaining bone mass after peak bone mass generally occurs in mice (12 weeks of age). Gene expression data comparing sclerostin expression at 6 and 14 weeks in the TgCAT mice suggest that hydrogen peroxide acts to regulate the secretion of sclerostin, which would greatly impact bone density. Such an idea is supported by the current data, but requires and demands ongoing investigation. Sclerostin is a Wnt-pathway inhibitor that is secreted by osteocytes and binds to LRP5/6 and inhibits Wnt signaling to block new bone formation. Since sclerostin has been shown to exert profound changes on the bone microenvironment (Sims and Walsh, 2012), it is therefore reasonable to expect that hydrogen peroxide could impact this signaling and therefore affect bone density across the murine life span.
Recently, p47phox−/− mice have been shown to have increased bone mass during early development, whereas their aged counterparts have decreased bone mass compared with WT controls (Chen et al., 2015). Thus, the widely accepted idea that ROS accumulation drives the negative aging process is being challenged (Gladyshev, 2014). The data presented in this manuscript along with data from aging of p47phox−/− mice (Chen et al., 2015) support the conclusion that endogenous ROS signaling is beneficial at different stages during the aging process. Interestingly, studies in yeast have shown that cells grown anaerobically without ROS had a shorter life span than cells grown aerobically (Koc et al., 2004). Furthermore, in support of the hypothesis of beneficial ROS signaling, decreasing antioxidant protection has been shown to extend life span compared with normal sod-2 expression (Van Raamsdonk and Hekimi, 2009). Our data showing elevated bone mass in TgCAT mice early in life and lower bone mass with age are entirely consistent with the idea that there is an age-related switch in the basal amount of physiologic ROS signaling needed for bone homeostasis with age.
In conclusion, these data support the notion that ROS signaling plays a key role in maintaining bone homeostasis across the life span. These data show that the removal of H2O2 in young mice leads to high bone mass but a subsequent loss in bone mass later in life, possibly due to increased sclerostin production and consequent increase in PPARγ signaling. This intriguing observation suggests an even more fundamental role for H2O2 in skeletal aging that is currently under intensive investigation.
Abbreviations
- BMD
bone mineral density
- BV/TV
bone volume/tissue volume
- DPI
diphenyleneiodonium
- EtOH
ethyl alcohol
- microCT
Micro–computed tomography
- MSC
mesenchymal stromal cell
- NOX
NADPH oxidase
- PF
pair fed
- PPARγ
peroxisome proliferator activated receptor gamma
- pQCT
peripheral quantitative computerized tomography
- RANKL
receptor activator of nuclear factor kappa-B ligand
- ROS
reactive oxygen species
- SOD
superoxide dismutase
- Tb.N
trabecular number
- Tb.Sp
trabecular separation
- Tb.Th
trabecular thickness
- tCSA
total cortical surface area
- TgCAT
C57Bl/6J mice overexpressing human catalase
- TRAP
tartrate-resistant acid phosphatase
- WT
wild type
Authorship Contributions
Participated in research design: Ronis, Mercer, Chen, Badger.
Conducted experiments: Mercer, Alund, Pulliam, Suva Chen.
Contributed new reagents or analytic tools: Van Remmen.
Performed data analysis: Mercer, Alund.
Wrote or contributed to the writing of the manuscript: Alund, Ronis, Mercer, Suva.
Footnotes
Funded in part by the National Institutes of Health National Institute on Alcohol Abuse and Alcoholism [Grant R01 AA018282] (M.J.J.R), National Institute of General Medical Sciences [Grant T32GM106999-01] “Systems Pharmacology and Toxicology” Training Program (University of Arkansas for Medical Sciences), and University of Arkansas for Medical Sciences CUMG University Medical Group Funds.
References
- Almeida M, Ambrogini E, Han L, Manolagas SC, Jilka RL. (2009) Increased lipid oxidation causes oxidative stress, increased peroxisome proliferator-activated receptor-gamma expression, and diminished pro-osteogenic Wnt signaling in the skeleton. J Biol Chem 284:27438–27448. [DOI] [PMC free article] [PubMed] [Google Scholar]
- Almeida M, Han L, Martin-Millan M, O’Brien CA, Manolagas SC. (2007) Oxidative stress antagonizes Wnt signaling in osteoblast precursors by diverting beta-catenin from T cell factor- to forkhead box O-mediated transcription. J Biol Chem 282:27298–27305. [DOI] [PubMed] [Google Scholar]
- Almeida M, O’Brien CA. (2013) Basic biology of skeletal aging: role of stress response pathways. J Gerontol A Biol Sci Med Sci 68:1197–1208. [DOI] [PMC free article] [PubMed] [Google Scholar]
- Atashi F, Modarressi A, Pepper MS. (2015) The role of reactive oxygen species in mesenchymal stem cell adipogenic and osteogenic differentiation: a review. Stem Cells Dev 24:1150–1163. [DOI] [PMC free article] [PubMed] [Google Scholar]
- Badger TM, Ronis MJ, Lumpkin CK, Valentine CR, Shahare M, Irby D, Huang J, Mercado C, Thomas P, Ingelman-Sundberg M, et al. (1993) Effects of chronic ethanol on growth hormone secretion and hepatic cytochrome P450 isozymes of the rat. J Pharmacol Exp Ther 264:438–447. [PubMed] [Google Scholar]
- Balaban YH, Korkusuz P, Simsek H, Gokcan H, Gedikoglu G, Pinar A, Hascelik G, Asan E, Hamaloglu E, Tatar G. (2007) Dipeptidyl peptidase IV (DDP IV) in NASH patients. Ann Hepatol 6:242–250. [PubMed] [Google Scholar]
- Bouxsein ML, Boyd SK, Christiansen BA, Guldberg RE, Japsen KJ, Muller R. (2010) Guidelines for assessment of bone microstructure in rodents using micro-computed tomography. J Bone Min Res 25:1468–1486. [DOI] [PubMed] [Google Scholar]
- Brown EC, Perrien DS, Fletcher TW, Irby DJ, Aronson J, Gao GG, Hogue WJ, Skinner RA, Suva LJ, Ronis MJ, Hakkak R, Badger TM, Lumpkin CK, Jr. (2002) Skeletal toxicity associated with chronic ethanol exposure in a rat model using toal enteral nutrition. J Pharmacol Exp Ther 301:1132–1138. [DOI] [PubMed] [Google Scholar]
- Capulli M, Paone R, Rucci N. (2014) Osteoblast and osteocyte: games without frontiers. Arch Biochem Biophys 561:3–12. [DOI] [PubMed] [Google Scholar]
- Chakkalakal DA. (2005) Alcohol-induced bone loss and deficient bone repair. Alcohol Clin Exp Res 29:2077–2090. [DOI] [PubMed] [Google Scholar]
- Chen JR, Haley RL, Hidestrand M, Shankar K, Liu X, Lumpkin CK, Simpson PM, Badger TM, Ronis MJ. (2006) Estradiol protects against ethanol-induced bone loss by inhibiting up-regulation of receptor activator of nuclear factor-kappaB ligand in osteoblasts. J Pharmacol Exp Ther 319:1182–1190. [DOI] [PubMed] [Google Scholar]
- Chen JR, Lazarenko OP, Blackburn ML, Mercer KE, Badger TM, Ronis MJ. (2015) p47phox-Nox2-dependent ROS Signaling Inhibits Early Bone Development in Mice but Protects against Skeletal Aging. J Biol Chem 290:14692–14704. [DOI] [PMC free article] [PubMed] [Google Scholar]
- Chen JR, Lazarenko OP, Shankar K, Blackburn ML, Badger TM, Ronis MJ. (2010) A role for ethanol-induced oxidative stress in controlling lineage commitment of mesenchymal stromal cells through inhibition of Wnt/beta-catenin signaling. J Bone Miner Res 25:1117–1127. [DOI] [PMC free article] [PubMed] [Google Scholar]
- Chen JR, Lazarenko OP, Shankar K, Blackburn ML, Lumpkin CK, Badger TM, Ronis MJ. (2011) Inhibition of NADPH oxidases prevents chronic ethanol-induced bone loss in female rats. J Pharmacol Exp Ther 336:734–742. [DOI] [PMC free article] [PubMed] [Google Scholar]
- Chen JR, Shankar K, Nagarajan S, Badger TM, Ronis MJ. (2008) Protective effects of estradiol on ethanol-induced bone loss involve inhibition of reactive oxygen species generation in osteoblasts and downstream activation of the extracellular signal-regulated kinase/signal transducer and activator of transcription 3/receptor activator of nuclear factor-kappaB ligand signaling cascade. J Pharmacol Exp Ther 324:50–59. [DOI] [PubMed] [Google Scholar]
- Chen X, Mele J, Giese H, Van Remmen H, Dollé ME, Steinhelper M, Richardson A, Vijg J. (2003) A strategy for the ubiquitous overexpression of human catalase and CuZn superoxide dismutase genes in transgenic mice. Mech Ageing Dev 124:219–227. [DOI] [PubMed] [Google Scholar]
- Dröge W. (2002) Free radicals in the physiological control of cell function. Physiol Rev 82:47–95. [DOI] [PubMed] [Google Scholar]
- Gladyshev VN. (2014) The free radical theory of aging is dead. Long live the damage theory! Antioxid Redox Signal 20:727–731. [DOI] [PMC free article] [PubMed] [Google Scholar]
- Gough DR, Cotter TG. (2011) Hydrogen peroxide: a Jekyll and Hyde signalling molecule. Cell Death Dis 2:e213. [DOI] [PMC free article] [PubMed] [Google Scholar]
- Harman D. (1956) Aging: a theory based on free radical and radiation chemistry. J Gerontol 11:298–300. [DOI] [PubMed] [Google Scholar]
- Jilka RL, Almeida M, Ambrogini E, Han L, Roberson PK, Weinstein RS, Manolagas SC. (2010) Decreased oxidative stress and greater bone anabolism in the aged, when compared to the young, murine skeleton with parathyroid hormone administration. Aging Cell 9:851–867. [DOI] [PMC free article] [PubMed] [Google Scholar]
- Johnston LD, O'Malley PM, and Bachman JG (2002) Monitoring the future: national survey results on drug use, 1975-2001: Volume I. Secondary School Students. NIH Pub No. 02-5106 NIH, Washington, DC.
- Ke HZ. (2005) In vivo characterization of skeletal phenotype of genetically modified mice. J Bone Miner Metab 23 (Suppl):84–89. [DOI] [PubMed] [Google Scholar]
- Koc A, Gasch AP, Rutherford JC, Kim HY, Gladyshev VN. (2004) Methionine sulfoxide reductase regulation of yeast lifespan reveals reactive oxygen species-dependent and -independent components of aging. Proc Natl Acad Sci USA 101:7999–8004. [DOI] [PMC free article] [PubMed] [Google Scholar]
- Li D, Bi L, Meng G, Wang J, Lv R, Liu M, Liu J, Hu Y. (2011) Mineral status and mechanical properties of cancellous bone exposed to hydrogen peroxide for various time periods. Cell Tissue Bank 12:51–58. [DOI] [PubMed] [Google Scholar]
- Liu H, Bian W, Liu S, Huang K. (2012) Selenium protects bone marrow stromal cells against hydrogen peroxide-induced inhibition of osteoblastic differentiation by suppressing oxidative stress and ERK signaling pathway. Biol Trace Elem Res 150:441–450. [DOI] [PubMed] [Google Scholar]
- Mercer KE, Sims CR, Yang CS, Wynne RA, Moutos C, Hogue WR, Lumpkin CK, Suva LJ, Chen JR, Badger TM, et al. (2014) Loss of functional NADPH oxidase 2 protects against alcohol-induced bone resorption in female p47phox-/- mice. Alcohol Clin Exp Res 38:672–682. [DOI] [PMC free article] [PubMed] [Google Scholar]
- Mercer KE, Wynne RA, Lazarenko OP, Lumpkin CK, Hogue WR, Suva LJ, Chen JR, Mason AZ, Badger TM, Ronis MJ. (2012) Vitamin D supplementation protects against bone loss associated with chronic alcohol administration in female mice. J Pharmacol Exp Ther 343:401–412. [DOI] [PMC free article] [PubMed] [Google Scholar]
- Muller FL, Song W, Jang YC, Liu Y, Sabia M, Richardson A, Van Remmen H. (2007) Denervation-induced skeletal muscle atrophy is associated with increased mitochondrial ROS production. Am J Physiol Regul Integr Comp Physiol 293:R1159–R1168. [DOI] [PubMed] [Google Scholar]
- Quiros-Gonzalez I, Yadav VK. (2014) Central genes, pathways and modules that regulate bone mass. Arch Biochem Biophys 561:130–136. [DOI] [PubMed] [Google Scholar]
- Robinson CJ, Sloss CM, Plevin R. (2001) Inactivation of JNK activity by mitogen-activated protein kinase phosphatase-2 in EAhy926 endothelial cells is dependent upon agonist-specific JNK translocation to the nucleus. Cell Signal 13:29–41. [DOI] [PubMed] [Google Scholar]
- Ronis MJ, Mercer K, Chen JR. (2011) Effects of nutrition and alcohol consumption on bone loss. Curr Osteoporos Rep 9:53–59. [DOI] [PMC free article] [PubMed] [Google Scholar]
- Shankar K, Hidestrand M, Liu X, Chen JR, Haley R, Perrien DS, Skinner RA, Lumpkin CK, Jr, Badger TM, Ronis MJ. (2008) Chronic ethanol consumption inhibits postlactational anabolic bone rebuilding in female rats. J Bone Miner Res 23:338–349. [DOI] [PubMed] [Google Scholar]
- Sims NA, Vrahnas C. (2014) Regulation of cortical and trabecular bone mass by communication between osteoblasts, osteocytes and osteoclasts. Arch Biochem Biophys 561:22–28. [DOI] [PubMed] [Google Scholar]
- Sims NA, Walsh NC. (2012) Intercellular cross-talk among bone cells: new factors and pathways. Curr Osteoporos Rep 10:109–117. [DOI] [PubMed] [Google Scholar]
- Suva LJ, Hartman E, Dilley JD, Russell S, Akel NS, Skinner RA, Hogue WR, Budde U, Varughese KI, Kanaji T, Ware J. (2008) Platlet dysfunction and a high bone mass phenotype in a murine model of platlet-type von Willebrand disease. Am J Pathol 172:430–439. [DOI] [PMC free article] [PubMed] [Google Scholar]
- Torrie LJ, MacKenzie CJ, Paul A, Plevin R. (2001) Hydrogen peroxide-mediated inhibition of lipopolysaccharide-stimulated inhibitory kappa B kinase activity in rat aortic smooth muscle cells. Br J Pharmacol 134:393–401. [DOI] [PMC free article] [PubMed] [Google Scholar]
- Turner RT. (2000) Skeletal response to alcohol. Alcohol Clin Exp Res 24:1693–1701. [PubMed] [Google Scholar]
- Urso T, Gavaler JS, Van Thiel DH. (1981) Blood ethanol levels in sober alcohol users seen in an emergency room. Life Sci 28:1053–1056. [DOI] [PubMed] [Google Scholar]
- Van Raamsdonk JM, Hekimi S. (2009) Deletion of the mitochondrial superoxide dismutase sod-2 extends lifespan in Caenorhabditis elegans. PLoS Genet 5:e1000361. [DOI] [PMC free article] [PubMed] [Google Scholar]
- Wauquier F, Leotoing L, Coxam V, Guicheux J, Wittrant Y. (2009) Oxidative stress in bone remodelling and disease. Trends Mol Med 15:468–477. [DOI] [PubMed] [Google Scholar]
- Yang CS, Mercer KE, Alund AW, Suva LJ, Badger TM, Ronis MJ. (2014) Genistein supplementation increases bone turnover but does not prevent alcohol-induced bone loss in male mice. Exp Biol Med (Maywood) 239:1380–1389. [DOI] [PMC free article] [PubMed] [Google Scholar]
- Zhao C, Liu Y, Xiao J, Liu L, Chen S, Mohammadi M, McClain CJ, Li X, Feng W. (2015) FGF21 mediates alcohol-induced adipose tissue lipolysis by activation of systemic release of catecholamine in mice. J Lipid Res 56:1481–1491. [DOI] [PMC free article] [PubMed] [Google Scholar]


