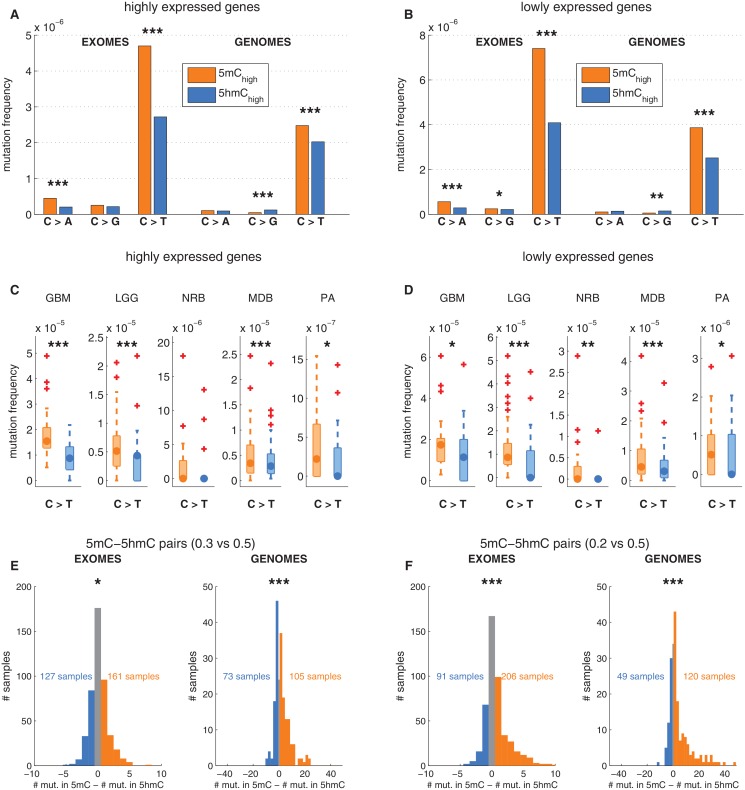
Figure 3. Depletion of C>T mutations in 5hmC sites is not explained by gene expression or regional mutation rate variation.
(A–B) Frequency of mutations in 5mChigh vs 5hmChigh sites within highly expressed (A) or lowly expressed (B) genes (see Materials and methods). (C–D) Boxplot visualisation of C>T mutation frequency for each cancer type. (E) For each patient sample, the overall difference in mutations in paired sites was calculated and compared using a Wilcoxon signed-rank test. Shown here is a histogram of samples by the difference in mutations for paired 5mC and 5hmC sites (negative values shown blue, positive in orange; see Materials and methods for details). Mutations in 5mC sites exceed paired 5hmC sites, causing a shift to the right. (F) Same as E but using a more stringent definition of 5mC (only sites with threshold5mC ≤ 0.2).


