

Abstract
Background
Hepatocyte nuclear 4 alpha (HNF4α), involved in glucose and lipid metabolism, has been linked to intestinal inflammation and abnormal mucosal permeability. Moreover, in a genome-wide association study, the HNF4A locus has been associated with ulcerative colitis. The objective of our study was to evaluate the association between HNF4α genetic variants and CD in two distinct Canadian pediatric cohorts.
Methods
The sequencing of the HNF4A gene in 40 French Canadian patients led to the identification of 27 SNPs with a minor allele frequency greater than 5%. To assess the impact of these SNPs on disease susceptibility, we first conducted a case-control discovery study on 358 subjects with CD and 542 controls. We then carried out a replication study in a separate cohort of 416 cases and 1,208 controls.
Results
In the discovery cohort, the genotyping of the identified SNPs revealed that 6 were significantly associated with CD. Among them, rs1884613 was replicated in the second CD cohort (OR: 1.33; P<0.012) and this association remained significant when both cohorts were combined and after correction for multiple testing (OR: 1.39; P<0.004). An 8-marker P2 promoter haplotype containing rs1884613 was also found associated with CD (P<2.09×10⁻⁴ for combined cohorts).
Conclusions
This is the first report showing that the HNF4A locus may be a common genetic determinant of childhood-onset CD. These findings highlight the importance of the intestinal epithelium and oxidative protection in the pathogenesis of CD.
Keywords: Crohn’s disease, HNF4α, genetic variants, oxidative stress
INTRODUCTION
Inflammatory bowel disease (IBD) refers to two chronic inflammatory disorders affecting the intestinal mucosa: Crohn’s disease [CD, (MIM 266600)] and ulcerative colitis [UC, (MIM 191390)]. CD is common in developed countries, with a prevalence estimated at 100–300/100,000 (1, 2). The etiology of CD has not yet been elucidated, but is considered to involve a complex interaction between predisposing genes, environmental factors, and impaired immune response to the commensal gut microbiome. The understanding of the genetic contribution to risk of CD has advanced enormously as a result of recent case-control and genome-wide association studies (GWAS) (3–6). Indeed, GWAS (7), followed by deep sequencing of GWAS loci (8), have identified 85 distinct loci associated with the disease. However, the genes identified thus far only explain approximately 23% of the genetic contribution to CD (7).
Hepatocyte nuclear factor 4 alpha (HNF4α, NR2A1), belongs to the nuclear hormone receptor superfamily (9). It is expressed in the liver, kidney, pancreatic islets and gut (9–11). HNF4α interacts with regulatory elements in promoters and enhancers of genes involved in cholesterol, fatty acid, and glucose metabolism (12). Genes transactivated by HNF4α encode various transcription factors, enzymes and proteins involved in numerous processes, including hematopoiesis, blood coagulation/fibrinolysis, as well as hepatic development and function (13–17). HNF4A is located on locus 20q13.1-13.2. Thirteen exons have been identified, and alternative splicing of these exons result in at least nine isoforms of the protein. The transcription of three of these isoforms is driven by an alternate promoter known as P2, which is located 45.6 kb upstream P1 promoter (18, 19). It has been suggested that P2 promoter drives transcription in pancreatic β cells (18, 19), while the P1 promoter is mainly active in liver cells (18, 20). Both promoters appear to be effective in the intestine (20).
The key hepatic and pancreatic functions of HNF4α are well established. It activates gluconeogenesis in hepatocytes (21), maintains glucose homeostasis by regulating gene expression in pancreatic β cells (12, 22), activates insulin genes through both direct and indirect mechanisms (22, 23) and regulates the expression of many genes such as apolipoproteins (24). Rare loss-of-function mutations in the HNF4A gene cause a monogenic form of type 2 diabetes (T2D), type 1 maturity-onset diabetes of the young (MODY1) (25). Also, HNF4α has been reported to be associated with the risk of late-onset T2D in several populations (26–28). In the gut, HNF4α plays a role in colonic development (29), lipid transport (30) as well as intestinal epithelial cell differentiation and phenotype expression (31, 32). It has also been associated with susceptibility to abnormal intestinal permeability, inflammation and oxidative stress (33, 34). Of particular relevance, a recent GWAS demonstrated associations between the 20q13.1 locus that harbors the HNF4A gene and risk of developing UC (35). Interestingly, no associations with CD were found. In this study, we have hypothesized that HNF4A gene polymorphisms are associated with the risk of developing CD. We comprehensively examined the association between variants in and around the HNF4A gene and CD in 2 distinct cohorts of Canadian children.
RESULTS
SNP Discovery by Sequencing
To determine the single nucleotide polymorphism (SNP) content of HNF4α in our population, 30 selected fragments of the HNF4A gene were sequenced in 40 IBD French Canadian patients. As summarized in Table 1, sequencing of the gene led to the identification of 27 SNPs with a minor allele frequency greater than 5%. Among the identified SNPs, one was non-synonymous (rs1800961, T130I) and 26 were located either in intronic or promoter regions. All SNPs had been previously reported in dbSNP (build 131). Most of the variants identified in this study were previously associated with the risk of developing T2D (36) and dyslipidemia (37). The relative positions of SNPs on the HNF4A locus are illustrated in Figure 1.
Table 1.
Summary of the Identified SNPs in the Targeted HNF4 Regions
| SNP | Change | Position | MAF |
|---|---|---|---|
| rs4810424 | G>C | 42,408,437 (9,428 bp upstream Exon 1D) | C=0.203 |
| rs1884613 | C>G | 42,413,829 (4,036 bp upstream Exon 1D) | G=0.186 |
| rs1884614 | C>T | 42,413,933 (3,982 bp upstream Exon 1D) | T=0.186 |
| rs6031543 | C>G | 42,413,979 (3,935 bp upstream Exon 1D) | G=0.157 |
| rs2144908 | G>A | 42,419,131 (Intron 1A-1D) | A=0.157 |
| rs6031550 | C>T | 42,423,085 (Intron 1A-1D) | T=0.190 |
| rs6031551 | T>C | 42,423,127 (Intron 1A-1D) | C=0.180 |
| rs16988991 | G>A | 42,423,191 (Intron 1A-1D) | A=0.203 |
| rs6031552 | C>A | 42,423,208 (Intron 1A-1D) | A=0.167 |
| rs6103716 | A>C | 42,433,044 (Intron 1A-1D) | C=0.242 |
| rs6031558 | G>C | 42,433,057 (Intron 1A-1D) | C=0.300 |
| rs6130608 | T>C | 42,457,422 (5,933 bp upstream Exon 1A) | C=0.250 |
| rs2425637 | G>T | 42,457,463 (5,892 bp upstream Exon 1A) | G=0.382 |
| rs2425639 | A>G | 42,460,924 (2,431 bp upstream Exon 1A) | A=0.400 |
| rs2425640 | A>G | 42,461,451 (1,904 bp upstream Exon 1A) | A=0.295 |
| rs3212172 | A>G | 42,461,804 (1,551 bp upstream Exon 1A) | G=0.125 |
| rs1800963 | A>C | 42,462,699 (656 bp upstream Exon 1A) | C=0.379 |
| rs2071997 | G>A | 42,463,849 (661 bp upstream Exon 1B) | A=0.125 |
| rs736824 | T>C | 42,468,074 (Intron 1A/1B-2) | C=0.329 |
| rs745975 | C>T | 42,468,107 (Intron 1A/1B-2) | T=0.250 |
| rs3212183 | C>T | 42,468,552 (Intron 2-3) | T=0.487 |
| rs3212184 | G>C | 42,468,574 (Intron 2-3) | C=0.459 |
| rs1885088 | G>A | 42,472,454 (Intron 3-4) | A=0.222 |
| rs1800961 | C>T (T130I) | 42,475,778 (Exon 4) | T=0.107 |
| rs3212195 | G>A | 42,476,509 (Intron 4-5) | A=0.190 |
| rs3212198 | C>T | 42,477,775 (Intron 4-5) | C=0.369 |
| rs3818247 | G>T | 42,490,894 (Intron 9-10) | T=0.283 |
SNPs revealed by sequencing with a frequency greater than 5% in the inflammatory bowel disease French Canadian sample population (20 Crohn’s disease and 20 ulcerative colitis patients). The SNP positions are based on the March 2006 Homo sapiens high coverage assembly from the Genome Reference Consortium. MAF=minor allele frequency.
Figure 1. Schematic Illustration of the Location of 27 SNPs Identified in the HNF4A Gene.

Relative position of 27 SNPs revealed by sequencing within the HNF4A locus. The labeled shaded regions are exons, numbered 1–10. ● Non-synonymous SNP, □ synonymous intronic SNP.
Genotyping for Association with Crohn’s Disease in Discovery Cohort
A total of 356 (271 French Canadian, 57 Jewish and 30 non Caucasian) subjects with CD and 542 controls were included for genotyping. The descriptive and clinical characteristics of participants of the discovery cohort are shown in Table 2. There was a non significant higher proportion of males among the cases (53.35%). The mean age at diagnosis (15.41 ± 7.63 y) was similar to age of controls (13.67 ± 2.72 y). Based on the Montreal Classification (38), most cases (n=224, 62.57%) had ileocolonic location (L3 ± L4) and inflammatory disease (B1 ± p) (n=287, 80.17%). The majority of the population was of Caucasian ancestry (n=271, 75.70%).
Table 2.
Characteristics of Controls and Crohn’s Disease Subjects in Discovery, Replication and Combined Cohorts
| Characteristics | Discovery Cohort | Replication Cohort | Combined Cohorts | |||
|---|---|---|---|---|---|---|
|
| ||||||
| Controls, % (n = 542) | CD, % (n = 358) | Controls, % (n = 1,208) | CD, % (n = 416) | Controls, % (n = 1,750) | CD, % (n = 774) | |
| Sex | ||||||
| Male | 49.45 (268) | 53.35 (191) | 49.25 (595) | 56.49 (235) | 49.31 (863) | 55.04 (426) |
| Female | 50.55 (274) | 46.65 (167) | 50.75 (613) | 43.51 (181) | 50.69 (887) | 44.96 (348) |
| Ethnicity | ||||||
| French Canadian (caucasian) | 100.00 (542) | 75.70 (271) | 100.00 (1,208) | 100.00 (416) | 100.00 (1,750) | 88.76 (687) |
| Jewish | 15.92 (57) | 7.36 (57) | ||||
| Non caucasian | 8.38 (30) | 3.88 (30) | ||||
| Age, years | ||||||
| Range | 8.60 – 17.20 | 9.00 – 16.00 | 8.60 – 17.20 | |||
| Mean ± SD | 13.67 ± 2.72 | 12.71 ± 2.98 | 12.83 ± 2.90 | |||
| Age-at-onset, years | ||||||
| Range | 2.11 – 62.67 | 2.00 – 28.70 | 2.00 – 62.67 | |||
| Mean ± SD | 15.41 ± 7.63 | 12.69 ± 3.41 | 13.94 ± 5.90 | |||
| Disease Behavior | ||||||
| B1 ± p | 80.17 (287) | 87.74 (365) | 84.24 (652) | |||
| B2 ± p | 12.29 (44) | 6.01 (25) | 8.91 (69) | |||
| B3 ± p | 7.54 (27) | 6.25 (26) | 6.85 (53) | |||
| Disease Location | ||||||
| L1 ± L4 | 10.61 (38) | 21.63 (90) | 16.53 (128) | |||
| L2 ± L4 | 25.42 (91) | 29.81 (124) | 27.77 (215) | |||
| L3 ± L4 | 62.57 (224) | 48.08 (200) | 54.78 (424) | |||
| Only L4 | 1.40 (5) | 0.48 (2) | 0.90 (7) | |||
For the discovery cohort, patients were recruited from the inflammatory bowel disease clinics of tertiary pediatric and adult hospitals in Montreal. For the replication cohort, patients were recruited at the pediatric gastroenterology clinics of 3 hospitals across Canada (Montreal, Vancouver, Ottawa). Controls were obtained from the 1999 Quebec Child and Adolescent Health and Social Survey (QCAHSS). The designation of ethnicity was based on self-report. Disease location and behavior was classified according to World Gastroenterology Organization’s Montreal classification (L1, ileum; L2, colon; L3, ileocolon; L4, upper GI tract; B1, non-stricturing and non-penetrating; B2, structuring; B3, penetrating; p, perianal modifier). CD= Crohn’s disease.
Among the 27 SNPs identified, 3 could not be adequately genotyped due to technical difficulties (rs2425640, rs16988991 and rs3212184). The remaining 24 SNPs were analyzed for association. Table 3 shows the distribution of the frequencies of the corresponding alleles in cases and controls. Six SNPs demonstrated significant associations with CD: rs4810424 (P<0.007), rs1884613 (P<0.004), rs1884614 (P<0.005), rs2144908 (P<0.003), rs3212172 (P<0.044) and rs1800963 (P<0.048). Analysis including only individuals of Caucasian ancestry revealed similar results. However, the associations for 2 SNPs (rs3212172 and rs1800963) were no longer significant probably due to reduced power.
Table 3.
Distribution of Allele Frequencies for Controls and Crohn’s Disease Subjects in Discovery Cohort
| SNP | Controls MAF | CD MAF | Odds ratio | 95% CI | P Value |
|---|---|---|---|---|---|
| rs4810424 | 0.152 | 0.202 | 1.407 | 1.099 – 1.800 | 0.007* |
| rs1884613 | 0.148 | 0.200 | 1.432 | 1.118 – 1.835 | 0.004* |
| rs1884614 | 0.149 | 0.201 | 1.429 | 1.116 – 1.829 | 0.005* |
| rs6031543 | 0.147 | 0.148 | 1.000 | 0.758 – 1.329 | 0.977 |
| rs2144908 | 0.148 | 0.204 | 1.467 | 1.143 – 1.882 | 0.003* |
| rs6031550 | 0.229 | 0.204 | 0.865 | 0.690 – 1.084 | 0.209 |
| rs6031551 | 0.229 | 0.208 | 0.882 | 0.701 – 1.109 | 0.282 |
| rs6031552 | 0.225 | 0.193 | 0.823 | 0.650 – 1.042 | 0.106 |
| rs6130716 | 0.336 | 0.320 | 0.929 | 0.756 – 1.140 | 0.479 |
| rs6031558 | 0.324 | 0.303 | 0.910 | 0.741 – 1.119 | 0.371 |
| rs6130608 | 0.264 | 0.256 | 0.961 | 0.771 – 1.197 | 0.721 |
| rs2425637 | 0.464 | 0.469 | 1.019 | 0.843 – 1.232 | 0.845 |
| rs2425639 | 0.471 | 0.461 | 0.957 | 0.789 – 1.161 | 0.659 |
| rs3212172 | 0.141 | 0.178 | 1.300 | 1.007 – 1.680 | 0.044* |
| rs1800963 | 0.392 | 0.441 | 1.218 | 1.002 – 1.480 | 0.048* |
| rs2071197 | 0.093 | 0.097 | 1.042 | 0.757 – 1.434 | 0.802 |
| rs736824 | 0.389 | 0.395 | 1.027 | 0.841 – 1.255 | 0.791 |
| rs745975 | 0.231 | 0.239 | 1.045 | 0.829 – 1.317 | 0.710 |
| rs3212183 | 0.474 | 0.461 | 0.951 | 0.788 – 1.148 | 0.600 |
| rs1885088 | 0.229 | 0.234 | 1.025 | 0.817 – 1.286 | 0.828 |
| rs1800961 | 0.026 | 0.027 | 1.043 | 0.573 – 1.898 | 0.890 |
| rs3212195 | 0.207 | 0.237 | 1.184 | 0.924 – 1.517 | 0.181 |
| rs3212198 | 0.408 | 0.396 | 0.950 | 0.776 – 1.162 | 0.617 |
| rs3818247 | 0.349 | 0.354 | 1.019 | 0.834 – 1.245 | 0.851 |
Distribution of the genotyped SNPs minor allele frequencies. Allelic association for individual SNPs was carried out using logistic regression by fitting an additive model. CI=confidence interval; MAF=minor allele frequency; CD= Crohn’s disease.
P <0.05
Genotyping for Association with Crohn’s Disease in Replication Cohort
For replication, we selected 10 SNPs significantly associated with CD in the single SNP and haplotype analyses of the discovery study. A total of 416 Caucasian subjects with CD and 1,208 controls were included for genotyping. The descriptive and clinical characteristics of participants of the replication cohort are shown in Table 2. The proportion of males among the cases was higher (56.49%), but the difference was not significant. The mean age at diagnosis (12.69 ± 3.41 y) was similar to that of controls (12.71 ± 2.98 y). A high percentage of cases (n=200, 48.08%) had ileocolonic location (L3 ± L4) and inflammatory disease (B1 ± p) (n=365, 87.75%). All subjects in replication cohort were of Caucasian ancestry. Table 4 shows the distribution of the frequencies of the corresponding alleles in cases and controls. All SNPs were in Hardy-Weinberg equilibrium. Among the 10 SNPs genotyped for replication, rs1884613 remained significantly associated with CD (OR: 1.327; P<0.012).
Table 4.
Distribution of Allele Frequencies for Controls and Crohn’s Disease Subjects in Replication and Combined Cohorts
| SNP | Controls MAF | CD MAF | Odds ratio | 95% CI | P Value | Adjusted P Value |
|---|---|---|---|---|---|---|
|
Replication Cohort
| ||||||
| rs4810424 | 0.156 | 0.145 | 0.912 | 0.719 – 1.156 | 0.465 | |
| rs1884613 | 0.139 | 0.175 | 1.327 | 1.060 – 1.635 | 0.012* | |
| rs1884614 | 0.152 | 0.175 | 1.196 | 0.957 – 1.472 | 0.121 | |
| rs6031543 | 0.154 | 0.143 | 0.918 | 0.733 – 1.150 | 0.453 | |
| rs2144908 | 0.147 | 0.156 | 1.071 | 0.854 – 1.344 | 0.551 | |
| rs6031550 | 0.236 | 0.213 | 0.880 | 0.725 – 1.067 | 0.191 | |
| rs6031551 | 0.236 | 0.222 | 0.922 | 0.759 – 1.121 | 0.409 | |
| rs6031552 | 0.237 | 0.214 | 0.881 | 0.728 – 1.067 | 0.188 | |
| rs3212172 | 0.153 | 0.142 | 0.909 | 0.721 – 1.146 | 0.425 | |
| rs1800963 | 0.410 | 0.399 | 0.956 | 0.809 – 1.129 | 0.596 | |
|
| ||||||
|
Combined Cohorts
| ||||||
| rs4810424 | 0.154 | 0.172 | 1.144 | 0.968 – 1.351 | 0.114 | 1.000 |
| rs1884613 | 0.142 | 0.187 | 1.389 | 1.183 – 1.631 | 0.0001* | 0.004** |
| rs1884614 | 0.151 | 0.188 | 1.295 | 1.104 – 1.520 | 0.001* | 0.040** |
| rs6031543 | 0.152 | 0.145 | 0.945 | 0.796 – 1.121 | 0.517 | 1.000 |
| rs2144908 | 0.148 | 0.179 | 1.260 | 1.070 – 1.484 | 0.006* | 0.240 |
| rs6031550 | 0.234 | 0.209 | 0.870 | 0.754 – 1.005 | 0.058 | 0.232 |
| rs6031551 | 0.234 | 0.215 | 0.900 | 0.778 – 1.041 | 0.154 | 1.000 |
| rs6031552 | 0.233 | 0.205 | 0.849 | 0.734 – 0.982 | 0.028 | 1.000 |
| rs3212172 | 0.149 | 0.158 | 1.068 | 0.902 – 1.265 | 0.443 | 1.000 |
| rs1800963 | 0.404 | 0.418 | 1.060 | 0.935 – 1.202 | 0.362 | 1.000 |
Distribution of the genotyped SNPs minor allele frequencies. Allelic association for individual SNPs was carried out using logistic regression by fitting an additive model. CI=confidence interval; MAF=minor allele frequency; CD= Crohn’s disease.
P <0.05.
The P values adjusted for rs1884613 and rs1884614 retained significance after correcting for multiple comparisons (40 tests).
Single SNP Analysis in Combined Cohorts
The descriptive and clinical characteristics of participants of the combined discovery and replication cohorts are shown in Table 2. Association analysis revealed a significant association for 3 of the 6 SNPs associated in the discovery cohort, namely rs1884613 (OR: 1.389, P<0.0001), rs1884614 (OR: 1.295, P<0.001) and rs2144908 (OR: 1.260, P<0.006) (Table 4). After correction for multiple testing (40 test), the association for rs1884613 and rs1884614 remained significant (respectively P<0.004 and P<0.04).
Haplotype Analysis
Linkage disequilibrium (LD) analysis (Figure 2) showed that the SNPs were distributed within six major haplotype blocks: a first block including 8 SNPs overlapping Promoter 2 and spanning on a 14 kb region (rs4810424, rs1884613, rs1884614, rs6031543, rs2144908, rs6031550, rs6031551, rs6031552); a second block of 2 adjacent intronic SNPs (rs6103716 and rs6031558); a third block of 3 SNP (3 kb) in the intronic region between both promoters (rs6130608, rs2425637, rs2425639); a fourth block of 2 SNPs (4 kb) also located in the intronic region between the 2 promoters (rs2071197 and rs736824); a fifth block of 2 intronic SNPs (rs745975 and rs3212183, respectively in introns 1 and 2); and finally a sixth block of 3 SNPs (5 kb) located in introns 3 and 4 (rs3212195 and rs3212198). Table 5 shows the results of the haplotype analyses performed on the SNPs within each block of LD in the discovery cohort. One 8-marker haplotype was significantly associated with CD (haplotype CGTCACTC, χ2=8.276, P<0.004). Subsequently, association analysis was replicated for the significant P2 promoter haplotype. In the replication cohort, the association with the CGTCACTC haplotype remained significant (χ2=8.266, P<0.004) (Table 5). Combining both cohorts, the significant association was also replicated (χ2=19.997, P<7.755 × 10⁻⁶), even after correcting for 27 haplotype comparisons (P<2.09 × 10⁻⁴). Moreover, a second haplotype was found significantly associated with CD (GCCCGTCA, (χ2=4.038, P<0.045) when both cohorts were combined.
Figure 2. Illustration of the 6 Major Haplotype Blocks in the HNF4A Gene.

Linkage disequilibrium plot in the HNF4A region is displayed. Haplotype analysis was carried out using HAPLOVIEW Software version 3.11.
Table 5.
Distribution of Haplotype Frequencies for Controls and Crohn’s Disease Subjects in Discovery and Combined Cohorts
| Haplotype | Frequency Controls | Frequency CD | P Value |
|---|---|---|---|
|
Discovery Cohort
| |||
| Block 1 | |||
| GCCCGCTC | 0.616 | 0.585 | 0.193 |
| CGTCACTC | 0.143 | 0.195 | 0.004* |
| GCCGGTCA | 0.145 | 0.134 | 0.532 |
| GCCCGTCA | 0.075 | 0.062 | 0.265 |
| Block 2 | |||
| AG | 0.373 | 0.356 | 0.469 |
| CG | 0.314 | 0.343 | 0.193 |
| AC | 0.313 | 0.300 | 0.572 |
| Block 3 | |||
| TTG | 0.522 | 0.531 | 0.727 |
| CGA | 0.257 | 0.249 | 0.700 |
| TGA | 0.204 | 0.211 | 0.732 |
| Block 4 | |||
| GT | 0.606 | 0.603 | 0.897 |
| GC | 0.300 | 0.299 | 0.972 |
| AC | 0.091 | 0.097 | 0.681 |
| Block 5 | |||
| CC | 0.471 | 0.457 | 0.568 |
| CT | 0.304 | 0.306 | 0.909 |
| TT | 0.224 | 0.233 | 0.645 |
| Block 6 | |||
| GGC | 0.405 | 0.394 | 0.640 |
| GGT | 0.362 | 0.366 | 0.859 |
| AAT | 0.224 | 0.230 | 0.760 |
|
| |||
|
Replication Cohort
| |||
| Block 1 | |||
| GCCCGCTC | 0.593 | 0.608 | 0.453 |
| CGTCACTC | 0.130 | 0.171 | 0.004* |
| GCCGGTCA | 0.140 | 0.143 | 0.869 |
| GCCCGTCA | 0.089 | 0.071 | 0.128 |
|
| |||
|
Combined Cohorts
| |||
| Block 1 | |||
| GCCCGCTC | 0.600 | 0.595 | 0.755 |
| CGTCACTC | 0.136 | 0.185 | 7.755 × 10⁻⁶** |
| GCCGGTCA | 0.142 | 0.139 | 0.775 |
| GCCCGTCA | 0.083 | 0.067 | 0.045* |
Haplotype analyses were performed on the SNPs within each block of high linkage disequilibrium. Haplotype analysis was carried out using HAPLOVIEW Software, version 3.11, with haplotype blocks created using the confidence interval feature. The association of specific haplotypes within blocks with the outcome was examined and P values were estimated. CD= Crohn’s disease.
P<0.05;
P<2.09 × 10⁻⁴ after correcting for 27 haplotype comparisons.
Oxidant and Antioxidant Status
To assess the oxidative status of CD patients in comparison to controls and according to their rs1884613 genotype, plasma malondialdehyde (MDA) was measured. Results show that MDA levels were significantly elevated in CD subjects compared to controls (P<0.0001) (Figure 3A), but no significant difference was noted when MDA levels were separated according to rs18834613 genotype (Figure 3B).
Figure 3. Oxidative Stress Status in Control and Crohn’s Disease Subjects.
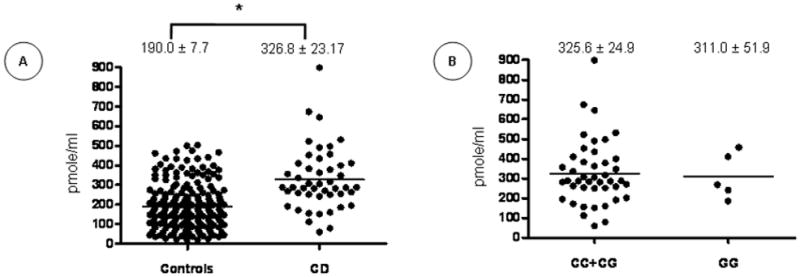
Plasma malondialdehyde (MDA) was assessed in Crohn’s Disease (CD) patients compared to healthy controls (A) and according to their rs1884613 genotype (B). Plots indicate individual MDA levels and means ± SEM are specified. *P<0.0001 vs. controls.
Subjects’ antioxidant profile was assessed by measuring plasma retinol, β-carotene, γ-tocopherol and α-tocopherol. Compared to controls, the plasma concentrations of β-carotene were reduced in CD (P<0.0001) (Figure 4A), while retinol (Figure 4B) and γ-tocopherol (Figure 4C) levels were elevated (P<0.0001 and P<0.001, respectively). No significant difference was observed in α-tocopherol levels (Figure 4D). Figure 5 shows the differences in vitamin levels according to the rs1884613 genotype in CD subjects. A tendency of lower levels of retinol, γ-tocopherol and α-tocopherol was observed in the homozygote carriers of the rare allele (G), but the differences did not reach statistical significance. Importantly, a large inter-individual disparity was observed in these experiments.
Figure 4. Antioxidant Vitamins Status in Control and Crohn’s Disease Subjects.
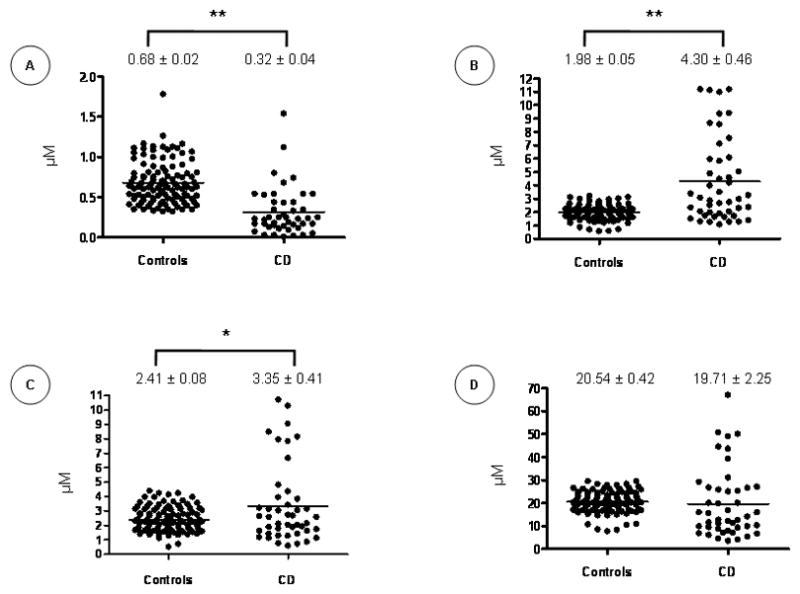
Plasma levels of β-carotene (A), retinol (B), γ-tocopherol (C) and α-tocopherol (D) were quantified in controls and Crohn’s Disease (CD) patients. Plots indicate individual vitamin levels and means ± SEM are specified. *P<0.0011; **P<0.0001 vs. controls.
Figure 5. Antioxidant Vitamins Status According to rs1884613 Genotype.
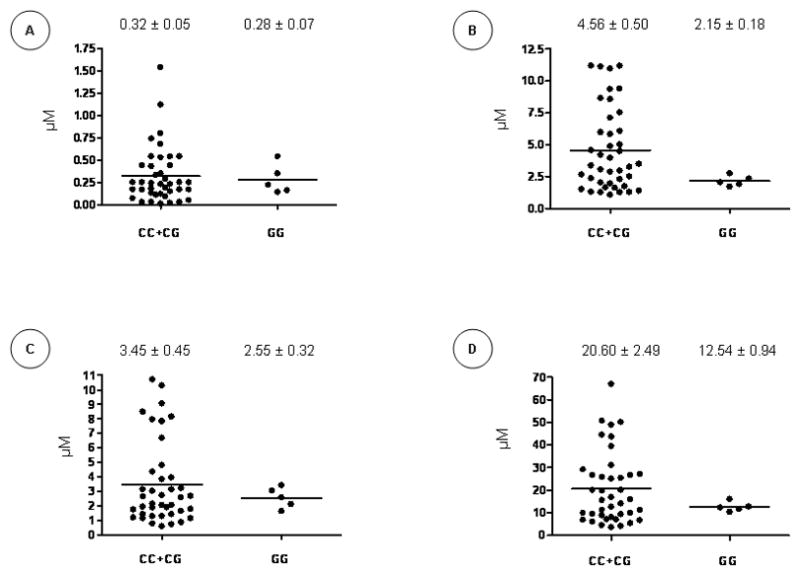
Plasma levels of β-carotene (A), retinol (B), γ-tocopherol (C) and α-tocopherol (D) were compared among the rs1884613 genotypes. Plots indicate individual vitamin levels and means ± SEM are specified.
DISCUSSION
This is the first study reporting an association between genetic variants in the HNF4A gene and risk for CD. In a discovery study, we found that 6 HNF4A SNPs were significantly associated with CD. In a replication study performed on distinct cohorts of CD subjects and controls, one SNP (rs1884613) remained significantly associated with CD. Combining both cohorts, the single SNP analysis demonstrated significant associations for 3 of the 6 SNPs (rs1884613, rs1884614, rs2144908), due to the gain in power. The associations for rs1884613 and rs1884614 remained significant after correcting for multiple testing. Moreover, haplotype analyses underlined the association between CD and a 8-marker haplotype containing the SNPs found to be associated in the single SNP analysis.
In line with our findings, recent studies have provided evidence for a role of HNF4α in inflammation (33). Our group has previously explored the effects of HNF4α knockdown gene expression in an intestinal epithelial cell model and found that reduced HNF4α gene and protein expression amplified lipid peroxidation, reduced cellular antioxidant defences and increased cellular vulnerability to iron-ascorbate-generating oxidative stress (34). In line with our observations, HNF4α expression was significantly decreased in patients with IBD (39). Furthermore, dextran sulfate sodium-induced colitis was more severe in the intestine-specific HNF4α knockout mouse model that was characterized by an increase in pro-inflammatory cytokines (39). Darsigny and collaborators reported that loss of HNF4α affects colonic ion transport and causes chronic inflammation resembling IBD in a knockout mouse model (33). Finally, a crosstalk between HNF4α and NF-κB was reported (40, 41), supporting its role in inflammation.
We believe our findings are of high interest in view of the association between the HNF4A region and the risk of UC revealed in a whole genome study (35). This association was seen at rs6017342, which maps 5 kb distal to the 3′ untranslated region of the HNF4A gene, within a recombination hot spot. However, rs6017342 was not in high LD with the identified variant associated with CD in our study (rs1884613). In fact, none of the SNPs associated with CD in the discovery study were in strong LD with rs6017342, which can be explained by the fact that rs60317342 is located within a recombination hot spot. In addition, in the GWAS United Kingdom (UK) cohort, the rs60317342 locus did not show any association to CD, suggesting that different signals on the HNF4A gene are associated with different types of IBD. Hence, it is possible that the associations are independent and it is also probable that they may even be linked to different genes within the 12q12-13 region. Cryptic differences in the genetic structure of the French-Canadian “founder” population, compared to the UK population used in the GWAS, could also explain the different associations in the HNF4A locus. Moreover, it has been put forward that some genes/loci may be specific to early onset CD patients (42) and that new variants in many genes could have been missed by GWAS in this specific population (43).
Under the control of its 2 promoters, the HNF4A gene encodes a total of 9 isoforms (44) with various 3′ truncations. The liver-specific P1 promoter drives the expression of transcripts HNF4α1 to 6 which include exons 1A and 2–10 (HNF4α1 to 3) or exons 1A, 1B and 2–10 (HNF4α4 to 6). Transcripts HNF4α7 to 9 are expressed from the pancreatic P2 promoter located approximately 46 kb upstream of the HNF4α transcription start and exhibit splicing of the upstream exon 1D to exon 2, without the inclusion of sequences from either exon 1A or 1B (45). The observed genetic variations in our study suggest a contribution of the P2 promoter in HNF4α implication in regulating inflammatory processes.
In our study, the P2 promoter variant rs1884613 was the only one that was replicated in a second independent cohort of cases and controls. This P2-promoter genetic variant has been associated with type 2 diabetes mellitus (T2DM) in several studies, pointing out to HNF4α’s potential role in inflammation. In fact, rs1884613 was found to be associated with T2DM in Ashkenazi (46), Mexican American (47), and Scandinavian populations (48). Moreover, a link between rs1884613 and insulin resistance was noted (49). However, the association with T2DM was not replicated in UK (46) and a Finnish population (36), nor in a broader meta-analysis with additional populations (50).
The identification of HNF4α, which has been associated with MODY1 and T2DM, as a CD susceptibility gene is in line with the recent concept of shared genetic determinants for clinically distinct disorders (51). GWAS have identified several genes conferring susceptibility to multiple conditions such as CD, ankylosing spondylitis, rheumatoid arthritis, systemic lupus erythematosus and type I diabetes (52). It has been suggested that there may be a general set of susceptibility genes for autoimmunity, which are modulated by disease-specific genes, as well as the host’s human leukocyte antigen status. A specific combination of polymorphisms, combined with environmental factors, could determine the type of disease developed by a subject (53).
To predict the effect of the P2 promoter SNP rs1884613, we investigated the impact on putative transcription factor binding sites. Our in silico analyses show that variations in that SNP could theoretically modify the binding of the ras-responsive element binding protein 1 (RREB1), a transcription factor involved in DNA repair by modulating p53 transcription (54) and associated with immune tolerance (55). Thus, studying the impact of rs1884613 and other P2 promoter SNPs on HNF4α gene expression and function might help understand the role of this gene in inflammation and IBD.
During liver development, HNF4α regulates the expression of cell adhesion proteins (56). It also provokes the expression of tight-junction adhesion molecules and the modulation of subcellular distribution of junction and cell polarity proteins, resulting in junction formation and epithelial polarization in embryonal carcinoma cells (57). Moreover, using an adult mouse model lacking HNF4α in the intestinal epithelium, HNF4α was shown to play a pivotal role in the homeostasis of the intestinal epithelium, in the epithelial cell architecture, and in intestinal barrier function (58). These results underline the potential role of HNF4α in epithelial integrity in IBD physiopathology.
In an attempt to explore the mechanisms behind the rs1884613-(G/G) haplotype, we measured oxidative stress biological markers in controls and CD subjects. CD patients displayed higher oxidative stress status, as documented by the elevated MDA levels and the reduced β-carotene. Yet, the average plasma γ-tocopherol was increased in subjects with CD; such elevation in CD was previously described in the literature (59). Although no significant difference was observed in MDA and vitamin levels in the case of rs1884613 genotype, an apparent trend was noted for the levels of retinol, γ-tocopherol and α-tocopherol when compared to CC and CG genotypes. Discriminating patients according to C-reactive protein levels or disease activity could not contribute to explain the differences in antioxidant levels (data not shown). Given the limited number of patients with the rare genotype available in our study, larger cohorts are needed to focus on this aspect.
In conclusion, our results suggest that the HNF4A locus may be a common genetic determinant of CD, but its relative contribution may differ between populations. Further replication of these data in international IBD cohorts is necessary to estimate the effect of the HNF4α polymorphisms on risks for CD and UC. Functional studies are also necessary to investigate the impact of the aforementioned genetic variants on HNF4α protein functions.
MATERIAL AND METHODS
Subjects
For the discovery cohort, patients were recruited from the IBD clinics of tertiary pediatric and adult hospitals in Montreal (CHU Sainte-Justine, Montreal General, Royal Victoria and Montreal Children’s Hospitals) between June 30, 2008 and January 20, 2010. For the replication cohort, patients were those diagnosed and followed at the pediatric gastroenterology clinics of 3 hospitals across Canada: CHU Sainte-Justine, Montreal; the British Columbia’s Children’s Hospital, Vancouver; and the Children’s Hospital of Eastern Ontario, Ottawa. These patients were recruited from January 1st, 2003 to June 30, 2011. The diagnosis of CD was confirmed based on standard clinical, endoscopic, radiologic and histopathologic criteria (60, 61). Clinical and demographic information acquired included age at diagnosis, gender, and ethnicity. Disease location and clinical phenotype were classified according to World Gastroenterology Organization’s Montreal classification (L1, ileum; L2, colon; L3, ileocolon; L4, upper GI tract; B1, non-stricturing and non-penetrating; B2, structuring; B3, penetrating; p, perianal modifier) (38). The designation of French Canadian, Jewish or other ethnicity was based on self-report. Self-identified race/ethnicity has previously been shown to highly correlate with genetic cluster categories (62). For all patients, blood or saliva was collected for DNA analysis. Controls were chosen from the 1999 Quebec Child and Adolescent Health and Social Survey, a school-based survey of youth aged 9, 13 and 16 years providing DNA samples (63). The institutional Ethics Review Boards of all centers approved the study and informed consent was acquired from all participating subjects.
DNA Extraction
Genomic DNA was prepared from white blood cells, total blood or saliva with the Puregene® DNA Isolation kit (Gentra Systems, Inc) using methods described by the manufacturer.
DNA Variants Detection by Direct Sequencing
To identify SNPs present in our population, we first sequenced the HNF4A gene in a total of 40 French Canadian patients diagnosed with childhood-onset IBD (20 CD and 20 UC patients). The sequencing targeted the coding regions, the P1 promoter region (2.5 kb upstream exon 1a) and other regions containing SNPs previously associated with the risk of developing diseases, such as T2D and dyslipidemia (26, 36, 37, 50, 64, 65). In total, 30 fragments were sequenced. Genomic DNA (2 ng) was amplified in a total volume of 50 μl volume using 5 μl PCR Buffer (10 ×), 1.5 μl MgCl2 (50 mM), 2 μl dNTPs (2.5 mM), 0.4 μM of each corresponding primer (25 μM) and 1.0 units of Platinum™ Taq DNA Polymerase (Invitrogen). The PCR amplifications were performed using a GeneAmp PCR System 9700 (Applied Biosystems) under the following profile: 35 cycles of amplification were used at 95 °C for 30 s, 58 °C for 30 s and 72 °C for 45 s. Amplicons were verified on standard ethidium bromide stained 1.5% agarose gel. The specific primers for each fragment and the amplicon size are available upon request. Amplified fragments were sent to the McGill University Genome Quebec Innovation Center in Montreal for sequencing using Applied Biosystem’s 3730xl DNA Analyzer technology. Complete sequences were aligned, assembled and compared using the MultiAlign software (66). Visual inspection of chromatograms was used for identification of each candidate SNP.
Genotyping
Discovery Cohort
Based on sequencing results, identified SNPs were genotyped using the Luminex xMAP/Autoplex Analyser CS1000 system (Perkin Elmer, Waltham, MA). The 27 selected SNPs were amplified in a single multiplex assay and hybridized to Luminex MicroPlex® –xTAG Microspheres (67) for genotyping using allele-specific primer extension. Amplification and reaction conditions are available upon request. Allele calls were assessed and compiled using the Automatic Luminex Genotyping software (68). For quality control purposes, genotyping of a systematic random sample of 20% of the specimens was repeated.
Replication Cohort
Replication genotyping was performed on the SNPs significantly associated with CD in the discovery study (in the single SNP and haplotype analyses). In total, 10 SNPs were genotyped using Sequenom-based primer-extension methods. These methods are designed for high-throughput SNP genotyping. The platform has a high assay conversion rate (85%), high genotyping success rate (95%), and minimal error rates (0.5%–1%). Genotyping was carried out at the McGill University and Genome Quebec Innovation Center in Montreal.
Biological Studies
Blood Samples
In order to examine the levels of plasma MDA and antioxidant vitamins, blood samples were collected in tubes containing 1 g EDTA/l. Plasma was separated immediately by centrifugation (700 g for 20 min at 4°C). CD patients were characterized according to their rs1884613 genotype.
Malondialdehyde
The amount of free MDA in plasma was determined by HPLC in 48 CD patients and 213 healthy controls using an improved method previously described by our unit (69).
Antioxidant Vitamins
The antioxidant profile was determined by measuring antioxidant vitamin levels (βcarotene, retinol, γ-tocopherol, α-tocopherol) in 45 CD patients and 112 healthy controls using an improved method previously described by our unit (70).
In Silico Analysis
To explore the potential interaction between transcription factors and the HNF4α P2 promoter polymorphism rs1884613, we performed in silico analyses using the Genomatix MatInspector program (Genomatix Software GmbH, Munich, Germany) with a standard (0.75) core similarity. Transcription factor recognition site sequences were identified in the HNF4A gene region containing the SNP.
Statistical Analysis
Potential genotyping errors were assessed using chi-square (χ2) tests, which evaluate the deviation of each SNP from Hardy-Weinberg equilibrium. Allelic association for individual SNPs was carried out using logistic regression by fitting an additive model. Genotype and allele frequencies were compared between cases and controls using χ2 tests and Fisher’s exact tests where appropriate. Odds ratios (OR) and 95% confidence intervals (CI) were estimated. In addition to single SNP analysis, haplotype analysis was carried out. LD blocks were defined using the “single gamete rule” implemented in the HAPLOVIEW Software, version 3.11 (71). The association of specific haplotypes within blocks with the outcome was examined and P values were estimated. For the biological studies, statistical differences were assessed by Anova and Student’s two-tailed t test. P values <0.05 after correction for multiple hypotheses were considered significant in the genetic analysis based on the combined cohorts. Adjusting for multiple comparisons was made using Bonferroni methods separately for the single SNP and haplotype analysis for the combined analysis. For the single SNP analysis, we tested 24 SNPs in the discovery cohort, 10 in the replication cohort and 6 in the combined cohort, we therefore accounted for 40 comparisons. As for the haplotype analysis, we tested 19 haplotypes in the discovery cohort, 4 in the replication cohort and 4 in the combined cohort, thus we accounted for 27 comparisons.
Power Estimations
Based on findings of the discovery cohort, the power required to replicate associations in an independent cohort was made after considering the observed allele frequencies and odds ratios, assuming an alpha level of significance of 0.05, an available case sample of approximately 450 cases and a control population of approximately 1,300 subjects. Based on this pre-defined sample size, it was estimated that the replication cohort would have >80% power to replicate associations noted in the discovery cohort. Power analysis was carried out using QUANTO Software, version 1.2.4 (http://hydra.usc.edu/gxe).
Acknowledgments
This study was supported by the Canadian Institutes of Health Research Team Grant (CTP-82942; ES, FB, FPG, JFB, DM, EL), the J.A. DeSève Research Chair in Nutrition (EL), the Canada Research Chair in Immune Mediated Gastrointestinal Disorders (ES), the Canadian Institutes of Health Research Fellowship Award and The Richard and Edith Strauss Postdoctoral Fellowships Award in Medicine, McGill University (VM). A preliminary version of this study, presented by VM, was awarded with a Presidential Poster Award at the American College of Gastroenterology 2010 Annual Scientific Meeting. The authors thank Mrs Schohraya Spahis for her technical assistance.
Footnotes
CONFLICT OF INTEREST
The authors declare that they have no competing interests.
References
- 1.Bernstein CN, Wajda A, Svenson LW, MacKenzie A, Koehoorn M, Jackson M, et al. The epidemiology of inflammatory bowel disease in Canada: a population-based study. Am J Gastroenterol. 2006;101(7):1559–1568. doi: 10.1111/j.1572-0241.2006.00603.x. [DOI] [PubMed] [Google Scholar]
- 2.Kappelman MD, Rifas-Shiman SL, Kleinman K, Ollendorf D, Bousvaros A, Grand RJ, et al. The prevalence and geographic distribution of Crohn’s disease and ulcerative colitis in the United States. Clin Gastroenterol Hepatol. 2007;5(12):1424–1429. doi: 10.1016/j.cgh.2007.07.012. [DOI] [PubMed] [Google Scholar]
- 3.Rioux JD, Xavier RJ, Taylor KD, Silverberg MS, Goyette P, Huett A, et al. Genome-wide association study identifies new susceptibility loci for Crohn disease and implicates autophagy in disease pathogenesis. Nat Genet. 2007;39(5):596–604. doi: 10.1038/ng2032. [DOI] [PMC free article] [PubMed] [Google Scholar]
- 4.Parkes M, Barrett JC, Prescott NJ, Tremelling M, Anderson CA, Fisher SA, et al. Sequence variants in the autophagy gene IRGM and multiple other replicating loci contribute to Crohn’s disease susceptibility. Nat Genet. 2007;39(7):830–832. doi: 10.1038/ng2061. [DOI] [PMC free article] [PubMed] [Google Scholar]
- 5.Prescott NJ, Fisher SA, Franke A, Hampe J, Onnie CM, Soars D, et al. A nonsynonymous SNP in ATG16L1 predisposes to ileal Crohn’s disease and is independent of CARD15 and IBD5. Gastroenterology. 2007;132(5):1665–1671. doi: 10.1053/j.gastro.2007.03.034. [DOI] [PubMed] [Google Scholar]
- 6.Amre DK, Mack D, Israel D, Morgan K, Lambrette P, Law L, et al. Association between genetic variants in the IL-23R gene and early-onset Crohn’s disease: results from a case-control and family-based study among Canadian children. Am J Gastroenterol. 2008;103(3):615–620. doi: 10.1111/j.1572-0241.2007.01661.x. [DOI] [PubMed] [Google Scholar]
- 7.Franke A, McGovern DP, Barrett JC, Wang K, Radford-Smith GL, Ahmad T, et al. Genome-wide meta-analysis increases to 71 the number of confirmed Crohn’s disease susceptibility loci. Nat Genet. 2010;42(12):1118–1125. doi: 10.1038/ng.717. [DOI] [PMC free article] [PubMed] [Google Scholar]
- 8.Rivas MA, Beaudoin M, Gardet A, Stevens C, Sharma Y, Zhang CK, et al. Deep resequencing of GWAS loci identifies independent rare variants associated with inflammatory bowel disease. Nat Genet. 2011;43(11):1066–1073. doi: 10.1038/ng.952. [DOI] [PMC free article] [PubMed] [Google Scholar]
- 9.Sladek FM, Zhong WM, Lai E, Darnell JE., Jr Liver-enriched transcription factor HNF-4 is a novel member of the steroid hormone receptor superfamily. Genes Dev. 1990;4(12B):2353–2365. doi: 10.1101/gad.4.12b.2353. [DOI] [PubMed] [Google Scholar]
- 10.Taraviras S, Monaghan AP, Schutz G, Kelsey G. Characterization of the mouse HNF-4 gene and its expression during mouse embryogenesis. Mech Dev. 1994;48(2):67–79. doi: 10.1016/0925-4773(94)90017-5. [DOI] [PubMed] [Google Scholar]
- 11.Miquerol L, Lopez S, Cartier N, Tulliez M, Raymondjean M, Kahn A. Expression of the L-type pyruvate kinase gene and the hepatocyte nuclear factor 4 transcription factor in exocrine and endocrine pancreas. J Biol Chem. 1994;269(12):8944–8951. [PubMed] [Google Scholar]
- 12.Stoffel M, Duncan SA. The maturity-onset diabetes of the young (MODY1) transcription factor HNF4alpha regulates expression of genes required for glucose transport and metabolism. Proc Natl Acad Sci U S A. 1997;94(24):13209–13214. doi: 10.1073/pnas.94.24.13209. [DOI] [PMC free article] [PubMed] [Google Scholar]
- 13.Chien CC, Yen BL, Lee FK, Lai TH, Chen YC, Chan SH, et al. In vitro differentiation of human placenta-derived multipotent cells into hepatocyte-like cells. Stem Cells. 2006;24(7):1759–1768. doi: 10.1634/stemcells.2005-0521. [DOI] [PubMed] [Google Scholar]
- 14.Fiegel HC, Lioznov MV, Cortes-Dericks L, Lange C, Kluth D, Fehse B, et al. Liver-specific gene expression in cultured human hematopoietic stem cells. Stem Cells. 2003;21(1):98–104. doi: 10.1634/stemcells.21-1-98. [DOI] [PubMed] [Google Scholar]
- 15.Lian G, Wang C, Teng C, Zhang C, Du L, Zhong Q, et al. Failure of hepatocyte marker-expressing hematopoietic progenitor cells to efficiently convert into hepatocytes in vitro. Exp Hematol. 2006;34(3):348–358. doi: 10.1016/j.exphem.2005.12.004. [DOI] [PubMed] [Google Scholar]
- 16.Parviz F, Matullo C, Garrison WD, Savatski L, Adamson JW, Ning G, et al. Hepatocyte nuclear factor 4alpha controls the development of a hepatic epithelium and liver morphogenesis. Nat Genet. 2003;34(3):292–296. doi: 10.1038/ng1175. [DOI] [PubMed] [Google Scholar]
- 17.Sladek FM. Orphan receptor HNF-4 and liver-specific gene expression. Receptor. 1993;3(3):223–232. [PubMed] [Google Scholar]
- 18.Boj SF, Parrizas M, Maestro MA, Ferrer J. A transcription factor regulatory circuit in differentiated pancreatic cells. Proc Natl Acad Sci U S A. 2001;98(25):14481–14486. doi: 10.1073/pnas.241349398. [DOI] [PMC free article] [PubMed] [Google Scholar]
- 19.Thomas H, Jaschkowitz K, Bulman M, Frayling TM, Mitchell SM, Roosen S, et al. A distant upstream promoter of the HNF-4alpha gene connects the transcription factors involved in maturity-onset diabetes of the young. Hum Mol Genet. 2001;10(19):2089–2097. doi: 10.1093/hmg/10.19.2089. [DOI] [PubMed] [Google Scholar]
- 20.Briancon N, Weiss MC. In vivo role of the HNF4alpha AF-1 activation domain revealed by exon swapping. EMBO J. 2006;25(6):1253–1262. doi: 10.1038/sj.emboj.7601021. [DOI] [PMC free article] [PubMed] [Google Scholar]
- 21.Rhee J, Inoue Y, Yoon JC, Puigserver P, Fan M, Gonzalez FJ, et al. Regulation of hepatic fasting response by PPARgamma coactivator-1alpha (PGC-1): requirement for hepatocyte nuclear factor 4alpha in gluconeogenesis. Proc Natl Acad Sci U S A. 2003;100(7):4012–4017. doi: 10.1073/pnas.0730870100. [DOI] [PMC free article] [PubMed] [Google Scholar]
- 22.Wang H, Maechler P, Antinozzi PA, Hagenfeldt KA, Wollheim CB. Hepatocyte nuclear factor 4alpha regulates the expression of pancreatic beta -cell genes implicated in glucose metabolism and nutrient-induced insulin secretion. J Biol Chem. 2000;275(46):35953–35959. doi: 10.1074/jbc.M006612200. [DOI] [PubMed] [Google Scholar]
- 23.Bartoov-Shifman R, Hertz R, Wang H, Wollheim CB, Bar-Tana J, Walker MD. Activation of the insulin gene promoter through a direct effect of hepatocyte nuclear factor 4 alpha. J Biol Chem. 2002;277(29):25914–25919. doi: 10.1074/jbc.M201582200. [DOI] [PubMed] [Google Scholar]
- 24.Tegude H, Schnabel A, Zanger UM, Klein K, Eichelbaum M, Burk O. Molecular mechanism of basal CYP3A4 regulation by hepatocyte nuclear factor 4alpha: evidence for direct regulation in the intestine. Drug Metab Dispos. 2007;35(6):946–954. doi: 10.1124/dmd.106.013565. [DOI] [PubMed] [Google Scholar]
- 25.Fajans SS, Bell GI, Polonsky KS. Molecular mechanisms and clinical pathophysiology of maturity-onset diabetes of the young. N Engl J Med. 2001;345(13):971–980. doi: 10.1056/NEJMra002168. [DOI] [PubMed] [Google Scholar]
- 26.Bagwell AM, Bento JL, Mychaleckyj JC, Freedman BI, Langefeld CD, Bowden DW. Genetic analysis of HNF4A polymorphisms in Caucasian-American type 2 diabetes. Diabetes. 2005;54(4):1185–1190. doi: 10.2337/diabetes.54.4.1185. [DOI] [PubMed] [Google Scholar]
- 27.Hansen SK, Rose CS, Glumer C, Drivsholm T, Borch-Johnsen K, Jorgensen T, et al. Variation near the hepatocyte nuclear factor (HNF)-4alpha gene associates with type 2 diabetes in the Danish population. Diabetologia. 2005;48(3):452–458. doi: 10.1007/s00125-005-1671-0. [DOI] [PubMed] [Google Scholar]
- 28.Vaxillaire M, Dina C, Lobbens S, Dechaume A, Vasseur-Delannoy V, Helbecque N, et al. Effect of common polymorphisms in the HNF4alpha promoter on susceptibility to type 2 diabetes in the French Caucasian population. Diabetologia. 2005;48(3):440–444. doi: 10.1007/s00125-004-1665-3. [DOI] [PubMed] [Google Scholar]
- 29.Garrison WD, Battle MA, Yang C, Kaestner KH, Sladek FM, Duncan SA. Hepatocyte nuclear factor 4alpha is essential for embryonic development of the mouse colon. Gastroenterology. 2006;130(4):1207–1220. doi: 10.1053/j.gastro.2006.01.003. [DOI] [PMC free article] [PubMed] [Google Scholar]
- 30.Frochot V, Alqub M, Cattin AL, Carriere V, Houllier A, Baraille F, et al. The transcription factor HNF-4alpha: a key factor of the intestinal uptake of fatty acids in mouse. Am J Physiol Gastrointest Liver Physiol. 2012 doi: 10.1152/ajpgi.00329.2011. [DOI] [PubMed] [Google Scholar]
- 31.Lussier CR, Babeu JP, Auclair BA, Perreault N, Boudreau F. Hepatocyte nuclear factor-4alpha promotes differentiation of intestinal epithelial cells in a coculture system. Am J Physiol Gastrointest Liver Physiol. 2008;294(2):G418–G428. doi: 10.1152/ajpgi.00418.2007. [DOI] [PubMed] [Google Scholar]
- 32.Babeu JP, Darsigny M, Lussier CR, Boudreau F. Hepatocyte nuclear factor 4alpha contributes to an intestinal epithelial phenotype in vitro and plays a partial role in mouse intestinal epithelium differentiation. Am J Physiol Gastrointest Liver Physiol. 2009;297(1):G124–G134. doi: 10.1152/ajpgi.90690.2008. [DOI] [PubMed] [Google Scholar]
- 33.Darsigny M, Babeu JP, Dupuis AA, Furth EE, Seidman EG, Levy E, et al. Loss of hepatocyte-nuclear-factor-4alpha affects colonic ion transport and causes chronic inflammation resembling inflammatory bowel disease in mice. PLoS One. 2009;4(10):e7609. doi: 10.1371/journal.pone.0007609. [DOI] [PMC free article] [PubMed] [Google Scholar]
- 34.Marcil V, Seidman E, Sinnett D, Boudreau F, Gendron FP, Beaulieu JF, et al. Modification in oxidative stress, inflammation and lipoprotein assembly in response to hepatocyte nuclear factor 4 alpha knockdown in intestinal epithelial cells. J Biol Chem. 2010 doi: 10.1074/jbc.M110.155358. [DOI] [PMC free article] [PubMed] [Google Scholar]
- 35.Barrett JC, Lee JC, Lees CW, Prescott NJ, Anderson CA, Phillips A, et al. Genome-wide association study of ulcerative colitis identifies three new susceptibility loci, including the HNF4A region. Nat Genet. 2009;41(12):1330–1334. doi: 10.1038/ng.483. [DOI] [PMC free article] [PubMed] [Google Scholar]
- 36.Bonnycastle LL, Willer CJ, Conneely KN, Jackson AU, Burrill CP, Watanabe RM, et al. Common variants in maturity-onset diabetes of the young genes contribute to risk of type 2 diabetes in Finns. Diabetes. 2006;55(9):2534–2540. doi: 10.2337/db06-0178. [DOI] [PubMed] [Google Scholar]
- 37.Weissglas-Volkov D, Huertas-Vazquez A, Suviolahti E, Lee J, Plaisier C, Canizales-Quinteros S, et al. Common hepatic nuclear factor-4alpha variants are associated with high serum lipid levels and the metabolic syndrome. Diabetes. 2006;55(7):1970–1977. doi: 10.2337/db06-0035. [DOI] [PubMed] [Google Scholar]
- 38.Silverberg MS, Satsangi J, Ahmad T, Arnott ID, Bernstein CN, Brant SR, et al. Toward an integrated clinical, molecular and serological classification of inflammatory bowel disease: Report of a Working Party of the 2005 Montreal World Congress of Gastroenterology. Can J Gastroenterol. 2005;19(Suppl A):5–36. doi: 10.1155/2005/269076. [DOI] [PubMed] [Google Scholar]
- 39.Ahn SH, Shah YM, Inoue J, Morimura K, Kim I, Yim S, et al. Hepatocyte nuclear factor 4alpha in the intestinal epithelial cells protects against inflammatory bowel disease. Inflamm Bowel Dis. 2008;14(7):908–920. doi: 10.1002/ibd.20413. [DOI] [PMC free article] [PubMed] [Google Scholar]
- 40.De BK, Vanden Berghe W, Haegeman G. Cross-talk between nuclear receptors and nuclear factor kappaB. Oncogene. 2006;25(51):6868–6886. doi: 10.1038/sj.onc.1209935. [DOI] [PubMed] [Google Scholar]
- 41.Nikolaidou-Neokosmidou V, Zannis VI, Kardassis D. Inhibition of hepatocyte nuclear factor 4 transcriptional activity by the nuclear factor kappaB pathway. Biochem J. 2006;398(3):439–450. doi: 10.1042/BJ20060169. [DOI] [PMC free article] [PubMed] [Google Scholar]
- 42.Amre DK, Mack DR, Morgan K, Israel D, Deslandres C, Seidman EG, et al. Association between genome-wide association studies reported SNPs and pediatric-onset Crohn’s disease in Canadian children. Hum Genet. 2010;128(2):131–135. doi: 10.1007/s00439-010-0835-2. [DOI] [PubMed] [Google Scholar]
- 43.Bianco AM, Zanin V, Girardelli M, Magnolato A, Martellossi S, Tommasini A, et al. A common genetic background could explain early-onset Crohn’s disease. Med Hypotheses. 2012;78(4):520–522. doi: 10.1016/j.mehy.2012.01.023. [DOI] [PubMed] [Google Scholar]
- 44.Sladek FM, Seidel SD. Hepatocyte nuclear factor 4á. In: Burris TP, McCabe E, editors. Nuclear Receptors and Genetic Diseases. London, UK: Academic Press; 2001. pp. 309–61. [Google Scholar]
- 45.Ellard S, Colclough K. Mutations in the genes encoding the transcription factors hepatocyte nuclear factor 1 alpha (HNF1A) and 4 alpha (HNF4A) in maturity-onset diabetes of the young. Hum Mutat. 2006;27(9):854–869. doi: 10.1002/humu.20357. [DOI] [PubMed] [Google Scholar]
- 46.Barroso I, Luan J, Wheeler E, Whittaker P, Wasson J, Zeggini E, et al. Population-specific risk of type 2 diabetes conferred by HNF4A P2 promoter variants: a lesson for replication studies. Diabetes. 2008;57(11):3161–3165. doi: 10.2337/db08-0719. [DOI] [PMC free article] [PubMed] [Google Scholar]
- 47.Lehman DM, Richardson DK, Jenkinson CP, Hunt KJ, Dyer TD, Leach RJ, et al. P2 promoter variants of the hepatocyte nuclear factor 4alpha gene are associated with type 2 diabetes in Mexican Americans. Diabetes. 2007;56(2):513–517. doi: 10.2337/db06-0881. [DOI] [PubMed] [Google Scholar]
- 48.Johansson S, Raeder H, Eide SA, Midthjell K, Hveem K, Sovik O, et al. Studies in 3,523 Norwegians and meta-analysis in 11,571 subjects indicate that variants in the hepatocyte nuclear factor 4 alpha (HNF4A) P2 region are associated with type 2 diabetes in Scandinavians. Diabetes. 2007;56(12):3112–3117. doi: 10.2337/db07-0513. [DOI] [PubMed] [Google Scholar]
- 49.Saif-Ali R, Harun R, Al-Jassabi S, Wan Ngah WZ. Hepatocyte nuclear factor 4 alpha P2 promoter variants associate with insulin resistance. Acta Biochim Pol. 2011;58(2):179–186. [PubMed] [Google Scholar]
- 50.Winckler W, Graham RR, de Bakker PI, Sun M, Almgren P, Tuomi T, et al. Association testing of variants in the hepatocyte nuclear factor 4alpha gene with risk of type 2 diabetes in 7,883 people. Diabetes. 2005;54(3):886–892. doi: 10.2337/diabetes.54.3.886. [DOI] [PubMed] [Google Scholar]
- 51.Seldin MF, Amos CI. Shared susceptibility variations in autoimmune diseases: a brief perspective on common issues. Genes Immun. 2009;10(1):1–4. doi: 10.1038/gene.2008.92. [DOI] [PubMed] [Google Scholar]
- 52.Huang W, Wang P, Liu Z, Zhang L. Identifying disease associations via genome-wide association studies. BMC Bioinformatics. 2009;10(Suppl 1):S68. doi: 10.1186/1471-2105-10-S1-S68. [DOI] [PMC free article] [PubMed] [Google Scholar]
- 53.Eleftherohorinou H, Wright V, Hoggart C, Hartikainen AL, Jarvelin MR, Balding D, et al. Pathway analysis of GWAS provides new insights into genetic susceptibility to 3 inflammatory diseases. PLoS One. 2009;4(11):e8068. doi: 10.1371/journal.pone.0008068. [DOI] [PMC free article] [PubMed] [Google Scholar]
- 54.Liu H, Hew HC, Lu ZG, Yamaguchi T, Miki Y, Yoshida K. DNA damage signalling recruits RREB-1 to the p53 tumour suppressor promoter. Biochem J. 2009;422(3):543–551. doi: 10.1042/BJ20090342. [DOI] [PubMed] [Google Scholar]
- 55.Flajollet S, Poras I, Carosella ED, Moreau P. RREB-1 is a transcriptional repressor of HLA-G. J Immunol. 2009;183(11):6948–6959. doi: 10.4049/jimmunol.0902053. [DOI] [PubMed] [Google Scholar]
- 56.Battle MA, Konopka G, Parviz F, Gaggl AL, Yang C, Sladek FM, et al. Hepatocyte nuclear factor 4alpha orchestrates expression of cell adhesion proteins during the epithelial transformation of the developing liver. Proc Natl Acad Sci U S A. 2006;103(22):8419–8424. doi: 10.1073/pnas.0600246103. [DOI] [PMC free article] [PubMed] [Google Scholar]
- 57.Satohisa S, Chiba H, Osanai M, Ohno S, Kojima T, Saito T, et al. Behavior of tight-junction, adherens-junction and cell polarity proteins during HNF-4alpha-induced epithelial polarization. Exp Cell Res. 2005;310(1):66–78. doi: 10.1016/j.yexcr.2005.06.025. [DOI] [PubMed] [Google Scholar]
- 58.Cattin AL, Le BJ, Barreau F, Saint-Just S, Houllier A, Gonzalez FJ, et al. Hepatocyte nuclear factor 4alpha, a key factor for homeostasis, cell architecture, and barrier function of the adult intestinal epithelium. Mol Cell Biol. 2009;29(23):6294–6308. doi: 10.1128/MCB.00939-09. [DOI] [PMC free article] [PubMed] [Google Scholar]
- 59.Genser D, Kang MH, Vogelsang H, Elmadfa I. Status of lipidsoluble antioxidants and TRAP in patients with Crohn’s disease and healthy controls. Eur J Clin Nutr. 1999;53(9):675–679. doi: 10.1038/sj.ejcn.1600764. [DOI] [PubMed] [Google Scholar]
- 60.Lennard-Jones JE. Classification of inflammatory bowel disease. Scand J Gastroenterol Suppl. 1989;170:2–6. doi: 10.3109/00365528909091339. [DOI] [PubMed] [Google Scholar]
- 61.Sands BE. From symptom to diagnosis: clinical distinctions among various forms of intestinal inflammation. Gastroenterology. 2004;126(6):1518–1532. doi: 10.1053/j.gastro.2004.02.072. [DOI] [PubMed] [Google Scholar]
- 62.Tang H, Quertermous T, Rodriguez B, Kardia SL, Zhu X, Brown A, et al. Genetic structure, self-identified race/ethnicity, and confounding in case-control association studies. Am J Hum Genet. 2005;76(2):268–275. doi: 10.1086/427888. [DOI] [PMC free article] [PubMed] [Google Scholar]
- 63.Paradis G, Lambert M, O’Loughlin J, Lavallee C, Aubin J, Berthiaume P, et al. The Quebec Child and Adolescent Health and Social Survey: design and methods of a cardiovascular risk factor survey for youth. Can J Cardiol. 2003;19(5):523–531. [PubMed] [Google Scholar]
- 64.Andrulionyte L, Laukkanen O, Chiasson JL, Laakso M. Single nucleotide polymorphisms of the HNF4alpha gene are associated with the conversion to type 2 diabetes mellitus: the STOP-NIDDM trial. J Mol Med. 2006;84(8):701–708. doi: 10.1007/s00109-006-0063-3. [DOI] [PubMed] [Google Scholar]
- 65.Muller YL, Infante AM, Hanson RL, Love-Gregory L, Knowler W, Bogardus C, et al. Variants in hepatocyte nuclear factor 4alpha are modestly associated with type 2 diabetes in Pima Indians. Diabetes. 2005;54(10):3035–3039. doi: 10.2337/diabetes.54.10.3035. [DOI] [PMC free article] [PubMed] [Google Scholar]
- 66.Corpet F. Multiple sequence alignment with hierarchical clustering. Nucleic Acids Res. 1988;16(22):10881–10890. doi: 10.1093/nar/16.22.10881. [DOI] [PMC free article] [PubMed] [Google Scholar]
- 67.Koo SH, Ong TC, Chong KT, Lee CG, Chew FT, Lee EJ. Multiplexed genotyping of ABC transporter polymorphisms with the Bioplex suspension array. Biol Proced Online. 2007;9:27–42. doi: 10.1251/bpo131. [DOI] [PMC free article] [PubMed] [Google Scholar]
- 68.Bourgey M, Lariviere M, Richer C, Sinnett D. ALG: Automated Genotype Calling of Luminex Assays. PLoS One. 2011;6(5):e19368. doi: 10.1371/journal.pone.0019368. [DOI] [PMC free article] [PubMed] [Google Scholar]
- 69.Courtois F, Suc I, Garofalo C, Ledoux M, Seidman E, Levy E. Iron-ascorbate alters the efficiency of Caco-2 cells to assemble and secrete lipoproteins. Am J Physiol Gastrointest Liver Physiol. 2000;279(1):G12–G19. doi: 10.1152/ajpgi.2000.279.1.G12. [DOI] [PubMed] [Google Scholar]
- 70.Levy E, Rizwan Y, Thibault L, Lepage G, Brunet S, Bouthillier L, et al. Altered lipid profile, lipoprotein composition, and oxidant and antioxidant status in pediatric Crohn disease. Am J Clin Nutr. 2000;71(3):807–815. doi: 10.1093/ajcn/71.3.807. [DOI] [PubMed] [Google Scholar]
- 71.Barrett JC, Fry B, Maller J, Daly MJ. Haploview: analysis and visualization of LD and haplotype maps. Bioinformatics. 2005;21(2):263–265. doi: 10.1093/bioinformatics/bth457. [DOI] [PubMed] [Google Scholar]