Abstract
Human embryonic stem cells (hESCs) have an abbreviated G1 phase of the cell cycle that allows rapid proliferation and maintenance of pluripotency. Lengthening of G1 corresponds to loss of pluripotency during differentiation. However, precise mechanisms that link alterations in the cell cycle and early differentiation remain to be defined. We investigated initial stages of mesendodermal lineage commitment in hESCs, and observed a cell cycle pause. Transcriptome profiling identified several genes with known roles in regulation of the G2/M transition that were differentially expressed early during lineage commitment. WEE1 kinase, which blocks entry into mitosis by phosphorylating CDK1 at Y15, was the most highly expressed of these genes. Inhibition of CDK1 phosphorylation by a specific inhibitor of WEE1 restored cell cycle progression by preventing the G2 pause. Directed differentiation of hESCs revealed that cells paused during commitment to the endo- and mesodermal, but not ectodermal, lineages. Functionally, WEE1 inhibition during meso- and endodermal differentiation selectively decreased expression of definitive endodermal markers SOX17 and FOXA2. Our findings identify a novel G2 cell cycle pause that is required for endodermal differentiation and provide important new mechanistic insights into early events of lineage commitment.
Keywords: Cell Cycle, Embryonic Stem Cells, Cell Differentiation, CDC2 Protein Kinase, Endoderm
Graphical Abstract
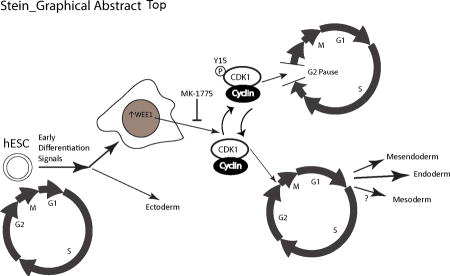
Early after induction of differentiation to certain lineages there is an increase in nuclear WEE1 that phosphorylates the CDK1/cyclin complex at Y15, inhibiting progression into mitosis and forcing cells to pause in G2. This pause is seen in mesendoderm, mesoderm, and endoderm differentiation but is only required for endoderm differentiation.
INTRODUCTION
Maintenance of human embryonic stem cell pluripotency is tightly linked to cell cycle control to regulate unlimited proliferation potential [1, 2]. Human embryonic stem cells have a unique cell cycle with a G1 phase shorter than that of somatic cells (~3 hours vs. ~10 hours) [3]. Lengthening of the G1 phase has been linked to differentiation and loss of pluripotency [4, 5]. Recent studies have shown that onset of differentiation likely occurs in the G1 phase, with endo- and mesodermal differentiation initiating in early G1 and the neuroectodermal lineage arising during late G1 [6, 7]. The G2/M/S phases of the hESC cell cycle are minimally responsive to differentiation cues [7]. Regulation of the cell cycle during the differentiation process has been primarily attributed to known negative regulators of proliferation in somatic cells, including p21 and p27 [4, 8, 9]. While a correlation between the lengthening of the cell cycle and initiation of hESC differentiation has been established, mechanisms that coordinate changes in the cell cycle and differentiation are not fully understood.
Another key property of hESCs is their ability to differentiate into all three germ layers. The most widely used method to differentiate hESCs involves formation of three-dimensional spheroids designated embryoid bodies (EBs), which can spontaneously differentiate into ectoderm, mesoderm and endoderm [10–13]. Typically, this method requires long incubation periods to induce differentiation (minimum 4–5d to form EB spheroids), providing a challenge to investigate mechanisms operative in the early stages of differentiation. Although there are numerous studies using EB differentiation protocols that require several days to weeks and focus on defined cell types [14–16], there is minimal mechanistic understanding of the earliest stages of hESC lineage commitment.
In this study, we investigated the link between cell cycle progression and early differentiation using monolayer hESC cultures. Unexpectedly, we observed a cell cycle pause in G2 during differentiation to several lineages that was regulated by WEE1. When WEE1 was inhibited, this cell cycle pause was disrupted, and lineage determinant gene expression was compromised. These findings provide a novel mechanistic dimension to functional relationships between control of proliferation and induction of phenotype.
MATERIALS AND METHODS
Stem Cell Culture
The female H9 (WA09) line and the male H1 (WA01) of hESCs were maintained on Matrigel using WiCell Research Institute (Madison, WI, www.wicell.org). SOP-SH-002 or SOP-SH-004 for Feeder Independent Growth using mTeSR1 (Stem Cell Technologies, Vancouver, BC, Canada, www.stemcell.com), or E8 medium (Life Technologies, Carlsbad, CA, www.thermofisher.com), respectively, and the EDTA passaging method, using a shorter (5 minutes) exposure to EDTA. For fetal bovine serum (FBS)-induced mesendodermal differentiation, undifferentiated monolayer hESC cultures were switched from mTeSR1 to differentiation media containing KNOCKOUT™ Dulbecco’s modified Eagle’s medium (DMEM), 20% heat inactivated Defined FBS, 1mM L-glutamine with 1% v/v 2-mercaptoethanol, and 0.1 mM nonessential amino acids. For retinoic acid (RA)-induced ectodermal differentiation, undifferentiated monolayer hESC cultures were switched from E8 to differentiation media with E6 basal media with the addition of 1 μM all-trans retinoic acid. For the mesodermal differentiation protocol, undifferentiated monolayer hESC cultures were switched from E8 to differentiation media with RPMI 1640 with B-27 supplement without insulin (Life Technologies) and 12 μM CHIR99021 (Selleck Chemicals S2924, Houston, TX, www.selleckchem.com) [17]. For the endodermal differentiation protocol, undifferentiated monolayer hESC cultures were switched from E8 to differentiation media with RPMI 1640 with 1X Glutamax and 100 ng/mL Activin A (R&D Systems, Minneapolis, MN, www.rndsystems.com), for treatment past 24 hours, 0.2% FBS was added [15].
Microarray Expression Analysis
RNA was extracted using Trizol Reagent (Life Technologies) according to manufacturer’s protocol. Genomic DNA was removed from isolated RNA using the Zymo DNA-Free RNA Kit, and then RNA quality was assessed using the Agilent 2100 BioAnalyzer. Fifty nanograms of RNA was used to synthesize cDNA using the GeneChip® WT PLUS Reagent Kit. The cDNA was hybridized to the GeneChip Human Transcriptome Array 2.0 for 16.5 hours overnight at 45°C. Arrays were stained using the Affymetrix GeneChip® Fluidics Station 450 and scanned with the Affymetrix GeneChip® Scanner 3000. All target preparation and microarray hybridization/scanning was performed in the VGN Microarray Facility at UVM. The dataset generated has been deposited in the NCBI Gene Expression Omnibus database according to MIAME guidelines with accession number GSE74004.
Due to evident fold change compression, Affymetrix (Santa Clara, CA, www.affymetrix.com) used a GC content leveling and signal space transformation to reduce background levels. Transformed CEL files were then imported into Affymetrix Expression Console Build 1.3.1.187 where the data were normalized using the default RMA algorithm. Further analysis was performed using the Gene Level Differential Expression Analysis function available in the Affymetrix Transcriptome Analysis Console Version 1.0.0.234. Differential gene expression was defined as a fold change greater than 1.5, an ANOVA p value less than 0.05, and a FDR p value less than 0.05. Partek Genomic Suite software (St. Louis, MO, www.partek.com) was used to generate the principal component analysis (PCA). EulerAPE version 3.0.0 was used to generate the proportional Venn Diagram and then recolored [18]. Heatmap was visualized using the heatmap.2 function in the R language package (http://www.r-project.org/). Pathway analysis was performed using QIAGEN’s Ingenuity Pathways Analysis (Qiagen, Valencia, CA, www.qiagen/com/ingenuity) and Reactome – A Curated Pathway Database (http://www.reactome.org/) v53 [19, 20].
Quantitative Real-Time PCR Analysis
RNA was isolated as described for microarray analysis; however cDNA was synthesized with random hexamer primers using Super Script III First Strand Synthesis System (Life Technologies Cat No. 18080-051). QRT-PCR was performed using SYBR Green PCR Master Mix (Bio-Rad, Hercules, CA, www.bio-rad.com), and samples were normalized to HPRT and fold change was determined using the ΔΔCt method. Primers used are as specified in Supplemental Table S1.
BrdU Incorporation Assay and Immunofluorescence (IF) Microscopy
Cells were grown on Matrigel-coated coverslips for IF time points less than 24 hours and grown on Matrigel-coated 35mm MatTek glass bottom dishes (MatTek P35G-1.5-14-C, Ashland, MA, www.mattek.com) for BrdU incorporation and IF longer than 24 hours to allow for increased adhesion to the glass. For the BrdU incorporation assay, cells were incubated for 30 minutes at 37°C with 10 μM 5-Bromo-2-deoxyuridine (Roche Kit No. 11 296 736 001, Basel, Switzerland, www.roche.com) to allow for incorporation before fixation. Fixation was performed using 3.7% formaldehyde in Phosphate Buffered Saline (PBS) for 10 minutes. Cells were then permeabilized in 0.1% Triton X-100 in PBS, and washed in 0.5% Bovine Serum Albumin in PBS. For the BrdU incorporation assay, cells were treated with DNaseI (30 μg per million cells) (BD Biosciences, Franklin Lakes, NJ, www.bdbiosciences.com) for 1 hour at 37°C after permeabilzation to expose the incorporated BrdU. Detection was performed using a rabbit polyclonal BRACHYURY antibody (H-210) (Santa Cruz Biotechnology Cat. No. sc-20109, Dallas, TX, www.scbt.com), a mouse monoclonal antibody (3B10) to SOX17 (Abcam ab84990, Cambridge, MA, www.abcam.com), a mouse monoclonal anti-BrdU antibody (clone MBG 6H8 igG1 from Roche), a rabbit polyclonal Ki67 antibody (Santa Cruz Cat. No. sc-15402), or a rabbit polyclonal WEE1 antibody (Cell Signaling #4936, Danvers, MA, www.cellsignal.com). Staining was performed using fluorescent secondary antibodies; for rabbit polyclonal antibodies a goat anti-rabbit IgG (H+L) secondary antibody, Alexa Fluor® 568 conjugate (Life Technologies A-11011), was used and for mouse monoclonal a F(ab′)2-goat anti-mouse IgG (H+L) secondary antibody, Alexa Fluor® 647 conjugate was used (Life Technologies A-21237).
Proliferation and Cell Viability
For growth curves, cells were plated in 12 well plates. The next day, cells were counted and this value was taken as D0, and differentiation was initiated in half the wells. Counting was performed at the same time daily for five additional days until confluence was reached. Cell Viability was assessed using the LIVE/DEAD® Viability/Cytotoxicity Kit for mammalian cells (Life Technologies L3224) and was performed per manufacturers’ instructions, with viable cells staining green and dead cells staining red.
Western Blot
Whole cell lysates were generated by incubating cells in RIPA buffer for 30 minutes on ice, followed by sonication using a Covaris S-220 Ultrasonic Processor for 5 minutes. Lysates were separated in a 12% polyacrylamide gel and transferred to PVDF membranes (Millipore, Billerica, MA, www.emdmillipore.com) using an OWL semi-dry transfer apparatus. Membranes were blocked using 1% Blotting Grade Blocker Non-Fat Dry Milk (Bio-Rad) and incubated overnight at 4°C with the following primary antibodies: a rabbit polyclonal WEE1 (Cell Signaling #4936, 1:1000); a rabbit polyclonal to CDK1(phospho Y15) (Abcam ab47594, 1:1000); a mouse monoclonal to CDK1/CDC2 p34(17) (Santa Cruz sc-54, 1:1000); a rabbit polyclonal to CDK2 (M2) (Santa Cruz sc-163, 1:2000); a mouse monoclonal to GAPDH (0411) (Santa Cruz sc-47724). Secondary antibodies conjugated to HRP (Santa Cruz) were used for immunodetection, along with the Clarity Western ECL Substrate (Bio-Rad) on a Chemidoc XRS+ imaging system (Bio-Rad). Relative quantification was performed using the Image Lab Software (Bio-Rad) version 5.1.
WEE1 Inhibition
Inhibition of WEE1 was accomplished using MK-1775 [21] (Selleck Chemicals S1525) diluted from 10 mM/1 mL DMSO to 100 nM. Cells were treated from initiation of differentiation to 8 hours, 16 hours, or 24 hours of differentiation. For differentiation longer than 24 hours, the inhibitor was removed after 24 hours of treatment.
Flow Cytometry Analysis
Cells analyzed by flow cytometry were fixed for 10 minutes in 1% formaldehyde followed by 5 minutes of incubation with 0.125M glycine (Sigma-Aldrich, St. Louis, MO, www.sigmaaldrich.com). Then cells were permeabilized for 10 minutes (BD Biosciences, 51-2091KZ) before being stained for 30 minutes with an antibody against H3S28P (Alexa fluor 647-conjugated, BD Biosciences, 558609). Cells were then re-suspended in 2% FBS in PBS and stained with 1 μg/ml DAPI (Life Technologies D1306) for at least 30 minutes to determine DNA content. Flow cytometric analysis was performed using the LSRII instrument (BD Biosciences) with 640 nm laser for Alexa Fluor-647 (670/30 BP) and 355 nm laser for DAPI (440/40 BP). Compensation for AF647-DAPI was not applicable. DNA cell cycle profiles were analyzed using ModFit LT v4.1.7 software (Verity Software House, Topsham, ME, www.vsh.com). FlowJo (Ashland, OR, www.flowjo.com) version 10 was used to display DNA histograms and to determine the percent of cells positive for H3S28P within the cycling cell populations.
RESULTS
Human Embryonic Stem Cells Differentiated into Mesendodermal Lineages Pause in the G2 Phase of the Cell Cycle
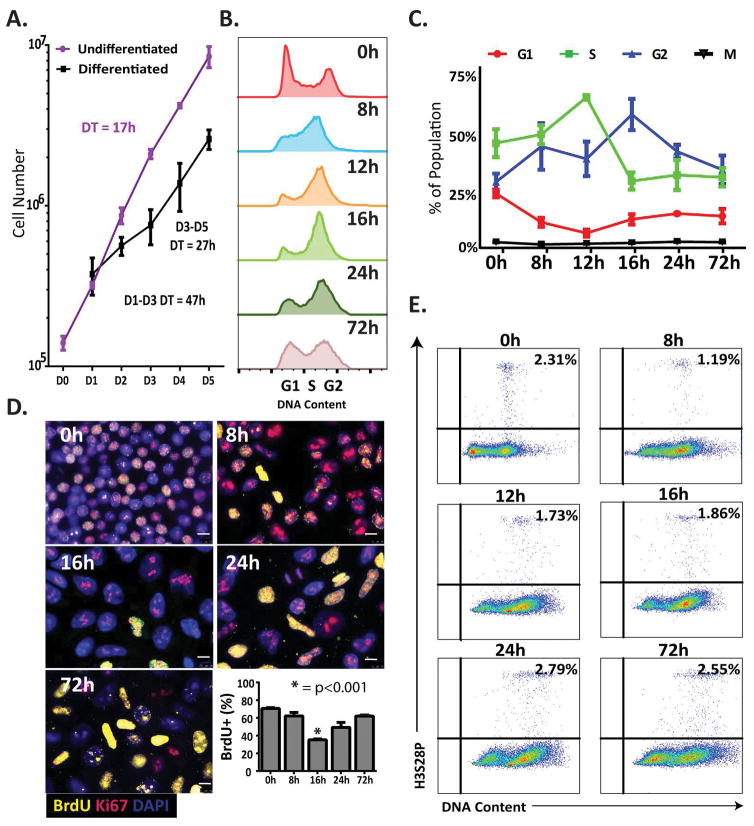
We investigated the relationship between cell cycle progression and early lineage commitment of hESCs by initially comparing the proliferation rates of pluripotent cells with those of hESCs that were differentiated into mesendoderm [22–24]. As previously shown [3], hESCs grown under pluripotent conditions exhibited exponential growth with a doubling time of <17 hours, while differentiating hESCs had a biphasic growth curve (Figure 1A). Notably, hESCs exhibited a longer doubling time of ~47 hours from days 1–3 of differentiation that by days 3–5 was reduced to ~27 hours, comparable to somatic diploid cells. These findings are consistent with previous studies that show a lengthening of the G1 phase after 72 hours of differentiation [25].
Figure 1.
Human embryonic stem cells (hESCs) induced to differentiate into mesendoderm pause in G2. (A) Growth Curves for hESCs under pluripotent and differentiation conditions. Line graph represents mean±SD from three independent experiments. (B) Representative flow cytometric analysis of DNA content by DAPI staining over a differentiation time course. Note the accumulation of cells in G2 between the 8h and 24h time points. (C) Percentages of cells in each phase (G1, S, G2, and Mitosis) at each time point during mesendoderm differentiation, as determined by cell cycle profile analysis using ModFit (G1, S, and G2 phases) and FlowJo (M phase, by determining the expression of H3S28P) software. Data represents the values for three replicates; data represents mean±SD. (D) Representative immunofluorescence images showing BrdU (yellow), and Ki67 (red) at time points indicated. Nuclei are stained with DAPI (blue) (scale bars: 10 μm). Quantification of BrdU+ cells was performed using blind scoring in duplicate of 200 cells, data represents mean±SEM (*, p < 0.001). (E) Representative flow cytometric analysis during differentiation time course shown as H3S28P vs. DNA content with the percentage of mitotic cells indicated in the upper right corner.
To delineate mechanisms underlying the extended doubling time, we examined the cell cycle profile of hESCs during the first three days of mesendoderm differentiation. Cell populations stained with DAPI were assessed for DNA content by fluorescence activated cell analysis (FACS) (Figure 1B and Supplemental Figure S1). Undifferentiated hESCs showed approximately 50% of cells in S phase, a typical cell cycle profile for hESCs. As early as 8 hours after induction of differentiation, cells began to accumulate in S/G2 phases, with a decrease in the G1 population (Figure 1B, C and Supplemental Figure S1). Accumulation in G2/M continued from 12–24 hours, with the greatest number of G2/M cells observed at 16 hours. By 72 hours of differentiation, cells were distributed throughout the cell cycle and by 96 hours, the percentage of cells in G2/M had decreased substantially (Supplemental Figure S1). These findings indicate that cells pause in the late S, G2 or M phase of the cell cycle during the first cell cycle of mesendodermal differentiation.
To determine the specific phase of the cell cycle when differentiating hESCs pause, we first investigated whether pausing occurs in late S or G2 phases by measuring active DNA synthesis using BrdU incorporation and immunofluorescence (IF) microscopy (Figure 1D). Undifferentiated hESCs had approximately 70% BrdU positive cells, which was nearly unchanged at 8 hours. Consistent with the DNA content profiles obtained by flow cytometry (Figure 1B), the percentage of BrdU positive cells was significantly decreased at 16 hours of differentiation, indicating fewer cells were synthesizing DNA. Furthermore, fluorescence microscopy of DAPI stained cells showed an increase in nuclear size, a hallmark of G2 cells (Figure 1D). To confirm the hESCs were alive and actively proliferating, cells were evaluated using a viability stain and an antibody against Ki67, a marker of active proliferation (Figure 1D and Supplemental Figure S2). Greater than 95% of cells were proliferating and viable, as determined by positive Ki67 staining and by the presence of ubiquitous intracellular esterase activity detected by green fluorescence, respectively (Figure 1D and Supplemental Figure S2). These results exclude the possibility that the cell cycle pause is in S phase. FACS analysis using the mitotic marker H3S28P [26], along with DNA content staining, revealed no increase in mitotic cells during the cell cycle pause (Figure 1E). Rather, mitotic cells decreased from 2.3% to 1.9% by 16 hours, concomitant with an increase in cells with 4N DNA content. Taken together these findings indicate that hESCs exhibit a G2 cell cycle pause during early differentiation towards mesendodermal lineages.
Gene Expression Profiling of Early Mesendoderm Differentiation Identifies a Cluster of Differentially Expressed Genes Involved in the G2/M Transition
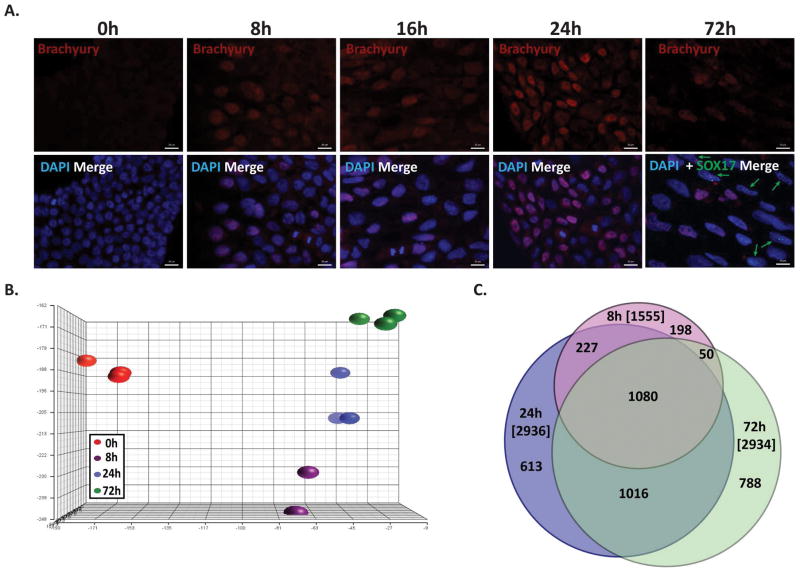
We examined global gene expression during early mesendoderm differentiation. Differentiation into mesendodermal lineages was confirmed by IF microscopy as well as by qRT-PCR for the mesoderm/primitive streak marker BRACHYURY and the endodermal marker SOX17 (Figure 2A, see Supplemental Figure S3 for additional lineage markers, and Supplemental Figure S4 for pluripotency markers and an enlarged IF image of SOX17 staining at 72 hours). We performed microarray analysis at four time points (0 hours, 8 hours, 24 hours, 72 hours) with three independent biological replicates at each point. Reproducibility of the gene expression datasets is demonstrated by principal component analysis, which shows the undifferentiated hESC samples cluster away from the differentiated samples (Figure 2B). Bioinformatics analysis (see materials and methods for details) identified a large number of genes that were changed from 8 hours of differentiation onward (1080, ~27%), as well as from 24 hours onward (1016, ~25.5%), which indicates the progressive nature of the differentiation (Figure 2C).
Figure 2.
Transcriptome analysis of early differentiation into mesendoderm. (A) Representative immunofluorescence staining of BRACHYURY (red) and SOX17 (green) over a mesendodermal differentiation time course. Green arrows point to cells staining positive for SOX17, as expression is very low. Nuclei are stained with DAPI (blue) (scale bars: 20 μm). (B) Principal Component Analysis (PCA) of the time points and replicates for mesendodermal differentiation of hESCs from global expression profiling of four time points (Undifferentiated (0h), 8 hours (8h), 1 day (24h), and 3 days (72h)) (n=3) by microarray analysis. (C) Venn diagram of the number of gene with expression changes greater than 1.5 fold, and p value and FDR p values < 0.05, at each time point compared to undifferentiated hESCs. The total number of genes changed at each time point is in brackets.
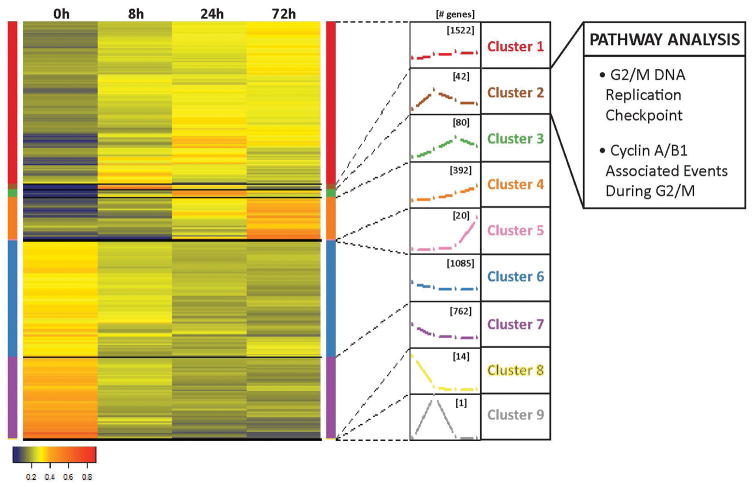
Hierarchical clustering revealed nine expression patterns for annotated genes that changed more than 1.5 fold and had a p value ≤ 0.05 and false discovery rate (FDR) p value ≤ 0.05 at any time point relative to undifferentiated levels (Figure 3). We focused on gene clusters 2 and 9 that had peak expression at 8 hours of mesendoderm differentiation, which corresponds to the initiation of the cell cycle pause (Supplemental Tables S2 and S3). Cluster 9 contained only EGR1, an early response gene that is expressed but non-essential in early differentiation [27–29]. Reactome pathway analysis revealed that Cluster 2 had an enrichment of genes involved in the G2/M DNA replication checkpoint and in cyclin A/B1 associated events during G2/M (Supplemental Table S4). These findings point to G2/M regulatory pathways as critical determinants of the observed G2 cell cycle pause during mesendodermal differentiation.
Figure 3.
Hierarchical clustering identifies a cluster of genes involved with the G2/M transition that increases at the time of the cell cycle pause. Hierarchical clustering based on normalized expression values of four time points was performed on annotated genes whose expression levels changed greater than 1.5 fold and p value and p value FDR < 0.05 at any time point compared to undifferentiated hESCs. Nine clusters were generated with the number of genes in each cluster indicated in brackets over the trace of the expression pattern. Clusters were analyzed using Reactome and Cluster 2 was found to have enrichment in pathways involved in the G2/M transition.
WEE1, a G2/M Regulatory Kinase, is Up-regulated During the Cell Cycle Pause in Mesendoderm Differentiation
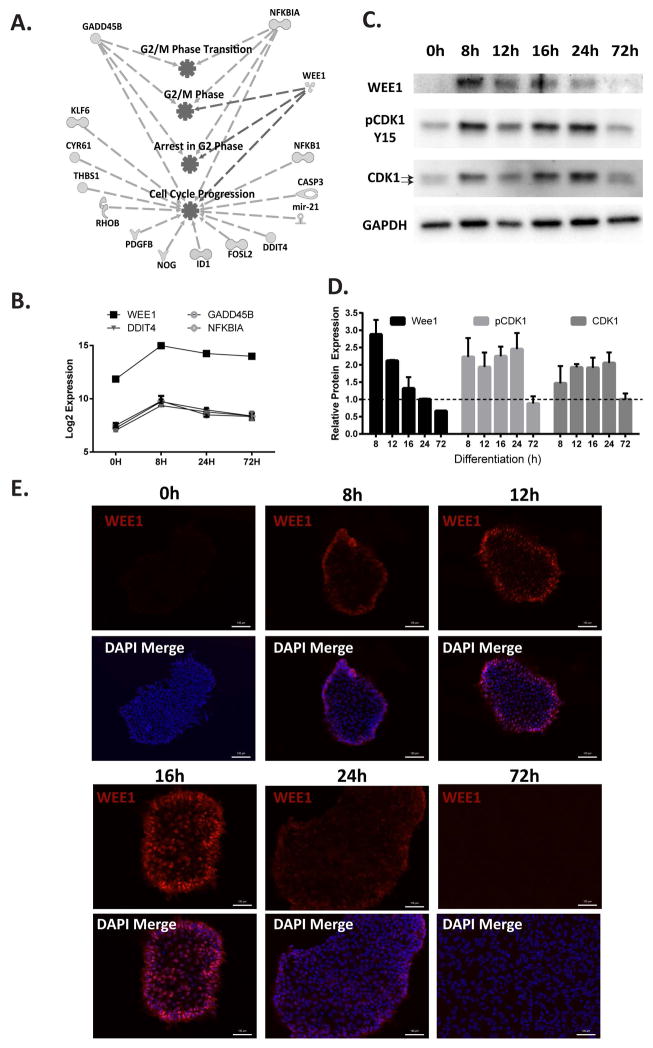
Ingenuity Pathway Analysis of Cluster 2 that exhibited peak expression at 8 hours after initiation of differentiation identified genes that are associated with cell cycle progression and the G2/M phase (Figure 4A). Many of these genes with known role(s) in regulating the G2 phase or the G2/M transition (WEE1, GADD45B, DDIT4/REDD1, and NFKBIA/IKBA) were highly expressed (Figure 4B and Supplemental Figure S5) [30–34]. The G2/M phase transition is regulated by multiple activating and inhibitory phosphorylations of CDK1/CDC2 [35, 36]. WEE1, a kinase responsible for inhibitory phosphorylation of CDK1 at Y15 [30], was the most highly up-regulated of the Cluster 2 genes at both the transcript and protein level during the cell cycle pause (Figure 4B–D). IF microscopy confirmed that the increased WEE1 protein was largely localized in the nucleus (Figure 4E). Importantly, there was a corresponding increase in the inhibitory phosphorylation of CDK1 on Y15 during the cell cycle pause (Figure 4C, D). Interestingly, increased CDK1 phosphorylation appears to result in an increase in total CDK1 protein (Figure 4C–D). Together, these observations indicate that the increased WEE1 is functional and inhibiting progress into mitosis, and suggest a link between the cell cycle pause during early mesendoderm differentiation of hESCs and WEE1 activity.
Figure 4.
WEE1, a G2/M regulator, is up-regulated during the G2 cell cycle pause. (A) Using Ingenuity to analyze Cluster 2, genes were pulled out that were related to cell cycle progression/regulation, and associated genes were mapped. (B) Expression profiles of the four known regulators of G2 phase progression. The graph shows microarray expression levels as log2 values. Data represents mean±SD from three independent experiments. (C) Representative Western blot showing the levels of WEE1, pCDK1 Y15, and CDK1 in hESCs induced to differentiate to mesendoderm. GAPDH is used as a loading control. The two arrows indicate the separation between the phosphorylated and unphosphorylated states of CDK1. (D) Quantification of Western blots represented in (C). Quantification data is the mean±SD from two independent experiments. (E) Representative immunofluorescence images with WEE1 (red). Nuclei are stained with DAPI (blue) (scale bars: 100 μm).
Induction of WEE1 Expression and the G2 Cell Cycle Pause are Lineage-Specific
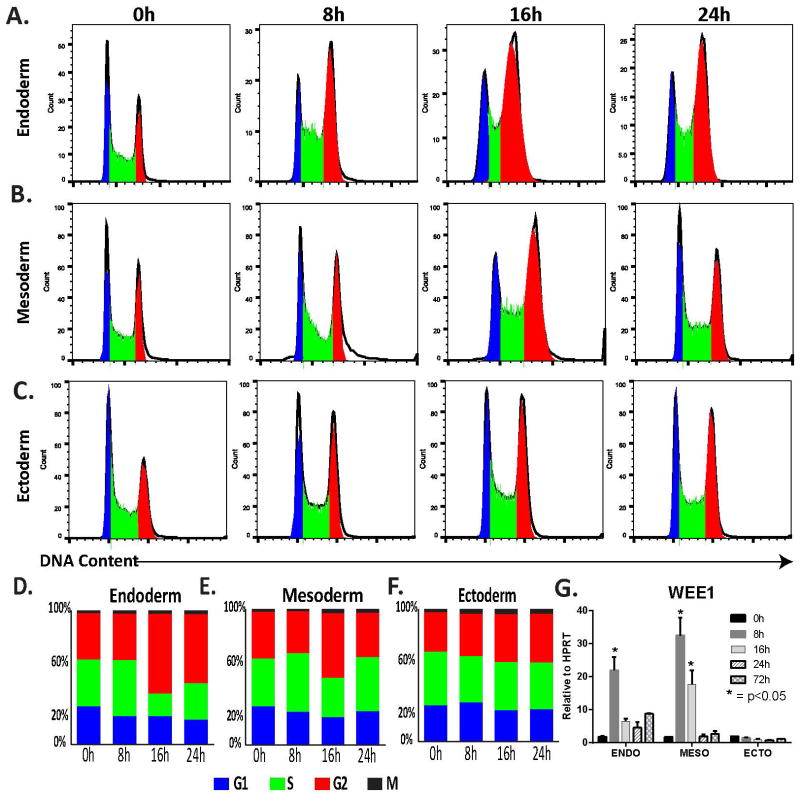
We investigated whether the G2 cell cycle pause is a general feature of early differentiation, or is lineage specific. Human ESCs were differentiated into ectoderm, mesoderm, or endoderm and evaluated at 0 hours (undifferentiated), 8 hours, 16 hours, and 24 hours after induction of differentiation. Commitment to the desired lineages was confirmed by qRT-PCR on a panel of lineage-restrictive transcription factors RNAs (Supplemental Figure S6, and see Supplemental Figure S7 for phase contrast images of differentiation). The cell cycle distribution for each differentiation time course was quantified using flow cytometric analyses of H3S28P mitotic staining, along with DNA content (Figure 5A–F and Supplemental Figure S8). Similar to mesendodermal differentiation, we observed an accumulation of cells in G2 during endodermal differentiation, which became prominent at 16 hours and continued through 24 hours (Figure 5A, D). Although an enrichment of cells in G2 was seen at 16 hours of mesodermal differentiation, it did not extend to 24 hours, and involved a smaller percentage of the cells (Figure 5B, E). Of note, there was an increase in the percent of cells in S phase at 8 hours during both endodermal and mesodermal differentiation (Figure 5D, E). Consistent with the G2 cell cycle pause, WEE1 RNA levels were increased at 8 hours in both mesodermal and endodermal differentiation (Figure 5G). No cell cycle stage specific accumulation or WEE1 up-regulation was detected during ectodermal differentiation (Figure 5C, F, G). These findings establish that the G2 pause is lineage restricted and also reveal a correlation between WEE1 up-regulation and the G2 cell cycle pause.
Figure 5.
Differentiation to endoderm and mesoderm induces a cell cycle pause and expression of WEE1. (A–C) Representative flow cytometric DNA content analysis by DAPI staining across differentiation time courses to (A) Endoderm (B) Mesoderm and (C) Ectoderm. (D–F) Quantification of flow cytometric DNA content analysis by DAPI staining for differentiation to (D) Endoderm (E) Mesoderm and (F) Ectoderm, showing enrichment in the G2 population in both mesoderm and endoderm differentiation. The percentage of cells in each phase (G1, S, G2, and Mitosis) at each time point during differentiation was determined by cell cycle profile analysis using Flow Jo and ModFit. Data represents the mean of three independent experiments normalized to 100%. (G) The levels of WEE1 normalized to HPRT, during endoderm, mesoderm, and ectoderm differentiation by qRT-PCR. A significant increase in WEE1 expression is seen during mesoderm and endoderm differentiation. Data represented as mean±SD from three independent experiments (*, p < 0.05).
Inhibition of WEE1-Mediated CDK1 Phosphorylation Compromises Endodermal Differentiation
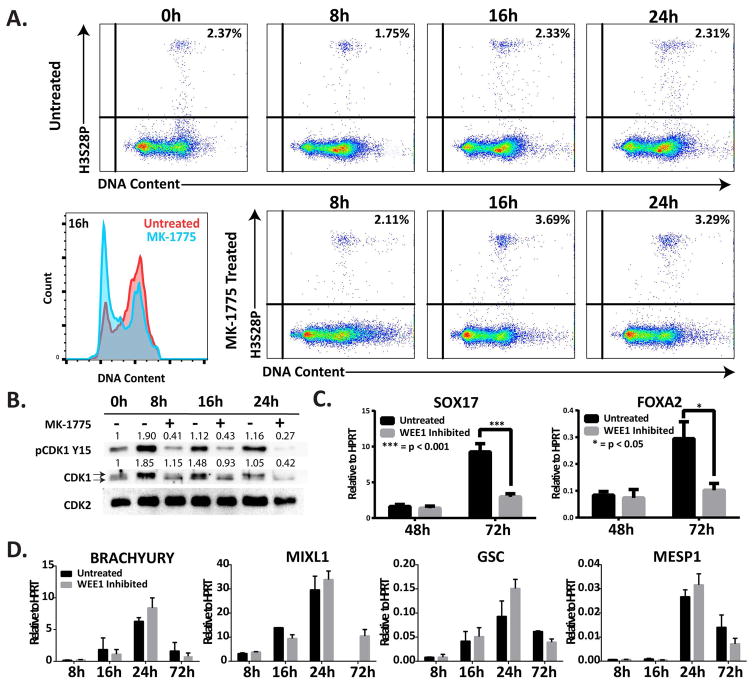
To experimentally test whether WEE1 plays a functional role in the G2 cell cycle pause, we blocked the ability of WEE1 to phosphorylate Y15 of CDK1 using the WEE1 selective inhibitor MK-1775 [37–39]. Inhibition of WEE1 activity in cells differentiating into mesendoderm significantly increased the percentage of mitotic cells at 16 hours (3.69±0.15% with MK-1775 vs. 2.33±0.11% in uninhibited cells) and 24 hours (3.29±0.14% with MK-1775 vs. without treatment 2.31±0.11%) (Figure 6A). Importantly, in the presence of MK-1775, there was no observable enrichment of cells in G2, indicating that the cell cycle pause was prevented (Figure 6A and Supplemental Figure S9). Western blot analysis confirmed that inhibition of WEE1 activity decreased CDK1 Y15 phosphorylation (Figure 6B). These results demonstrate that WEE1-mediated inhibitory phosphorylation of CDK1 is a key regulatory event in the G2 cell cycle pause.
Figure 6.
WEE1 inhibition compromises endodermal differentiation. (A) Representative flow cytometric analysis of hESCs undergoing mesendodermal differentiation treated with WEE1 inhibitor, MK-1775, shown as H3S28P vs. DNA content with the percentage of mitotic cells indicated in the upper right corner. This panel shows an increase in mitotic population with treatment with the WEE1 inhibitor at 16h and 24h. (B) Representative Western blot showing the levels of pCDK1 Y15, and CDK1 in hESCs induced to differentiate to mesendoderm with and without treatment with MK-1775. CDK2 is used as a loading control. The two arrows indicate the separation between the phosphorylated and unphosphorylated states of CDK1. The numbers above each band of the Western blot indicate the relative quantification of that band normalized to the loading control. (C) After 48h and 72h of differentiation directed to endoderm, with and without 24h treatment with MK-1775, the levels of endoderm markers SOX17 and FOXA2 were measured by qRT-PCR. (D) At time course of differentiation directed to mesoderm, with and without treatment with the WEE1 inhibitor MK-1775, the levels of mesoderm markers BRACHYURY, MIXL1, GSC, and MESP1 were measured by qRT-PCR. qRT-PCR data shown as mean±SD from three independent experiments (***, p < 0.001; *, p<0.05).
We investigated whether the WEE1-mediated cell cycle pause was necessary for lineage commitment to either mesodermal or endodermal lineages. Differentiating cells were treated with the WEE1 inhibitor and expression of lineage restrictive transcription factors was measured by qRT-PCR. During endodermal differentiation, inhibition of WEE1 activity significantly decreased the levels of the key lineage determinants SOX17 and FOXA2 [15, 40] by 72 hours (Figure 6C). In contrast, the WEE1 inhibitor did not significantly affect expression of lineage markers during mesodermal differentiation (Figure 6D). These findings indicate that the cell cycle pause mediated by the WEE1-CDK1 pathway is necessary for endodermal, but not mesodermal differentiation.
DISCUSSION
In this study, we have discovered mechanistic underpinnings linking the cell cycle and early events during human embryonic stem cell differentiation. Our key finding is a WEE1-mediated cell cycle pause in G2 that when disrupted, selectively compromises lineage commitment to endoderm.
Recent studies have focused on the role of the G1 phase in promoting differentiation of hESC [6, 7]. Gonzalez et al examined pluripotent state dissolution and retinoic acid induced differentiation and found that the S and G2 phases of the cell cycle have intrinsic functions in pluripotent state maintenance [41]. Our results have uncovered a previously unknown role for G2 events in regulating cell fate determination during the first cell cycle after induction of differentiation, and reveal that multiple mechanisms link cell cycle control to differentiation. The very early G2 pause we observed may function as a transition point between active maintenance of pluripotency and the incorporation of differentiation cues before commitment to lineage determination. At a cellular mechanistic level, this G2 cell cycle pause could also be required to establish competency for chromatin rearrangement or movement of nuclear factors necessary for mediating differentiation.
Fifteen of the 42 genes that were up-regulated during the early stages of the cell cycle pause are involved in regulation of G2 or cell cycle progression. WEE1, the most highly up-regulated of these genes, and its phosphorylation of CDK1 Y15 provide compelling functional linkage between the cell cycle and competency for lineage commitment. Our findings that additional genes are up-regulated at the cell cycle pause suggest that other mechanisms may be operative at the G2/M transition during early differentiation. It remains to be determined whether these genes are upstream of WEE1 or function coordinately with WEE1.
From a physiological standpoint, the up-regulation of WEE1 and the G2 cell cycle pause are lineage restricted. Although WEE1 up-regulation occurs during commitment to both endodermal and mesodermal lineages, only differentiation to endoderm was compromised when WEE1 activity was inhibited. Neither the G2 pause nor increased WEE1 was observed in ectodermal differentiation. This lineage restricted cell cycle pause could reflect a decision point for cell fate determination of a bipotent progenitor with the ability to differentiate to either mesoderm or endoderm. Mesodermal differentiation may be the default pathway, because WEE1 inhibition compromises endodermal but not mesodermal differentiation.
In a broader biological context, our results may provide mechanistic insight into early events for lineage commitment that are mediated by crosstalk between regulatory components of the cell cycle and competency for initiation of phenotype. This crosstalk may be governed by selective expression of genes that control the cell cycle and those that sustain pluripotency or are permissive for the transition to developmental progression. We postulate that a G2 cell cycle pause in pluripotent cells provides a window of opportunity to reconfigure genomic and epigenetic regulatory machinery. These regulatory events permit a transition from unrestrained proliferation and suppression of lineage specific genes to restricted proliferation with physiologically responsive cell and tissue specific gene expression.
Conclusions
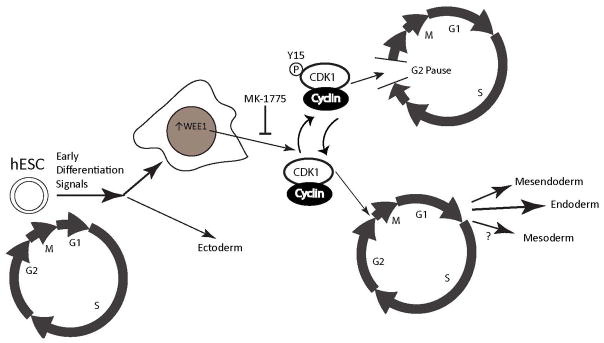
Our findings identify a novel G2 cell cycle pause in early differentiation of human embryonic stem cells. This G2 pause is mediated by Y15 CDK1 phosphorylation due to an increase in the WEE1 kinase. Up-regulation of WEE1 and the cell cycle pause are observed during differentiation to both endodermal and mesodermal lineages, but only endoderm specification is compromised upon WEE inhibition (Figure 7). We conclude that the G2 pause is necessary for the lineage specific commitment of human embryonic stem cells.
Figure 7.
A summary model showing our finding of a novel G2 cell cycle pause. Early after induction of differentiation to certain lineages there is an increase in nuclear WEE1 that phosphorylates the CDK1/cyclin complex at Y15, inhibiting progression into mitosis and forcing cells to pause in G2. This pause is seen in mesendoderm, mesoderm, and endoderm differentiation but is only required for endoderm differentiation.
Supplementary Material
Supplemental Figure S1. ModFit profiles across the mesendoderm differentiation time course labeled with the percentage of cells in each cell cycle phase.
Supplemental Figure S2. Analysis of proliferation during mesendoderm differentiation. LIVE/DEAD staining showing that the majority of cells attached to the plate are viable and living (scale bars indicate 100 μm).
Supplemental Figure S3. qRT-panel of mesendodermal differentiation. Early mesoderm markers (BRACHYURY, MIXL1, and MESP1), early ectoderm Markers (PAX6, NES, and GBX2) and early endoderm Markers (SOX17, GATA4, and AFP) were used.
Supplemental Figure S4. qRT-panel of Pluripotency Marker (OCT4, NANOG, and SOX2), phase contrast images over a mesendodermal differentiation time course, and an enlarged immunofluorescence image of Brachyury and SOX17 staining at 72 hours.
Supplemental Figure S5. qRT-panel of G2 regulators. Confirmation of microarray expression levels for WEE1, DDIT4, GADD45B, and NFKBIA by qRT-PCR.
Supplemental Figure S6. qRT-panel of differentiation directed to ectoderm, mesoderm, and endoderm with early mesoderm markers (BRACHYURY, MIXL1, and MESP1), early ectoderm markers (PAX6, NES, GBX2) and early endoderm markers (SOX17, GATA4, AFP).
Supplemental Figure S7. Phase Contrast images across mesoderm, ectoderm, and endoderm differentiation time courses. All images were taken at 10x magnification.
Supplemental Figure S8. ModFit profiles across mesoderm, ectoderm, and endoderm differentiation time courses with the percentage of cells in each cell cycle phase.
Supplemental Figure S9. ModFit profiles across mesendoderm differentiation time courses with and without treatment of the WEE1 inhibitor MK-1775 with the percentage of cells in each cell cycle phase.
Supplemental Table S1. qPCR primers.
Supplemental Table S2. Genes in Cluster 2.
Supplemental Table S3. Full list of genes in each cluster from hierarchical clustering.
Supplemental Table S4. Full pathway analysis from Reactome of Clusters 2.
Acknowledgments
GRANT/RESEARCH SUPOPORT:
This work was supported by NIH grants NCI P01 CA082834 (GSS, JLS), R01 CA139322 (GSS) and NIGMS IDeA grant P20 GM103449.
We thank the members of our laboratory, with specific thanks to Joseph Boyd for his bioinformatics contributions. We also thank Julie Dragon for her help with microarray quality control. Flow cytometry data were obtained at the Harry Hood Bassett Flow Cytometry and Cell Sorting Facility, University of Vermont College of Medicine.
Footnotes
The contents of this manuscript are solely the responsibility of the authors and do not necessarily represent the official views of the NIH.
Disclosure of Potential Conflicts of Interest
The authors indicate no potential conflicts of interest.
- Jennifer J. VanOudenhove: Conception and design, collection/assembly of data, data analysis and interpretation, manuscript writing, final approval of manuscript
- Rodrigo A. Grandy: Conception and design, collection/assembly of data
- Prachi N. Ghule: Conception and design, collection/assembly of data, data analysis and interpretation
- Roxana del Rio: Collection of data, data analysis and interpretation
- Jane B. Lian: Data analysis and interpretation
- Janet L. Stein: Conception and design, assembly of data, data analysis and interpretation, financial support, manuscript writing, final approval of manuscript
- Sayyed K. Zaidi: Conception and design, assembly of data, data analysis and interpretation, manuscript writing
- Gary S. Stein: Conception and design, data analysis and interpretation, financial support, manuscript writing, final approval of manuscript
References
- 1.Kapinas K, Grandy R, Ghule P, et al. The abbreviated pluripotent cell cycle. J Cell Physiol. 2013;228:9–20. doi: 10.1002/jcp.24104. [DOI] [PMC free article] [PubMed] [Google Scholar]
- 2.White J, Dalton S. Cell cycle control of embryonic stem cells. Stem Cell Rev. 2005;1:131–138. doi: 10.1385/SCR:1:2:131. [DOI] [PubMed] [Google Scholar]
- 3.Becker KA, Ghule PN, Therrien JA, et al. Self-renewal of human embryonic stem cells is supported by a shortened G1 cell cycle phase. J Cell Physiol. 2006;209:883–893. doi: 10.1002/jcp.20776. [DOI] [PubMed] [Google Scholar]
- 4.Calder A, Roth-Albin I, Bhatia S, et al. Lengthened G1 phase indicates differentiation status in human embryonic stem cells. Stem Cells Dev. 2013;22:279–295. doi: 10.1089/scd.2012.0168. [DOI] [PubMed] [Google Scholar]
- 5.Filipczyk AA, Laslett AL, Mummery C, et al. Differentiation is coupled to changes in the cell cycle regulatory apparatus of human embryonic stem cells. Stem Cell Res. 2007;1:45–60. doi: 10.1016/j.scr.2007.09.002. [DOI] [PubMed] [Google Scholar]
- 6.Sela Y, Molotski N, Golan S, et al. Human embryonic stem cells exhibit increased propensity to differentiate during the G1 phase prior to phosphorylation of retinoblastoma protein. Stem Cells. 2012;30:1097–1108. doi: 10.1002/stem.1078. [DOI] [PubMed] [Google Scholar]
- 7.Pauklin S, Vallier L. The cell-cycle state of stem cells determines cell fate propensity. Cell. 2013;155:135–147. doi: 10.1016/j.cell.2013.08.031. [DOI] [PMC free article] [PubMed] [Google Scholar]
- 8.Egozi D, Shapira M, Paor G, et al. Regulation of the cell cycle inhibitor p27 and its ubiquitin ligase Skp2 in differentiation of human embryonic stem cells. FASEB J. 2007;21:2807–2817. doi: 10.1096/fj.06-7758com. [DOI] [PubMed] [Google Scholar]
- 9.Zhu H, Hu S, Baker J. JMJD5 regulates cell cycle and pluripotency in human embryonic stem cells. Stem Cells. 2014;32:2098–2110. doi: 10.1002/stem.1724. [DOI] [PubMed] [Google Scholar]
- 10.Keller GM. In vitro differentiation of embryonic stem cells. Curr Opin Cell Biol. 1995;7:862–869. doi: 10.1016/0955-0674(95)80071-9. [DOI] [PubMed] [Google Scholar]
- 11.Xu C, Police S, Rao N, et al. Characterization and enrichment of cardiomyocytes derived from human embryonic stem cells. Circ Res. 2002;91:501–508. doi: 10.1161/01.res.0000035254.80718.91. [DOI] [PubMed] [Google Scholar]
- 12.Segev H, Fishman B, Ziskind A, et al. Differentiation of human embryonic stem cells into insulin-producing clusters. Stem Cells. 2004;22:265–274. doi: 10.1634/stemcells.22-3-265. [DOI] [PubMed] [Google Scholar]
- 13.Itskovitz-Eldor J, Schuldiner M, Karsenti D, et al. Differentiation of human embryonic stem cells into embryoid bodies compromising the three embryonic germ layers. Mol Med. 2000;6:88–95. [PMC free article] [PubMed] [Google Scholar]
- 14.Takasato M, Er PX, Becroft M, et al. Directing human embryonic stem cell differentiation towards a renal lineage generates a self-organizing kidney. Nat Cell Biol. 2014;16:118–126. doi: 10.1038/ncb2894. [DOI] [PubMed] [Google Scholar]
- 15.D’Amour KA, Agulnick AD, Eliazer S, et al. Efficient differentiation of human embryonic stem cells to definitive endoderm. Nat Biotechnol. 2005;23:1534–1541. doi: 10.1038/nbt1163. [DOI] [PubMed] [Google Scholar]
- 16.Gerrard L, Rodgers L, Cui W. Differentiation of human embryonic stem cells to neural lineages in adherent culture by blocking bone morphogenetic protein signaling. Stem Cells. 2005;23:1234–1241. doi: 10.1634/stemcells.2005-0110. [DOI] [PubMed] [Google Scholar]
- 17.Lian X, Zhang J, Azarin SM, et al. Directed cardiomyocyte differentiation from human pluripotent stem cells by modulating Wnt/beta-catenin signaling under fully defined conditions. Nat Protoc. 2013;8:162–175. doi: 10.1038/nprot.2012.150. [DOI] [PMC free article] [PubMed] [Google Scholar]
- 18.Micallef L, Rodgers P. eulerAPE: drawing area-proportional 3-Venn diagrams using ellipses. PLoS One. 2014;9:e101717. doi: 10.1371/journal.pone.0101717. [DOI] [PMC free article] [PubMed] [Google Scholar]
- 19.Croft D, Mundo AF, Haw R, et al. The Reactome pathway knowledgebase. Nucleic Acids Res. 2014;42:D472–477. doi: 10.1093/nar/gkt1102. [DOI] [PMC free article] [PubMed] [Google Scholar]
- 20.Milacic M, Haw R, Rothfels K, et al. Annotating cancer variants and anti-cancer therapeutics in reactome. Cancers (Basel) 2012;4:1180–1211. doi: 10.3390/cancers4041180. [DOI] [PMC free article] [PubMed] [Google Scholar]
- 21.Hirai H, Iwasawa Y, Okada M, et al. Small-molecule inhibition of Wee1 kinase by MK-1775 selectively sensitizes p53-deficient tumor cells to DNA-damaging agents. Mol Cancer Ther. 2009;8:2992–3000. doi: 10.1158/1535-7163.MCT-09-0463. [DOI] [PubMed] [Google Scholar]
- 22.Tada S, Era T, Furusawa C, et al. Characterization of mesendoderm: a diverging point of the definitive endoderm and mesoderm in embryonic stem cell differentiation culture. Development. 2005;132:4363–4374. doi: 10.1242/dev.02005. [DOI] [PubMed] [Google Scholar]
- 23.Nishikawa SI, Nishikawa S, Hirashima M, et al. Progressive lineage analysis by cell sorting and culture identifies FLK1+VE-cadherin+ cells at a diverging point of endothelial and hemopoietic lineages. Development. 1998;125:1747–1757. doi: 10.1242/dev.125.9.1747. [DOI] [PubMed] [Google Scholar]
- 24.Mahmood A, Aldahmash A. Induction of primitive streak and mesendoderm formation in monolayer hESC culture by activation of TGF-beta signaling pathway by Activin B. Saudi J Biol Sci. 2015;22:692–697. doi: 10.1016/j.sjbs.2015.03.002. [DOI] [PMC free article] [PubMed] [Google Scholar]
- 25.Becker KA, Stein JL, Lian JB, et al. Human embryonic stem cells are pre-mitotically committed to self-renewal and acquire a lengthened G1 phase upon lineage programming. J Cell Physiol. 2010;222:103–110. doi: 10.1002/jcp.21925. [DOI] [PMC free article] [PubMed] [Google Scholar]
- 26.Goto H, Tomono Y, Ajiro K, et al. Identification of a novel phosphorylation site on histone H3 coupled with mitotic chromosome condensation. J Biol Chem. 1999;274:25543–25549. doi: 10.1074/jbc.274.36.25543. [DOI] [PubMed] [Google Scholar]
- 27.Edwards SA, Darland T, Sosnowski R, et al. The transcription factor, Egr-1, is rapidly modulated in response to retinoic acid in P19 embryonal carcinoma cells. Dev Biol. 1991;148:165–173. doi: 10.1016/0012-1606(91)90327-y. [DOI] [PubMed] [Google Scholar]
- 28.Lanoix J, Belhumeur P, Lussier M, et al. Regulated expression of Krox-24 and other serum-responsive genes during differentiation of P19 embryonal carcinoma cells. Cell Growth Differ. 1991;2:391–399. [PubMed] [Google Scholar]
- 29.Lee SL, Tourtellotte LC, Wesselschmidt RL, et al. Growth and differentiation proceeds normally in cells deficient in the immediate early gene NGFI-A. J Biol Chem. 1995;270:9971–9977. doi: 10.1074/jbc.270.17.9971. [DOI] [PubMed] [Google Scholar]
- 30.McGowan CH, Russell P. Human Wee1 kinase inhibits cell division by phosphorylating p34cdc2 exclusively on Tyr15. EMBO J. 1993;12:75–85. doi: 10.1002/j.1460-2075.1993.tb05633.x. [DOI] [PMC free article] [PubMed] [Google Scholar]
- 31.Mak SK, Kultz D. Gadd45 proteins induce G2/M arrest and modulate apoptosis in kidney cells exposed to hyperosmotic stress. J Biol Chem. 2004;279:39075–39084. doi: 10.1074/jbc.M406643200. [DOI] [PubMed] [Google Scholar]
- 32.Vairapandi M, Balliet AG, Hoffman B, et al. GADD45b and GADD45g are cdc2/cyclinB1 kinase inhibitors with a role in S and G2/M cell cycle checkpoints induced by genotoxic stress. J Cell Physiol. 2002;192:327–338. doi: 10.1002/jcp.10140. [DOI] [PubMed] [Google Scholar]
- 33.Ben Sahra I, Regazzetti C, Robert G, et al. Metformin, independent of AMPK, induces mTOR inhibition and cell-cycle arrest through REDD1. Cancer Res. 2011;71:4366–4372. doi: 10.1158/0008-5472.CAN-10-1769. [DOI] [PubMed] [Google Scholar]
- 34.Patel NM, Nozaki S, Shortle NH, et al. Paclitaxel sensitivity of breast cancer cells with constitutively active NF-kappaB is enhanced by IkappaBalpha super-repressor and parthenolide. Oncogene. 2000;19:4159–4169. doi: 10.1038/sj.onc.1203768. [DOI] [PubMed] [Google Scholar]
- 35.Vermeulen K, Van Bockstaele DR, Berneman ZN. The cell cycle: a review of regulation, deregulation and therapeutic targets in cancer. Cell Prolif. 2003;36:131–149. doi: 10.1046/j.1365-2184.2003.00266.x. [DOI] [PMC free article] [PubMed] [Google Scholar]
- 36.Stark GR, Taylor WR. Control of the G2/M transition. Mol Biotechnol. 2006;32:227–248. doi: 10.1385/MB:32:3:227. [DOI] [PubMed] [Google Scholar]
- 37.Guertin AD, Li J, Liu Y, et al. Preclinical evaluation of the WEE1 inhibitor MK-1775 as single-agent anticancer therapy. Mol Cancer Ther. 2013;12:1442–1452. doi: 10.1158/1535-7163.MCT-13-0025. [DOI] [PubMed] [Google Scholar]
- 38.Krajewska M, Heijink AM, Bisselink YJ, et al. Forced activation of Cdk1 via wee1 inhibition impairs homologous recombination. Oncogene. 2013;32:3001–3008. doi: 10.1038/onc.2012.296. [DOI] [PubMed] [Google Scholar]
- 39.Kreahling JM, Gemmer JY, Reed D, et al. MK1775, a selective Wee1 inhibitor, shows single-agent antitumor activity against sarcoma cells. Mol Cancer Ther. 2012;11:174–182. doi: 10.1158/1535-7163.MCT-11-0529. [DOI] [PMC free article] [PubMed] [Google Scholar]
- 40.Sulzbacher S, Schroeder IS, Truong TT, et al. Activin A-induced differentiation of embryonic stem cells into endoderm and pancreatic progenitors-the influence of differentiation factors and culture conditions. Stem Cell Rev. 2009;5:159–173. doi: 10.1007/s12015-009-9061-5. [DOI] [PubMed] [Google Scholar]
- 41.Gonzales KA, Liang H, Lim YS, et al. Deterministic Restriction on Pluripotent State Dissolution by Cell-Cycle Pathways. Cell. 2015;162:564–579. doi: 10.1016/j.cell.2015.07.001. [DOI] [PubMed] [Google Scholar]
Associated Data
This section collects any data citations, data availability statements, or supplementary materials included in this article.
Supplementary Materials
Supplemental Figure S1. ModFit profiles across the mesendoderm differentiation time course labeled with the percentage of cells in each cell cycle phase.
Supplemental Figure S2. Analysis of proliferation during mesendoderm differentiation. LIVE/DEAD staining showing that the majority of cells attached to the plate are viable and living (scale bars indicate 100 μm).
Supplemental Figure S3. qRT-panel of mesendodermal differentiation. Early mesoderm markers (BRACHYURY, MIXL1, and MESP1), early ectoderm Markers (PAX6, NES, and GBX2) and early endoderm Markers (SOX17, GATA4, and AFP) were used.
Supplemental Figure S4. qRT-panel of Pluripotency Marker (OCT4, NANOG, and SOX2), phase contrast images over a mesendodermal differentiation time course, and an enlarged immunofluorescence image of Brachyury and SOX17 staining at 72 hours.
Supplemental Figure S5. qRT-panel of G2 regulators. Confirmation of microarray expression levels for WEE1, DDIT4, GADD45B, and NFKBIA by qRT-PCR.
Supplemental Figure S6. qRT-panel of differentiation directed to ectoderm, mesoderm, and endoderm with early mesoderm markers (BRACHYURY, MIXL1, and MESP1), early ectoderm markers (PAX6, NES, GBX2) and early endoderm markers (SOX17, GATA4, AFP).
Supplemental Figure S7. Phase Contrast images across mesoderm, ectoderm, and endoderm differentiation time courses. All images were taken at 10x magnification.
Supplemental Figure S8. ModFit profiles across mesoderm, ectoderm, and endoderm differentiation time courses with the percentage of cells in each cell cycle phase.
Supplemental Figure S9. ModFit profiles across mesendoderm differentiation time courses with and without treatment of the WEE1 inhibitor MK-1775 with the percentage of cells in each cell cycle phase.
Supplemental Table S1. qPCR primers.
Supplemental Table S2. Genes in Cluster 2.
Supplemental Table S3. Full list of genes in each cluster from hierarchical clustering.
Supplemental Table S4. Full pathway analysis from Reactome of Clusters 2.


