

Abstract
Adipose tissue in the loin muscle area of beef cattle as a marbling factor is directly associated with beef quality. To elucidate whether properties of proteins involved in depot specific adipose tissue were sex-dependent, we analyzed protein expression of intramuscular adipose tissue (IMAT) and omental adipose tissue (OMAT) from Hanwoo cows, steers, and bulls of Korean native beef cattle by liquid chromatography-tandem mass spectrometry (LC-MS/MS)–based proteomic analysis, quantitative polymerase chain reaction (PCR) and western blot analysis. Two different adipose depots (i.e. intramuscular and omental) were collected from cows (n = 7), steers (n = 7), or bulls (n = 7). LC-MS/MS revealed a total of 55 and 35 proteins in IMAT and OMAT, respectively. Of the 55 proteins identified, 44, 40, and 42 proteins were confirmed to be differentially expressed in IMAT of cows, steers, and bulls, respectively. In OMAT of cows, steers, and bulls, 33, 33, and 22 were confirmed to be differentially expressed, respectively. Tropomyosin (TPM) 1, TPM 2, and TPM3 were subjected to verification by quantitative PCR and western blot analysis in IMAT and OMAT of Hanwoo cows, steers, and bulls as key factors closely associated with muscle development. Both mRNA levels and protein levels of TPM1, TPM2, and TPM3 in IMAT were lower in bulls compared to in cows or steers suggesting that they were positively correlated with marbling score and quality grade. Our results may aid the regulation of marbling development and improvement of meat quality grades in beef cattle.
Keywords: Adipose Depots, Hanwoo, Liquid Chromatography-tandem Mass Spectrometry, Marbling, Meat Quality
INTRODUCTION
One important goal of farm animal industry is to produce high quality beef. Beef quality is normally defined by the compositional quality (lean to fat ratio) and the palatability factors such as visual appearance, smell, firmness, juiciness, tenderness, and flavor. Many studies have indicated that meat tenderness is not only affected by protein composition of muscle fibers, but also by handling and slaughtering conditions, genetic traits, and growth progress. In addition, there is some connection between tenderness and flavor through marbling of meat (Hughes et al., 2014).
Generally, marbling means the amount of intramuscular fat (Purslow, 2005; Nishimura, 2010), one of the main factors used to determine beef quality and grade in Korea. Marbling is a very important and valuable trait in the beef cattle industry (Lee et al., 2007). Previous studies have found a relationship between marbling score and percent intramuscular fat (Jeong et al., 2012; Walter et al., 2014). Therefore, the content and distribution of body fats are of special interest for production efficiency and meat quality in farm animal industry (Gondret et al., 2008).
Contents and deposition of intramuscular fat can be influenced by several factors, including sex, age, breed, genotype, nutrition, and environmental factors (Maltin et al., 2003; Hausman et al., 2006). Generally, steers have more intramuscular fat, higher marbling score (Destefanis et al., 2003; Schreurs et al., 2008), and more tender meat (Peachey et al., 2002; Purchas et al., 2002) than bulls. Fat storage in cattle muscle is correlated with intramuscular fat percentage (Guo et al., 2014) because the hormonal status of beef cattle from different sex is related to meat quality characteristics, such as tenderness, fat, and protein distribution (Fritsche and Steinhart, 1998). Particularly, castration dramatically increases intramuscular fat deposition, resulting in improved beef quality in Korean cattle (Park et al., 2002).
The effects of sex steroid hormonal status, including testosterone, androgen, and estrogen, on muscle tissue and myogenic satellite cells (MSCs) have been well studied (Inoue et al., 1994; Arnold et al., 1996; Kahlert et al., 1997; Lee, 2002; Sinha-Hikim et al., 2003; Enns et al., 2008).
MSCs are adult stem cells that activate and differentiate into myotubes. Our previous studies investigated the importance of hormonal components in MSC growth and lipid droplets accumulation (Lee et al., 2011). The effect of natural hormones in adult bovine serum (cow, steer, and bull serum) in MSC proliferation was observed. We found that MSC proliferation was the highest in media supplemented with bull serum followed by cow and steer serum. Lipid droplets accumulation was increased in myotubes when MSCs were treated with 17β-estradiol (E2) followed by E2+testosterone or testosterone treatment alone. This may be due to various hormonal components present in the different sera. Our data have demonstrated that sex hormones are key factors affecting the proliferation of MSCs and lipid accumulation in myotubes (Lee et al., 2011).
However, factors important for the improvement of beef quality grade with sex and hormonal differences are not clearly understood in vivo. Therefore, identification of differentially expressed proteins in adipose depots of different sexes might be helpful in defining the functions of intramuscular fat, therefore providing strategies to control meat lipid content independently of body fat depots. The objective of this study was to determine whether proteins involved in depot specific adipose tissue properties were sex dependent. We analyzed the proteome expression of intramuscular adipose tissue (IMAT) and omental adipose tissue (OMAT) in native Hanwoo Korean beef cattle (cows, steers, and bulls) by liquid chromatography-tandem mass spectrometry (LC-MS/MS)–based proteomic analysis, quantitative polymerase chain reaction (PCR), and western blot analysis.
MATERIALS AND METHODS
Animals and sample collection
All experimental procedures involving animals were approved by the National Institute of Animal Science Institutional Animal Use and Care Committee (NIASIAUCC) and conducted in accordance with the Animal Experimental Guidelines provided by NIASIAUCC in Republic of Korea. We used adipose tissue samples of cows (n = 7), steers (n = 7), and bulls (n = 7). Tissue samples were collected in three animals groups from two different adipose depots (i.e. intramuscular and omental). Slaughter age was approximately 31 months for all cattles. Carcass weight was 406.1±13.4, 452.6±12.3, and 490.9±13.6 kg for cows, steers, and bulls, respectively.
Gel electrophoresis and silver staining
Adipose tissues were collected from cows, steers, and bulls. Total protein isolation was performed using PRO-PREP protein extraction solution (iNtRON Biotechnology, Seoul, Korea) according to the manufacturer’s instructions. Proteins eluted were measured using Pierce BCA Protein Assay Kit (Thermo scientific, Rockford, IL, USA). Equal amounts of protein samples were precipitated with cold acetone. Protein pellets were dissolved in 1× sodium dodecyl sulphate (SDS) sample buffer and separated by 12% sodium dodecyl sulphate–polyacrylamide gel electrophoresis (SDS-PAGE). Following SDS-PAGE, protein spots were visualized using protocols described in the PlusOne Silver staining kit (GE Healthcare Bio-Sciences, Uppsala, Sweden). Complete protocol was followed for analytical gels. For preparative gels, the protocol was modified. Glutaraldehyde was omitted from the sensitization step. Formaldehyde was omitted from the silver reaction step (Yan et al., 2000). Silver-stained gels were scanned (UMAX PowerLook 2100KL Imaging system, UMAX, Taiwan) and protein profiles were compared.
Liquid chromatography-tandem mass spectrometry (LC-MS/MS)
The resulting tryptic peptides were separated and analyzed using reversed-phase capillary high-performance liquid chromatography directly coupled to a Thermo LTQ Orbitrap mass spectrometer following the procedure described by Zuo et al. (2001) with slight modifications. Briefly, both a 0.075×20 mm trapping column and a 0.075× 120 mm resolving column were packed with C18AQ 218MS low formic acid C18 beads (5 μm in size, 200Å pore size; C18AQ, Michrom BioResources, Auburn, CA, USA) and placed in-line. Peptides were bound to the trapping column for 10 min with 2% (vol/vol) aqueous cetonitrile containing 0.1% (vol/vol) formic acid. The bound peptides were eluted with a gradient of 2% to 90% (vol/vol) acetonitrile containing 0.1% (vol/vol) formic acid at a flow rate of 0.2 μL/min. For tandem mass spectrometry, full mass scan range mode was set at m/z = 50 to 2,000 Da. After determining the charge states of the ion zoom scans, product ion spectra were acquired in MS/MS mode with relative collision energy of 55%. Individual spectrum from MS/MS was processed using Protein discoverer 2.1 software (Thermo scientific, USA). The generated peak list files were used to query either the MSDB or the NCBI database using MASCOT program (http://www.matrixscience.com). We took into account modifications of methionine and cysteine, peptide mass tolerance at 2 Da, MS/MS ion mass tolerance at 0.8 Da, allowance of missed cleavage at 2, and charge states (namely, +1, +2, and +3). Only significant hits defined by MASCOT probability analysis were initially considered.
RNA extraction and real-time PCR analysis
Adipose tissues were collected from cows, steers, and bulls. Total RNA isolation was performed using TRIzol reagent (Invitrogen, Grand Island, NY, USA) according to the manufacturer’s instructions. Briefly, total RNA levels were quantified at absorbance of 260 nm. RNA integrity was evaluated by 1.2% (w/v) agarose gel. Total RNA (2 μg amounts) was reverse-transcribed into cDNA using QuantiTect Reverse Transcription Kit (Qiagen, Chatsworth, CA, USA) according to the manufacturer’s instructions. Real-time PCR was performed with SYBR green Premix Ex Taq II (Takara, Dalian, China) using Applied Biosystems StepOne Plus Real-time PCR System (Applied Biosystems, Carlsbad, CA, USA). The expression of β-actin was used as the endogenous control. Relative quantification analysis was performed using the comparative Ct (2−ΔΔCt) method (Wilting et al., 2010). Primers used in the study are listed in Table 1.
Table 1.
Primer sequences used to generate templates for RT-PCR and real-time PCR
| Gene name | Symbol | GenBank ID | Primer sequence (5′→3′) | Product size (bp) |
|---|---|---|---|---|
| Tropomyosin 2 | TPM2 | NM_001010995 | F: CAT TCT GCT CCG GAT ATG GT R: GCC GAG CTA CTT CAT TCT GG |
211 |
| Actin, alpha 1, skeletal muscle | ACTA1 | NM_174225 | F: GAGCGTGGCTACTCCTTCGT R: GGTGGCCATTTCGTTCTCAA |
105 |
| Aldolase A, fructose-bisphosphate | ALDOA | NM_001101915 | F: CCACGCCTGTACCCAGAAAT R: CTCCGGACAGGAAGGTGATC |
110 |
| Tropomyosin 1 | TPM1 | NM_001013590 | F: GGATGCCGACCGCAAGTAT R: GCACATTTGCCTTCTGAAAGC |
105 |
| Glyceraldehyde-3-phosphate dehydrogenase | GAPDH | NM_001034034 | F: CATCTCCGCCACACTGAGAA R: AAGGCAGGGCTCCCTAAGC |
90 |
| Lactate dehydrogenase B | LDHB | NM_174100 | F: CAGTCCTGCCTGCATCATCA R: TCACACGGTGCTTGGGTAATC |
95 |
| Triosephosphate isomerase 1 | TPI1 | NM_001013589 | F: GAGAAGGTCGTTTTCGAGCAA R: CAGTACCAATGGCCCACACA |
100 |
| Tropomyosin 3 | TPM3 | NM_001011674 | F: CTGAGAGATCGGTAGCCAAGCT R: CTCCTCGCTAATGGCCTTGT |
95 |
| Enolase 3 | ENO3 | NM_001034702 | F: CCCGACAAGGTGGTGATTG R: GCAGGGTCGTCAGGTGACTT |
95 |
| Carbonic anhydrase III | CA3 | NM_001034437 | F: CACAGCGTGGATGGAGTCAA R: TACCATCGGCATGCTTCAGA |
100 |
| Phosphoglucomutase 1 | PGM1 | NM_001076903 | F: ACCCCAACTGGCTGGAAGTT R: CACGGATGTGGTCAGAACCA |
100 |
| Lactate dehydrogenase A | LDHA | NM_174099 | F: TCAGCTCGCTTCCGTTATCTC R: CACCATGCTCCCCAAGGAT |
85 |
| Phosphoglycerate mutase 2 | PGAM2 | NM_001038111 | F: ATCTGGAGGCGCTCCTTTG R: CGCTCCTTGCTGATGGACTT |
80 |
| Phosphorylase, glycogen | PYGM | NM_175786 | F: GGCCTGCTTTCTGGACTCAA R: TGCCAACCCCCAGAGATCT |
105 |
| Pyruvate kinase | PKM | NM_001205727 | F: CCTGCCTGCTGTGTCAGAAA R: AAGCCTTGCGGATGAAAGAC |
95 |
| Malate dehydrogenase 1 | MDH1 | NM_001034628 | F: TGGATGTGGCCATTCTTGTG R: GCACCCTGGCATTTGAAGAT |
100 |
PCR, polymerase chain reaction.
Statistical analysis
Data are reported as the mean±standard deviation of at least three independent experiments. Statistical significance was evaluated using Student’s t-test. Compared to the vehicle control, p<0.05 were considered significant.
RESULTS AND DISCUSSION
Carcass characteristics
We used cows (636 kg live weight), steers (762 kg live weight), and bulls (832 kg live weight) at normal slaughter age (31 months) in Korea. Generally, Korean beefs are slaughtered routinely at 29 to 32 month of age to increase marbling and quality grade (Choy et al., 2012). Carcass characteristics of a subset data of the cows, steers, and bulls used for proteomic analysis are summarized in Table 2. Bulls had significantly (p<0.05) heavier carcass weight with lower trend backfat thickness. Bulls also had significantly (p<0.05) lower marbling scores, quality grade, and better yield grade. Our result was mostly in consistent with the effect of castration on meat quality in Korean cattle reported in a previous study (Jeong et al., 2013).
Table 2.
Carcass characteristics among cows, steers, and bulls that were used in proteomic analysis
| Variables | Cows (n = 7) | Steers (n = 7) | Bulls (n = 7) |
|---|---|---|---|
| Age (mo) | 31.43±0.30 | 31.67±0.16 | 31.56±0.24 |
| Carcass weight (kg) | 406.10±13.37b | 452.60±12.28a | 490.90±13.59a |
| Backfat thickness (mm) | 19.14±1.90a | 16.67±1.51a | 7.67±1.48b |
| Rib-eye area (cm2) | 90.57±2.45b | 91.22±1.72b | 100.90±3.46a |
| Yield index | 61.47±1.47b | 61.99±1.18b | 67.95±0.97a |
| Yield grade1 | 142.90±20.20b | 155.60±16.67b | 277.78±14.70a |
| Marbling score2 | 4.71±0.47b | 6.89±0.37a | 1.00±0.00c |
| Quality grade3 | 32.86±1.84b | 38.89±1.05a | 10.00±0.00c |
Mean±standard error of the mean.
Means in row with different superscripts differ (p<0.05).
Yield grade: 300 = A, 200 = B, 100 = C.
Marbling score: 1 = trace, 9 = very abundant.
Quality grade: 40 = 1++ or 1+, 30 = 1, 20 = 2, 10 = 3.
Protein profiles in IMAT and OMAT from Hanwoo cows, steers and bulls
To obtain a comprehensive overview of protein components in IMAT and OMAT from individual seven groups (cows, steers, and bulls), protein profiles of whole lysate of IMAT and OMAT were separated by SDS-PAGE and assessed by silver-stained image analysis. The number, marbling score, and quality grade of individuals were showed in Figure 1A. The patterns of total proteins in IMAT and OMAT were similar to each other. However, IMAT components were significantly different from OMAT components (Figure 1B).
Figure 1.

Protein profiles of intramuscular adipose tissue (IMAT) and omental adipose tissue (OMAT) from Hanwoo cows, steers and bulls by image analysis. (A) Number, marbling score, and quality grade of individuals; (B) Overall patterns of total protein bands from individuals (1 to 21). Gels were visualized by sliver staining.
Protein identification and gene ontological classification by LC-MS/MS-based proteomic analysis
LC-MS/MS-based proteomic analysis was performed to identify proteins involved in depot specific adipose tissue (i.e. intramuscular and omental) properties associated with sex (cows, steers, and bulls). Of the 55 proteins identified, 44, 40, and 42 proteins were confirmed to be differentially expressed in IMAT of cows, steers, and bulls, respectively. In OMAT of cows, steers, and bulls, 33, 33, and 22 were confirmed to be differentially expressed, respectively (Table 3). All identified proteins were clustered into eight categories based on biological process (BP) using information obtained from the DAVID gene ontology (GO) database (http://david.abcc.ncifcrf.gov) and UniProt (http://www.uniprot.org). Depending on the BP in which the proteins were involved, they were categorized into the following groups (Figure 2A): carbohydrate metabolism (35.7%), glycolysis (19.6%), muscle contraction (10.7%), electron transport (10.7%), protein folding (7.1%), muscle development (5.4%), tricarboxylic acid (TCA) pathway (5.4%), and carbon metabolism (5.4%).
Table 3.
List of total proteins in cows, steers and bulls among identified proteins between IMAT and OMAT
| No | UniProt1 | UniGene2 (NCBI) | Protein identified | Gene name | pI3 | MW (kDa)4 | Seq. Cov (%)5 | Individual ion score6 | |||||
|---|---|---|---|---|---|---|---|---|---|---|---|---|---|
|
| |||||||||||||
| IMAT | OMAT | ||||||||||||
|
|
|
||||||||||||
| Cows | Steers | Bulls | Cows | Steers | Bulls | ||||||||
| 1 | P02070 | Bt.23726 | Hemoglobin subunit beta | HBB | 7.59 | 15.9 | 73.79 | 55.48 | 46.92 | 47.67 | 145.82 | 218.33 | 141.46 |
| 2 | Q5KR48 | Bt.53077 | Tropomyosin beta chain | TPM2 | 4.7 | 32.8 | 62.68 | 90.86 | 84.76 | 146.88 | 6.92 | 5.24 | 0 |
| 3 | P01966 | Bt.10591 | Hemoglobin subunit alpha | HBA | 8.44 | 15.2 | 62.68 | 11.59 | 4.08 | 4.07 | 39.4 | 58.1 | 34.55 |
| 4 | P68138 | Bt.88733 | Actin, alpha skeletal muscle | ACTA1 | 5.39 | 42 | 57.56 | 131.84 | 121.18 | 184.84 | 41.13 | 54.42 | 34.54 |
| 5 | Q3T149 | Bt.4415 | Heat shock protein beta-1 | HSPB1 | 6.4 | 22.4 | 56.72 | 24.45 | 10.58 | 46.52 | 46.03 | 45.34 | 32.87 |
| 6 | A6QLL8 | Bt.22533 | Fructose-bisphosphate aldolase | ALDOA | 8.19 | 39.4 | 43.41 | 60.43 | 58.92 | 88.1 | 21.42 | 12.71 | 8 |
| 7 | Q9XSC6 | Bt.3651 | Creatine kinase M-type | CKM | 7.12 | 43 | 39.9 | 40.7 | 55.66 | 111.25 | 0 | 0 | 0 |
| 8 | Q5KR49 | Bt.109484 | Tropomyosin alpha-1 chain | TPM1 | 4.74 | 32.7 | 39.44 | 79.5 | 72.94 | 116.58 | 6.92 | 5.24 | 0 |
| 9 | F1MHQ4 | Bt.97 | Fatty acid-binding protein, adipocyte | FABP4 | 5.66 | 14.6 | 39.39 | 0 | 5.73 | 0 | 35.8 | 33.58 | 25.77 |
| 10 | P10096 | Bt.87389 | Glyceraldehyde-3-phosphate dehydrogenase | GAPDH | 8.35 | 35.8 | 39.04 | 31.57 | 41.42 | 78.81 | 4.86 | 5.48 | 5.5 |
| 11 | P00171 | Bt.65097 | Cytochrome b5 | CYB5A | 5.03 | 15.3 | 32.09 | 4.3 | 0 | 0 | 6.18 | 0 | 0 |
| 12 | Q5E9B1 | Bt.7736 | L-lactate dehydrogenase B chain | LDHB | 6.44 | 36.7 | 31.44 | 0 | 0 | 3.78 | 29.61 | 27.85 | 13.08 |
| 13 | Q5E956 | Bt.3487 | Triosephosphate isomerase | TPI1 | 6.92 | 26.7 | 31.33 | 9.57 | 20.36 | 30.91 | 2.97 | 3.06 | 0 |
| 14 | Q5KR47 | Bt.55987 | Tropomyosin alpha-3 chain | TPM3 | 4.72 | 32.8 | 30.99 | 44.91 | 43.73 | 72.02 | 6.92 | 5.24 | 0 |
| 15 | Q3ZC09 | Bt.49475 | Beta-enolase | ENO3 | 7.72 | 47.1 | 29.26 | 36.37 | 47.08 | 56.06 | 4.08 | 6.85 | 0 |
| 16 | P02769 | Bt.106669 | Serum albumin | ALB | 6.18 | 69.2 | 28.67 | 109.86 | 79.13 | 110.46 | 269.73 | 283.92 | 213.15 |
| 17 | Q3SZX4 | Bt.49056 | Carbonic anhydrase 3 | CA3 | 7.84 | 29.4 | 26.54 | 21.82 | 33.88 | 46.14 | 0 | 0 | 0 |
| 18 | F1N647 | Bt.30099 | Fatty acid synthase | FASN | 6.46 | 274.1 | 20.7 | 14.41 | 8.42 | 2.37 | 137.1 | 189.72 | 57.99 |
| 19 | Q08DP0 | Bt.59999 | Phosphoglucomutase-1 | PGM1 | 6.81 | 61.6 | 20.28 | 22.64 | 15.64 | 38.83 | 0 | 0 | 0 |
| 20 | P19858 | Bt.3809 | L-lactate dehydrogenase A chain | LDHA | 8 | 36.6 | 18.67 | 16.69 | 22.01 | 35.86 | 0 | 2.11 | 4.31 |
| 21 | F1N2F2 | Bt.23217 | Phosphoglycerate mutase 2 | PGAM2 | 8.9 | 28.7 | 16.21 | 8.57 | 3.86 | 19.32 | 0 | 0 | 0 |
| 22 | P00829 | Bt.4431 | ATP synthase subunit beta, mitochondrial | ATP5B | 5.27 | 56.2 | 15.34 | 11.48 | 4.89 | 11.38 | 19.53 | 17.88 | 10.08 |
| 23 | F1MJ28 | Bt.16003 | Phosphorylase | PYGM | 7.11 | 97.2 | 15.32 | 26.9 | 27.38 | 49.74 | 0 | 0 | 0 |
| 24 | A4IFB3 | Bt.24903 | PLIN protein | PLIN | 6.48 | 55 | 15.12 | 2.26 | 0 | 0 | 22.36 | 10.59 | 7.97 |
| 25 | A5D984 | Bt.40497 | Pyruvate kinase | PKM2 | 7.85 | 57.9 | 14.69 | 25.77 | 20 | 35.69 | 0 | 0 | 0 |
| 26 | Q3T0P6 | Bt.37560 | Phosphoglycerate kinase 1 | PGK1 | 8.27 | 44.5 | 14.15 | 21.27 | 23.79 | 28.73 | 6.91 | 2.59 | 0 |
| 27 | P00570 | Bt.4224 | Adenylate kinase isoenzyme 1 | AK1 | 8.32 | 21.7 | 13.4 | 0 | 0 | 10.91 | 0 | 0 | 0 |
| 28 | A7Z057 | Bt.107001 | 14-3-3 protein gamma | YWHAG | 4.89 | 28.3 | 13.36 | 5.63 | 6.21 | 4.93 | 15.39 | 18.16 | 8.32 |
| 29 | A7E3W4 | Bt.4750 | Transketolase | TKT | 7.14 | 64.8 | 11.58 | 4.49 | 0 | 0 | 26.36 | 29.15 | 11.84 |
| 30 | Q27965 | Bt.49659 | Heat shock 70 kDa protein 1B | HSPA1B | 5.92 | 70.2 | 11.08 | 10.32 | 7.47 | 18.99 | 16.86 | 17.4 | 7.77 |
| 31 | F1MLB8 | Bt.7194 | ATP synthase subunit alpha | ATP5A1 | 9.19 | 59.7 | 9.22 | 14.33 | 6.72 | 12.58 | 8.05 | 10.82 | 6.99 |
| 32 | Q3ZBY4 | Bt.49614 | Fructose-bisphosphate aldolase | ALDOC | 6.65 | 39.4 | 9.07 | 18.16 | 17.87 | 24.52 | 6.22 | 4.62 | 0 |
| 33 | Q3ZBD7 | Bt.49587 | Glucose-6-phosphate isomerase | GPI | 7.71 | 62.8 | 8.62 | 7.58 | 2.57 | 9.5 | 3.34 | 0 | 0 |
| 34 | Q3T100 | Bt.1157 | Microsomal glutathione S-transferase 3 | MGST3 | 9.54 | 16.9 | 8.55 | 2.99 | 0 | 0 | 5.93 | 3.05 | 3.63 |
| 35 | F1MB08 | Bt.22783 | Alpha-enolase | ENO1 | 6.8 | 47.3 | 8.53 | 18.17 | 10.23 | 15.29 | 4.08 | 6.85 | 0 |
| 36 | P42028 | Bt.5483 | NADH dehydrogenase | NDUFS8 | 6.87 | 23.9 | 8.02 | 2.09 | 4.12 | 0 | 0 | 0 | 0 |
| 37 | P13696 | Bt.59089 | Phosphatidylethanolamine-binding protein 1 | PEBP1 | 7.49 | 21 | 7.49 | 0 | 2.84 | 2.91 | 4.85 | 5.79 | 0 |
| 38 | P19120 | Bt.12309 | Heat shock cognate 71 kDa protein | HSPA8 | 5.52 | 71.2 | 7.38 | 8.51 | 5.57 | 6.4 | 12.02 | 9.82 | 3.82 |
| 39 | F1N7W0 | Bt.15246 | Uncharacterized protein | MGC152281 | 8.79 | 36.2 | 7.27 | 0 | 2.3 | 0 | 0 | 0 | 0 |
| 40 | P15690 | Bt.4777 | NADH-ubiquinone oxidoreductase 75 kDa subunit | NDUFS1 | 6.15 | 79.4 | 6.74 | 0 | 2.57 | 0 | 0 | 0 | 0 |
| 41 | P00432 | Bt.48925 | Catalase | CAT | 7.28 | 59.9 | 6.45 | 2.12 | 0 | 0 | 8.86 | 9.6 | 10.08 |
| 42 | Q8MKH7 | Bt.11215 | Troponin T fast skeletal muscle type | TNNT3 | 8.1 | 29.8 | 6 | 0 | 0 | 5.92 | 0 | 0 | 0 |
| 43 | Q0V7M4 | Bt.46979 | Calcium-binding mitochondrial carrier protein SCaMC-2 | SLC25A25 | 8.43 | 52.7 | 5.97 | 3.39 | 0 | 3.4 | 0 | 0 | 0 |
| 44 | F1MGE7 | Bt.62768 | Sarcoplasmic/endoplasmic reticulum calcium ATPase 1 | ATP2A1 | 5.27 | 109.2 | 5.74 | 8.57 | 10.49 | 12.02 | 0 | 0 | 0 |
| 45 | Q08DM3 | Bt.6984 | Malic enzyme | ME2 | 7.65 | 65.4 | 5.31 | 0 | 0 | 2.37 | 0 | 0 | 0 |
| 46 | Q1LZ96 | Bt.59430 | ATP synthase mitochondrial F1 complex assembly factor 2 | ATPAF2 | 7.46 | 32.8 | 4.15 | 0 | 7.41 | 5.64 | 0 | 0 | 0 |
| 47 | G1K1H1 | Bt.7915 | Malate dehydrogenase | MDH2 | 9.7 | 29.9 | 3.97 | 2.27 | 0 | 0 | 2.37 | 2.18 | 0 |
| 48 | E1BLB2 | Bt.29035 | Uncharacterized protein | TNFAIP1 | 7.84 | 36.1 | 3.8 | 2.21 | 0 | 0 | 0 | 2.17 | 0 |
| 49 | Q5E9C1 | Bt.16018 | Caspase-4 | CASP4 | 6.18 | 43 | 3.71 | 2.23 | 2.25 | 4.29 | 0 | 0 | 0 |
| 50 | Q29RL6 | Bt.46395 | Uncharacterized protein | VAT1L | 5.1 | 45.8 | 3.58 | 3.77 | 0 | 0 | 0 | 0 | 0 |
| 51 | Q8MKH6 | Bt.4160 | Troponin T, slow skeletal muscle | TNNT1 | 5.87 | 31.3 | 3.42 | 2.07 | 5.48 | 3.78 | 0 | 0 | 0 |
| 52 | P02453 | Bt.23316 | Collagen alpha-1(I) chain | COL1A1 | 5.78 | 138.9 | 3.42 | 6.11 | 4.35 | 8.69 | 0 | 3.35 | 2.86 |
| 53 | F1MYC8 | Bt.3961 | Calpain-3 | CAPN3 | 6.29 | 82.6 | 3.39 | 4.6 | 0 | 0 | 2.36 | 4.66 | 4.79 |
| 54 | Q3T145 | Bt.5345 | Malate dehydrogenase, cytoplasmic | MDH1 | 6.58 | 36.4 | 2.99 | 0 | 0 | 4.41 | 0 | 0 | 0 |
| 55 | G5E6M7 | Bt.24449 | Succinate dehydrogenase | SDHA | 7.62 | 73.2 | 2.11 | 2.92 | 0 | 0 | 3.01 | 3.19 | 0 |
IMAT, intramuscular adipose tissue; OMAT, omental adipose tissue.
UniProt, accession number in the UniProt database.
UniGene: UniGene number from NCBI (National Center for Biotechnology Information) database.
pI, isoelectric point of the protein.
MW (kDa), molecular weight of the protein.
Seq. Cov (%), percentage of sequence coverage.
Individual ion score, TurboSEQUEST or gMASCOT score.
Figure 2.

Ontological classification of differentially regulated proteins in intramuscular adipose tissue (IMAT) and omental adipose tissue (OMAT) from Hanwoo cows, steers and bulls. Of the 55 identified proteins, 44, 40, and 42 proteins were differentially expressed in IMAT of cows, steers, and bulls, respectively. In OMAT, 33, 33, and 22 were differentially expressed in cows, steers, and bulls, respectively (A) Identified proteins were clustered into eight categories based on their biological processes. Representative category of the 16 up- or down-regulated proteins between IMAT and OMAT of cows, steers, and bulls; (B) Depending on the reactome-pathway, the proteins were clustered into five categories; (C) Depending on the panther-biological processes, the proteins were clustered into six categories.
A total of 16 up- or down-regulated proteins between IMAT and OMAT of cows, steers, and bulls were selected. GO analysis was performed using DAVID Bioinformatics Resources 6.7 categories both Reactome-Pathway and Panther-BP. Depending on the Reactome-Pathway in which the protein was involved, the 16 proteins were categorized into the following five groups (Figure 2B): metabolism of carbohydrates (37%), integration of energy metabolism (22.2%), diabetes pathways (22.2%), muscle development (11.1%), and TCA cycle (7.4%). Depending on the Panther-BP in which the protein was involved, they were categorized into the following six groups (Figure 2C): carbohydrate metabolism (33.3%), glycolysis (23.3%), cell structure (13.3%), muscle development (10%), muscle contraction (10%), and cell motility (10%) (Table 4). The expression changes of the up- and down-regulated proteins in IMAT and OMAT of cows, steers, and bulls depending on the Reactome-Pathway were summarized in Table 4. The mRNA expression patterns of the 16 selected proteins were further analyzed by real-time PCR.
Table 4.
Reactome pathway related proteins in cows, steers and bulls among identified proteins between IMAT and OMAT
| No | UniProt1 | UniGene2 (NCBI) | Protein identified | Gene name | pI3 | MW (kDa)4 | Seq. Cov (%)5 | Individual ion score6 | |||||
|---|---|---|---|---|---|---|---|---|---|---|---|---|---|
|
| |||||||||||||
| IMAT | OMAT | ||||||||||||
|
|
|
||||||||||||
| Cows | Steers | Bulls | Cows | Steers | Bulls | ||||||||
| Metabolism of carbohydrates | |||||||||||||
| 1 | Q3SZX4 | Bt.49056 | Carbonic anhydrase 3 | CA3 | 7.84 | 29.4 | 26.54 | 21.82 | 33.88 | 46.14 | 0 | 0 | 0 |
| 2 | Q08DP0 | Bt.59999 | Phosphoglucomutase-1 | PGM1 | 6.81 | 61.6 | 20.28 | 22.64 | 15.64 | 38.83 | 0 | 0 | 0 |
| 3 | F1MJ28 | Bt.16003 | Phosphorylase | PYGM | 7.11 | 97.2 | 15.32 | 26.9 | 27.38 | 49.74 | 0 | 0 | 0 |
| 4 | Q3T145 | Bt.5345 | Malate dehydrogenase, cytoplasmic | MDH1 | 6.58 | 36.4 | 2.99 | 0 | 0 | 4.41 | 0 | 0 | 0 |
| Integration of energy metabolism/Diabetes pathways | |||||||||||||
| 5 | A6QLL8 | Bt.22533 | Fructose-bisphosphate aldolase A | ALDOA | 8.19 | 39.4 | 43.41 | 60.43 | 58.92 | 88.1 | 21.42 | 12.71 | 8 |
| 6 | P10096 | Bt.87389 | Glyceraldehyde-3-phosphate dehydrogenase | GAPDH | 8.35 | 35.8 | 39.04 | 31.57 | 41.42 | 78.81 | 4.86 | 5.48 | 5.5 |
| 7 | Q5E956 | Bt.3487 | Triosephosphate isomerase | TPI1 | 6.92 | 26.7 | 31.33 | 9.57 | 20.36 | 30.91 | 2.97 | 3.06 | 0 |
| 8 | Q3ZC09 | Bt.49475 | Beta-enolase | ENO3 | 7.72 | 47.1 | 29.26 | 36.37 | 47.08 | 56.06 | 4.08 | 6.85 | 0 |
| 9 | F1N2F2 | Bt.23217 | Phosphoglycerate mutase 2 | PGAM2 | 8.9 | 28.7 | 16.21 | 8.57 | 3.86 | 19.32 | 0 | 0 | 0 |
| 10 | A5D984 | Bt.40497 | Pyruvate kinase | PKM2 | 7.85 | 57.9 | 14.69 | 25.77 | 20 | 35.69 | 0 | 0 | 0 |
| Muscle development | |||||||||||||
| 11 | Q5KR48 | Bt.53077 | Tropomyosin beta chain | TPM2 | 4.7 | 32.8 | 62.68 | 90.86 | 84.76 | 146.88 | 6.92 | 5.24 | 0 |
| 12 | P68138 | Bt.88733 | Actin, alpha skeletal muscle | ACTA1 | 5.39 | 42 | 57.56 | 131.84 | 121.18 | 184.84 | 41.13 | 54.42 | 34.54 |
| 13 | Q5KR49 | Bt.109484 | Tropomyosin alpha-1 chain | TPM1 | 4.74 | 32.7 | 39.44 | 79.5 | 72.94 | 116.58 | 6.92 | 5.24 | 0 |
| 14 | Q5KR47 | Bt.55987 | Tropomyosin alpha-3 chain | TPM3 | 4.72 | 32.8 | 30.99 | 44.91 | 43.73 | 72.02 | 6.92 | 5.24 | 0 |
| TCA cycle | |||||||||||||
| 15 | Q5E9B1 | Bt.7736 | L-lactate dehydrogenase B chain | LDHB | 6.44 | 36.7 | 31.44 | 0 | 0 | 3.78 | 29.61 | 27.85 | 13.08 |
| 16 | P19858 | Bt.3809 | L-lactate dehydrogenase A chain | LDHA | 8 | 36.6 | 18.67 | 16.69 | 22.01 | 35.86 | 0 | 2.11 | 4.31 |
IMAT, intramuscular adipose tissue; OMAT, omental adipose tissue; TCA, tricarboxylic acid.
UniProt, Accession number in the UniProt database.
UniGene, UniGene number from NCBI (National Center for Biotechnology Information) database.
pI, isoelectric point of the protein.
MW (kDa), molecular weight of the protein.
Seq. Cov (%), percentage of sequence coverage.
Individual ion score, TurboSEQUEST or gMASCOT score.
Quantitative real-time PCR confirmation for selected genes
To study the patterns of gene expression in IMAT and OMAT associated with sex, we used cows, steers, and bulls. The mRNA expression levels of the selected genes were subjected to quantitative real-time PCR with specific primers (Table 1). Previous studies have reported that fructose-bisphosphate aldolase A (ALDOA) mRNA increases during in vitro myogenesis (Colbert and Ciejek-Baez, 1988) are responsible for significant activation during the differentiation of primary myoblasts, therefore playing important roles in muscle gene transcription (Walsh et al., 1980; Hidaka et al., 1993; Ren et al., 2011). Our data showed that ALDOA had significantly higher expression in IMAT than in OMAT in cows (p = 0.0042) and steers (p<0.0001) (Figure 3A and 3B). However, ALDOA had significantly (p<0.0001) lower expression in IMAT than in OMAT in bulls (Figure 3C). These results demonstrated that ALDOA was differentially expressed depending on sex, suggesting that ALDOA could be one of the factors affecting lipid accumulation in OMAT.
Figure 3.
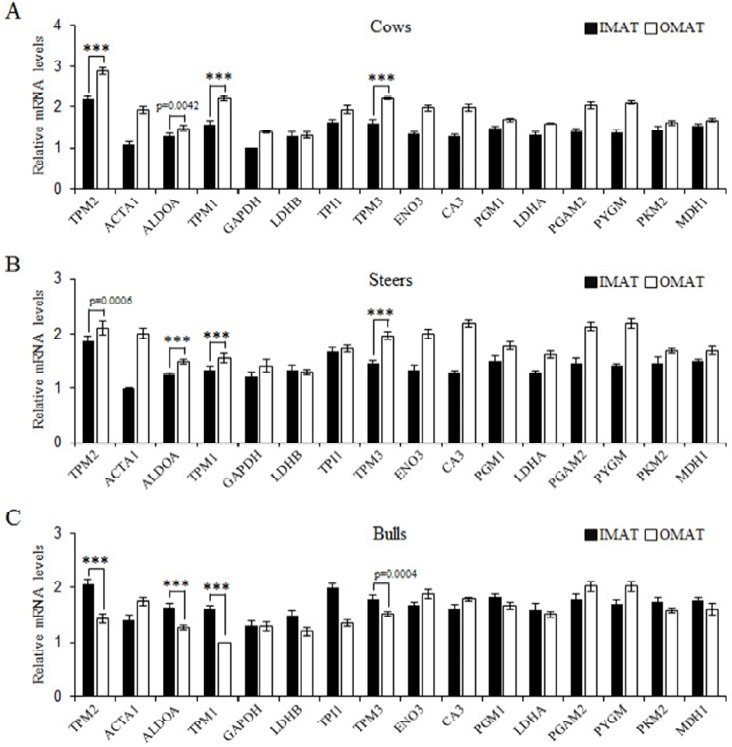
Gene expression levels on intramuscular adipose tissue (IMAT) and omental adipose tissue (OMAT) depending on sex. The quantitative differences of 16 genes at the transcriptional level were measured by real-time polymerase chain reaction in IMAT and OMAT from Hanwoo cows, steers, and bulls. TPM2, tropomyosin 2; ACTA1, actin, alpha 1, skeletal muscle; ALDOA, fructose-bisphosphate aldolase A; TPM1, tropomyosin 1; GAPDH, glyceraldehyde-3-phosphate dehydrogenase; LDHB, lactate dehydrogenase B; TPI1, triosephosphate isomerase 1; TPM3, tropomyosin 3; ENO3, enolase 3; CA3, carbonic anhydrase III; PGM1, phosphoglucomutase 1; LDHA, lactate dehydrogenase A; PGAM2, phosphoglycerate mutase 2; PYGM, phosphorylase, glycogen; PKM, pyruvate kinase; MDH1, malate dehydrogenase 1. Student’s t test was performed to evaluate statistical significance (*** p<0.0001; mean±standard error of the mean; n = 3).
Western blot analysis for selected proteins
We found significant correlations between several factors (including tropomyosin [TPM] 1, TMP2, and TMP3) and gene expression in IMAT and OMAT. TPMs are a family of actin binding proteins in all tissues that are always associated with polymerized actin. TPMs are a diverse group of cytoskeletal proteins found in most eukaryotic cells, with distinct isoforms found in muscle (skeletal, cardiac, and smooth) and various non-muscle cells (Dlugosz et al., 1984; Lin and Lin, 1986). Previous studies have shown that TPM plays a critical role in skeletal muscle development and function (Marston et al., 2013; Zhang et al., 2014). Results of the mRNA levels (upper panels) and protein expression levels (lower panels) of TPM1, TPM2, and TPM3 are shown in Figure 4. Notably, transcriptional and protein levels of TPM1, TPM2, and TPM3 were significantly lower in IMAT of steers compared to cows or bulls. The mRNA and protein levels of TPM1, TPM2, and TPM3 were higher in OMAT of cows than in bulls. In addition, TPM1, TPM2, and TPM3 had higher expression in OMAT than in IMAT in cows and steers, but had lower expression in OMAT than IMAT in bulls. These results demonstrated that TPM1, TPM2, and TPM3 were differentially expressed depending on sex. Adipose depots and TPMs were positively correlated with marbling score and quality grade. Therefore, we suggest that TPM1, TPM2, and TPM3 are key factors closely associated with muscle development and lipid accumulation in Hanwoo cows, steers, and bulls.
Figure 4.

Gene and protein expression levels of tropomyosin (TPM)1, TPM2, and TPM3 in intramuscular adipose tissue (IMAT) and omental adipose tissue (OMAT). The quantitative differences of (A) TPM1, (B) TPM2, and (C) TPM3 at the transcriptional and protein levels were measured by real-time polymerase chain reaction and western blot analysis. Student’s t test was performed to evaluate statistical significance (*** p<0.0001; mean±standard error of the mean; n = 3).
ACKNOWLEDGMENTS
This work was carried out with the support of “Research Program for Agriculture Science & Technology Development (Project No. PJ01203102)” National Institute of Animal Science, Rural Development Administration, Republic of Korea.
Footnotes
CONFLICT OF INTEREST
We certify that there is no conflict of interest with any financial organization regarding the material discussed in the manuscript.
REFERENCES
- Arnold AM, Peralta JM, Thonney ML. Ontogeny of growth hormone, insulin-like growth factor-I, estradiol and cortisol in the growing lamb: Effect of testosterone. J Endocrinol. 1996;150:391–399. doi: 10.1677/joe.0.1500391. [DOI] [PubMed] [Google Scholar]
- Choy YH, Park BH, Choi TJ, Choi JG, Cho KH, Lee SS, Choi YL, Koh KC, Kim HS. Estimation of relative economic weights of hanwoo carcass traits based on carcass market price. Asian Australas J Anim Sci. 2012;25:1667–1673. doi: 10.5713/ajas.2012.12397. [DOI] [PMC free article] [PubMed] [Google Scholar]
- Colbert MC, Ciejek-Baez E. Alternative promoter usage by aldolase A during in vitro myogenesis. Dev Biol. 1988;130:392–396. doi: 10.1016/0012-1606(88)90444-7. [DOI] [PubMed] [Google Scholar]
- Destefanis G, Brugiapaglia A, Barge MT, Lazzaroni C. Effect of castration on meat quality in Piemontese cattle. Meat Sci. 2003;64:215–218. doi: 10.1016/s0309-1740(02)00184-5. [DOI] [PubMed] [Google Scholar]
- Dlugosz AA, Antin PB, Nachmias VT, Holtzer H. The relationship between stress fiber-like structures and nascent myofibrils in cultured cardiac myocytes. J Cell Biol. 1984;99:2268–2278. doi: 10.1083/jcb.99.6.2268. [DOI] [PMC free article] [PubMed] [Google Scholar]
- Enns DL, Iqbal S, Tiidus PM. Oestrogen receptors mediate oestrogen-induced increases in post-exercise rat skeletal muscle satellite cells. Acta Physiol (Oxf) 2008;194:81–93. doi: 10.1111/j.1748-1716.2008.01861.x. [DOI] [PubMed] [Google Scholar]
- Fritsche S, Steinhart H. Differences in natural steroid hormone patterns of beef from bulls and steers. J Anim Sci. 1998;76:1621–1625. doi: 10.2527/1998.7661621x. [DOI] [PubMed] [Google Scholar]
- Gondret F, Guitton N, Guillerm-Regost C, Louveau I. Regional differences in porcine adipocytes isolated from skeletal muscle and adipose tissues as identified by a proteomic approach. J Anim Sci. 2008;86:2115–2125. doi: 10.2527/jas.2007-0750. [DOI] [PubMed] [Google Scholar]
- Guo B, Kongsuwan K, Greenwood PL, Zhou G, Zhang W, Dalrymple BP. A gene expression estimator of intramuscular fat percentage for use in both cattle and sheep. J Anim Sci Biotechnol. 2014;5:35. doi: 10.1186/2049-1891-5-35. [DOI] [PMC free article] [PubMed] [Google Scholar]
- Hausman GJ, Poulos SP, Richardson RL, Barb CR, Andacht T, Kirk HC, Mynatt RL. Secreted proteins and genes in fetal and neonatal pig adipose tissue and stromal-vascular cells. J Anim Sci. 2006;84:1666–1681. doi: 10.2527/jas.2005-539. [DOI] [PubMed] [Google Scholar]
- Hidaka K, Yamamoto I, Arai Y, Mukai T. The MEF-3 motif is required for MEF-2-mediated skeletal muscle-specific induction of the rat aldolase A gene. Mol Cell Biol. 1993;13:6469–6478. doi: 10.1128/mcb.13.10.6469. [DOI] [PMC free article] [PubMed] [Google Scholar]
- Hughes JM, Oiseth SK, Purslow PP, Warner RD. A structural approach to understanding the interactions between colour, water-holding capacity and tenderness. Meat Sci. 2014;98:520–532. doi: 10.1016/j.meatsci.2014.05.022. [DOI] [PubMed] [Google Scholar]
- Inoue K, Yamasaki S, Fushiki T, Okada Y, Sugimoto E. Androgen receptor antagonist suppresses exercise-induced hypertrophy of skeletal muscle. Eur J Appl Physiol Occup Physiol. 1994;69:88–91. doi: 10.1007/BF00867933. [DOI] [PubMed] [Google Scholar]
- Jeong J, Bong J, Kim GD, Joo ST, Lee HJ, Baik M. Transcriptome changes favoring intramuscular fat deposition in the longissimus muscle following castration of bulls. J Anim Sci. 2013;91:4692–4704. doi: 10.2527/jas.2012-6089. [DOI] [PubMed] [Google Scholar]
- Jeong J, Kwon EG, Im SK, Seo KS, Baik M. Expression of fat deposition and fat removal genes is associated with intramuscular fat content in longissimus dorsi muscle of Korean cattle steers. J Anim Sci. 2012;90:2044–2053. doi: 10.2527/jas.2011-4753. [DOI] [PubMed] [Google Scholar]
- Kahlert S, Grohe C, Karas RH, Lobbert K, Neyses L, Vetter H. Effects of estrogen on skeletal myoblast growth. Biochem Biophys Res Commun. 1997;232:373–378. doi: 10.1006/bbrc.1997.6223. [DOI] [PubMed] [Google Scholar]
- Lee DK. Androgen receptor enhances myogenin expression and accelerates differentiation. Biochem Biophys Res Commun. 2002;294:408–413. doi: 10.1016/S0006-291X(02)00504-1. [DOI] [PubMed] [Google Scholar]
- Lee DM, Bajracharya P, Lee EJ, Kim JE, Lee HJ, Chun T, Kim J, Cho KH, Chang J, Hong S, Choi I. Effects of gender-specific adult bovine serum on myogenic satellite cell proliferation, differentiation and lipid accumulation. In Vitro Cell Dev. Biol. Anim.; 2011. pp. 438–444. [DOI] [PubMed] [Google Scholar]
- Lee SH, Park EW, Cho YM, Kim SK, Lee JH, Jeon JT, Lee CS, Im SK, Oh SJ, Thompson JM, Yoon D. Identification of differentially expressed genes related to intramuscular fat development in the early and late fattening stages of hanwoo steers. J Biochem Mol Biol. 2007;40:757–764. doi: 10.5483/bmbrep.2007.40.5.757. [DOI] [PubMed] [Google Scholar]
- Lin JJ, Lin JL. Assembly of different isoforms of actin and tropomyosin into the skeletal tropomyosin-enriched microfilaments during differentiation of muscle cells in vitro. J Cell Biol. 1986;103:2173–2183. doi: 10.1083/jcb.103.6.2173. [DOI] [PMC free article] [PubMed] [Google Scholar]
- Maltin C, Balcerzak D, Tilley R, Delday M. Determinants of meat quality: tenderness. Proc Nutr Soc. 2003;62:337–347. doi: 10.1079/pns2003248. [DOI] [PubMed] [Google Scholar]
- Marston S, Memo M, Messer A, Papadaki M, Nowak K, McNamara E, Ong R, El-Mezgueldi M, Li X, Lehman W. Mutations in repeating structural motifs of tropomyosin cause gain of function in skeletal muscle myopathy patients. Hum Mol Genet. 2013;22:4978–4987. doi: 10.1093/hmg/ddt345. [DOI] [PMC free article] [PubMed] [Google Scholar]
- Nishimura T. The role of intramuscular connective tissue in meat texture. Anim Sci J. 2010;81:21–27. doi: 10.1111/j.1740-0929.2009.00696.x. [DOI] [PubMed] [Google Scholar]
- Park GB, Moon SS, Ko YD, Ha JK, Lee JG, Chang HH, Joo ST. Influence of slaughter weight and sex on yield and quality grades of Hanwoo (Korean native cattle) carcasses. J Anim Sci. 2002;80:129–136. doi: 10.2527/2002.801129x. [DOI] [PubMed] [Google Scholar]
- Peachey BM, Purchas RW, Duizer LM. Relationships between sensory and objective measures of meat tenderness of beef m. longissimus thoracis from bulls and steers. Meat Sci. 2002;60:211–218. doi: 10.1016/s0309-1740(01)00123-1. [DOI] [PubMed] [Google Scholar]
- Purchas RW, Burnham DL, Morris ST. Effects of growth potential and growth path on tenderness of beef longissimus muscle from bulls and steers. J Anim Sci. 2002;80:3211–3221. doi: 10.2527/2002.80123211x. [DOI] [PubMed] [Google Scholar]
- Purslow PP. Intramuscular connective tissue and its role in meat quality. Meat Sci. 2005;70:435–447. doi: 10.1016/j.meatsci.2004.06.028. [DOI] [PubMed] [Google Scholar]
- Ren H, Li L, Su H, Xu L, Wei C, Zhang L, Li H, Liu W, Du L. Histological and transcriptome-wide level characteristics of fetal myofiber hyperplasia during the second half of gestation in Texel and Ujumqin sheep. BMC Genomics. 2011;12:411. doi: 10.1186/1471-2164-12-411. [DOI] [PMC free article] [PubMed] [Google Scholar]
- Schreurs NM, Garcia F, Jurie C, Agabriel J, Micol D, Bauchart D, Listrat A, Picard B. Meta-analysis of the effect of animal maturity on muscle characteristics in different muscles, breeds, and sexes of cattle. J Anim Sci. 2008;86:2872–2887. doi: 10.2527/jas.2008-0882. [DOI] [PubMed] [Google Scholar]
- Sinha-Hikim I, Roth SM, Lee MI, Bhasin S. Testosterone-induced muscle hypertrophy is associated with an increase in satellite cell number in healthy, young men. Am J Physiol Endocrinol Metab. 2003;285:E197–205. doi: 10.1152/ajpendo.00370.2002. [DOI] [PubMed] [Google Scholar]
- Walsh TP, Winzor DJ, Clarke FM, Masters CJ, Morton DJ. Binding of aldolase to actin-containing filaments. Evidence of interaction with the regulatory proteins of skeletal muscle. Biochem J. 1980;186:89–98. doi: 10.1042/bj1860089. [DOI] [PMC free article] [PubMed] [Google Scholar]
- Walter LJ, Gasch CA, McEvers TJ, Hutcheson JP, Defoor P, Marquess FL, Lawrence TE. Association of pro-melanin concentrating hormone genotype with beef carcass quality and yield. J Anim Sci. 2014;92:325–331. doi: 10.2527/jas.2013-6931. [DOI] [PubMed] [Google Scholar]
- Wilting SM, van Boerdonk RA, Henken FE, Meijer CJ, Diosdado B, Meijer GA, le Sage C, Agami R, Snijders PJ, Steenbergen RD. Methylation-mediated silencing and tumour suppressive function of hsa-miR-124 in cervical cancer. Mol Cancer. 2010;9:167. doi: 10.1186/1476-4598-9-167. [DOI] [PMC free article] [PubMed] [Google Scholar]
- Yan JX, Wait R, Berkelman T, Harry RA, Westbrook JA, Wheeler CH, Dunn MJ. A modified silver staining protocol for visualization of proteins compatible with matrix-assisted laser desorption/ionization and electrospray ionization-mass spectrometry. Electrophoresis. 2000;21:3666–3672. doi: 10.1002/1522-2683(200011)21:17<3666::AID-ELPS3666>3.0.CO;2-6. [DOI] [PubMed] [Google Scholar]
- Zhang HM, Su YF, Shi ZY, Fu YS. cDNA clone and expression analysis of alpha-Tropomyosin during Japanese flounder (Paralichthys olivaceus) metamorphosis. Dongwuxue Yanjiu. 2014;35:307–312. doi: 10.13918/j.issn.2095-8137.2014.4.307. [DOI] [PMC free article] [PubMed] [Google Scholar]
- Zuo X, Echan L, Hembach P, Tang HY, Speicher KD, Santoli D, Speicher DW. Towards global analysis of mammalian proteomes using sample prefractionation prior to narrow pH range two-dimensional gels and using one-dimensional gels for insoluble and large proteins. Electrophoresis. 2001;22:1603–1615. doi: 10.1002/1522-2683(200105)22:9<1603::AID-ELPS1603>3.0.CO;2-I. [DOI] [PubMed] [Google Scholar]