Abstract
Background
Increased leucine-rich α2-glycoprotein-1 (LRG1) has been observed in plasma of individuals with various diseases. However, the role of LRG1 in allergic airway disease has not been investigated.
Objective
To explore the involvement of LRG1 in allergy and its cell origins.
Methods
The expression levels of LRG1 and its receptor transforming growth factor-beta receptor II (TGFBR2) in patients with allergic rhinitis (AR) and asthma (AS) were examined by flow cytometry, and enzyme-linked immunosorbent assay (ELISA).
Results
LRG1 and soluble TGFBR2 expression in plasma of patients with AR and AS were markedly lower than that of healthy control (HC) subjects. Large proportions of CD123 + HLA-DR−, CD16+, CD4+, CD8+, CD14+, and CD19+ cells expressed LRG1, although the percentages of LRG1+ cells in these cell populations were lower in AR and AS patients. Up to 89.8 and 15.5 % of dispersed mast cells expressed LRG1 and TGFBR2. Moreover, allergen extract exposure significantly reduced LRG1 and TGFBR2 expression in the plasma and leukocytes of patients with AR and AS.
Conclusions
Reduced LRG1 and TGFBR2 levels in patients with allergic airway disorders are likely caused by inhibitory actions of allergens in LRG1 producing cells. Thus, LRG1 may be a key regulatory factor of allergic responses.
Keywords: LRG1, TGFBR2, Allergic airway disorder, Mast cells, Leukocytes
Background
LRG1 (HGNC: 29480) is a 50-kDa glycoprotein containing 23 % carbohydrate by weight [1]. It consists of 312 amino acids, of which 66 are leucines. The predicted secondary structure suggests that LRG1 may be a membrane-associated or membrane-derived protein [2]. LRG1 belongs to the leucine-rich repeat protein family [3], members of which are commonly involved in signal transduction, cell adhesion, development, DNA repair, recombination, transcription, and RNA processing [4].
LRG1 is expressed during haematopoiesis, especially during differentiation of the neutrophilic granulocyte lineage [5]. It also promotes neovascularization through binding to the accessory receptor endoglin, and activates transforming growth factor beta (TGF-β) signalling in endothelial cells via the TGFBR2 (HGNC: 11773) -ALK-1/Smad1/5/8 pathway [6]. Increased LRG1 levels have been observed in serum or plasma of patients with various types of cancers [7] including lung cancer [8]. It is suggested that LRG1 may be a useful marker of pediatric appendicitis as it was elevated in urine [9] and plasma [10] of children with acute appendicitis and enriched in diseased appendices. Because serum LRG concentrations correlate well with disease activity in ulcerative colitis [11] and rheumatoid arthritis (RA) [12], this novel serum biomarker could be a promising surrogate for C-reactive protein when monitoring disease progression in ulcerative colitis and RA. However, little is known regarding the relationship between this unique glycoprotein and allergic disorders. Since allergy is also an inflammatory and immunological disease, and LRG may play a role in it, we investigated the expression of LRG1 in allergic disorders and its potential cell origins in the present study.
LRG1 is co-expressed with TGFBR2 and contains a putative membrane-binding region, thus suggesting TGFBR2 as a potential cell-surface receptor for LRG1 [13]. Elevated levels of TGFBR2 and LRG1 are observed in the cerebrospinal fluid of patients with idiopathic normal pressure hydrocephalus (INPH) [14], suggesting measuring TGFBR2 and LRG1expression levels may be useful for diagnosing INPH. However, the expression levels of TGFBR2 in the plasma and blood cells under allergic conditions remain uninvestigated. The aim of the study is to investigate the expression levels of LRG1 and its receptor TGFBR2 in the plasma and blood cells under allergic airway conditions.
Methods
Reagents
Type-I collagenase, and type-I hyaluronidase were purchased from Sigma-Aldrich (St Louis, MO, USA). FACS lysing solution and Cytofix/Cytoperm solution were obtained from BD Pharmingen (San Jose, CA, USA). A rabbit anti-human LRG1 antibody, a FITC-conjugated mouse anti-rabbit IgG antibody, and a PE-conjugated mouse anti-rabbit IgG antibody were purchased from LifeSpan BioSciences (Seattle, WA, USA). PerCP-conjugated mouse anti-human CD4, PE/Cy7-conjugated mouse anti-human CD8, APC/CY7-conjugated mouse anti-human CD14, APC-conjugated mouse anti-human CD19, APC/Cy7-conjugated mouse anti-human CD16, PE/Cy7-conjugated mouse anti-human CD123, PerCP-conjugated mouse anti-human HLA-DR, PE/Cy7-conjugated mouse anti-human CD34, PerCP-conjugated mouse anti-human FcεR1, PE-conjugated mouse anti-human CD117, FITC-conjugated mouse anti-human CD90, APC-conjugated mouse anti-human TGFBR2, and PE-conjugated mouse anti-human TGFBR2 antibodies were purchased from BioLegend (San Diego, CA, USA). Allergens for skin prick tests were supplied by ALK-Abelló, Inc. (Denmark). Human LRG1, TGFBR2, and tryptase ELISA kits were purchased from R&D Systems (Minneapolis, MN). Most general-purpose chemicals such as salts and buffer components were of analytical grade.
Patients and samples
A total of 16 AR, 15 AS, 5 combined AR and AS (AR + AS), 8 RA and 15 HC subjects were recruited for the study. AS was diagnosed according to the criteria of the Global Initiative for Asthma [15], and AR and RA diagnosis were based on the allergic rhinitis and its impact on asthma [16] and 2010 RA classification criteria [17], respectively. All patients were asked to stop taking anti-allergy medication for at least 2 weeks prior to participating in the study. The recruited patients did not have any airway infection for >1 month. Informed consent was provided from each volunteer according to the declaration of Helsinki, and this study was approved by the ethical committees of the First Affiliated Hospital of Jinzhou Medical University. The general characteristics of the patients and control subjects are summarized in Table 1. Peripheral venous blood sample was collected into K2EDTA anticoagulant containing tubes from each patient and HC subject, and were immediately processed to collect cells and plasma for analysis. Human tonsillar specimen tissues were removed by tonsillectomy, after which dispersing mast cells and fibroblasts were collected. The protocol for the ethical use of human tissue in research complied with the Declaration of Helsinki (2000) and was approved by the Committees of the First Affiliated Hospital of Jinzhou Medical University.
Table 1.
General characteristics of the patients with rhinitis (AR), asthma (AS), combined rhinitis with asthma (AR + AS), rheumatoid arthritis (RA) or healthy control subjects (HC)
| HC | AR | AS | AR + AS | RA | |
|---|---|---|---|---|---|
| (n = 15) | (n = 16) | (n = 15) | (n = 5) | (n = 8) | |
| Age (year) | 35 (15–65) | 43(17–74) | 47 (18–78) | 43 (16–60) | 48 (20–68) |
| Female/male | 8/7 | 9/7 | 7/8 | 3/2 | 7/1 |
| Median age at onset (year) | na | 36 (7–56) | 42 (10–59) | 43 (6–57) | 40 (18–63) |
| Median disease duration (year) | na | 3.5 (0.5–21) | 3 (0.5–38) | 5 (1–40) | 4 (0.5–42) |
| Blood taken time after the first symptom of the latest attack (h) | na | 12 (5–18) | 9 (4–17) | 8 (3–16) | 12 (6–16) |
| Number of positive skin prick for house dust mite | 0 | 12 | 10 | 3 | 0 |
| Number of positive skin prick for artemisia | 0 | 9 | 3 | 1 | 0 |
| Number of positive skin prick for platanus pollen | 0 | 2 | 5 | 1 | 0 |
| Number of positive skin prick for cat fur | 0 | 4 | 4 | 3 | 0 |
| Number of positive skin prick for dog fur | 0 | 5 | 3 | 0 | 0 |
Median (range) data are shown for the number of subjects indicated. All patients stop using long-acting corticosteroids for at least 2 weeks and any other anti-allergic drugs for 1 week before skin prick being taken
na not applicable
Cell line and culture
A human mast cell line, HMC-1, was a gift from Dr. Joseph H. Butterfield (Mayo Clinic, MN, USA). Cells were cultured in RPMI 1640 medium supplemented with 10 % fetal bovine serum and 1 % penicillin and streptomycin in 75-cm2 tissue culture flasks (Falcon) at 37 °C in a 5 % (v/v) CO2, water-saturated atmosphere.
Flow cytometric analysis of LRG1 and TGFBR2 expression in white blood cells from patients exposed to allergens
To detect LRG1 and TGFBR2 expression on basophilic granulocytes (CD123 + HLA-DR− cells) and neutrophils (CD16+ cells), we added 4 antibodies (APC/CY7-conjugated mouse anti-human CD16, PE/CY7-conjugated mouse anti-human CD123, PerCP-conjugated mouse anti-human HLA-DR, and PE-conjugated mouse anti-human TGFBR2) to 100 μl whole blood, and the cells were labelled for 15 min, according to the manufacturer’s instructions. Following the ligation of red blood cells, white blood cells were fixed and permeabilized. The rabbit anti-human LRG1 antibody were added to 100 μl cell suspensions for 30 min at 4 °C, followed by staining with a FITC-conjugated mouse anti-rabbit IgG antibody. To detect LRG1 and TGFBR2 expression on monocytes (CD14+ cells), helper T cells (CD4+ cells), cytotoxic T cells (CD8+ cells), and B cells (CD19+ cells), we stained cells with the following antibodies: PerCP-conjugated mouse anti-human CD4, PE/Cy7-conjugated mouse anti-human CD8, APC/Cy7-conjugated mouse anti-human CD14, and APC-conjugated mouse anti-human CD19. After washing, the cells were analysed on a fluorescence-activated cell sorting (FACS)Arial flow cytometer with CellDevia software (BD Biosciences, USA).
Peripheral blood challenge with allergen extracts
Peripheral blood samples (1.5 ml) from 8 AR, 8 AS, and 8 HC subjects were incubated with Artemisia sieversiana wild allergen extract (ASWE) at 0.1 and 1.0 μg/ml, Platanus pollen allergen extract (PPE) at 0.1 and 1.0 μg/ml, and house dust mite allergen extract (HDME) at 0.1 and 1.0 μg/ml for 30 min at room temperature. The challenged blood was then processed as above.
Isolation of tissue cells and flow cytometric analysis of LRG1 and TGFBR2 expression
The procedures for dispersing human tonsillar and skin tissue cells were mainly adopted from a previous study by He et al. [18]. Briefly, tonsillar and skin tissues were digested with collagenase, hyaluronidase, and DNase in DMEM. After centrifugation, the cells were fixed using a Cytofix/Cytoperm™ solution. Cells were then incubated with one of the following labelled monoclonal antibodies: PE/Cy7-conjugated mouse anti-human CD34, PerCP-conjugated mouse anti-human FcεR1, PE-conjugated mouse anti-human CD117, FITC-conjugated mouse anti-human CD90, rabbit anti-human LRG1, FITC-conjugated mouse anti-rabbit IgG, PE-conjugated mouse anti-rabbit IgG, or APC-conjugated mouse anti-human TGFBR2, with staining performed for 30 min at 4 °C in the dark. FITC-conjugated mouse IgG1, PE-conjugated mouse IgG1, and APC-conjugated mouse IgG1 were used as isotype control. Cells were analysed on a FACSArial flow cytometer. Data were analysed with CellQuest software.
Time course of LRG1 and TGFBR2 expression in HMC-1 cells
The procedure challenging HMC-1 cells was mainly adopted from a method previously described by Zhang et al. for P815 cells [19]. Briefly, cultured HMC-1 cells at a density of 1 × 10⁶ cells/ml were incubated with ASWE (0.1 and 1.0 μg/ml), PPE (0.1 and 1.0 μg/ml), or HDME (0.1 and 1.0 μg/ml) for 1, 6, or 12 days at 37 °C, changing the culture medium and allergen at every 2 days. The plates were centrifuged at 450×g for 10 min at 4 °C before the culture supernatants (1 ml per well) were collected and stored. Cell pellets containing approximately 1 × 10⁶ cells were resuspended for FACS analysis.
Determination of the expression levels of LRG1, TGFBR2, and cytokines in the plasma of allergic patients
The levels of tryptase, LRG1, and TGFBR2 produced in the plasma of allergic patients were measured using ELISA kits, according to the manufacturer’s instructions.
Statistical analysis
All statistical analyses were performed with SPSS software for windows (version 17.0, IBM Corporation). Data were presented as median (range) for the number of experiments indicated. Where analysis of variance indicated significant differences between groups (Kruskal–Wallis test) for pre-planned comparisons of interests, the Mann–Whitney U test was applied. For all analyses, P < 0.05 was considered statistically significant.
Results
Plasma levels of LRG1, TGFBR2, and tryptase and their correlations
The most direct approach for studying the potential roles of LRG1 in allergic disorders is to examine changes in LRG1 expression under allergic conditions. RA patients were used as a control disease population. Using ELISA kits, we observed that LRG1 levels in the plasma of AR, AS, and RA subjects, but not AR + AS subjects, were markedly lower than that of HC subjects (Fig. 1a). Similarly, soluble TGFBR2 levels in the plasma of AR, AS, RA, and AR + AS groups were also markedly lower than that of those of the HC group (Fig. 1b). In contrast, tryptase levels in the plasma of AR, AS, and AR + AS groups were markedly higher than those of the HC group (Fig. 1c). LRG1 levels correlated well with TGFBR2 production in the plasma of AR, AS, AR + AS, and HC subjects. Tryptase expression was negatively correlated LRG1 and TGFBR2 in plasma samples from AR, AS, and AR + AS subjects (Fig. 1d). Positive skin allergen-testing result of the AR and AS patient population indicates that not all patients respond to the same allergen, and appears not to associate with the plasma levels of LRG1 and TGFBR2.
Fig. 1.
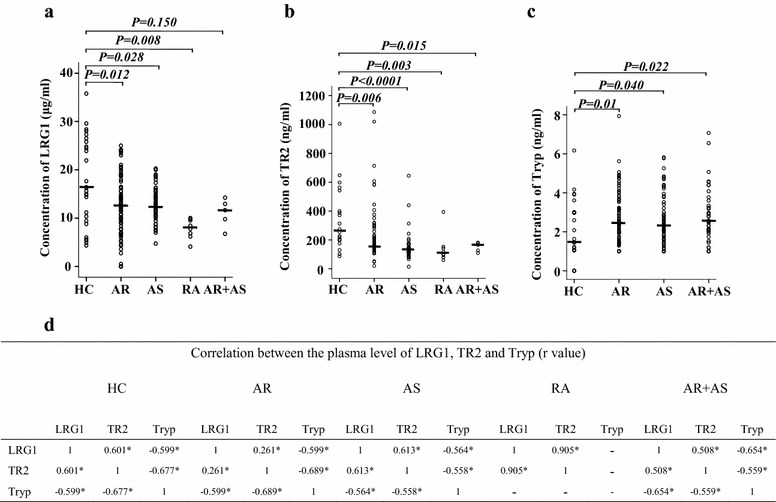
Scatter plots showing the levels of LRG1 (a), TGFBR2 (b, TR2), and tryptase (c, Tryp) in the plasma of patients with allergic rhinitis (AR), asthma (AS), AR + AS, rheumatoid arthritis (RA), and healthy control (HC) subjects. Each symbol represents the value from 1 subject. The median value is indicated with a horizontal line. d Rank correlation (Spearman’s correlation coefficient) between LRG1, TR2, and Tryp. *P < 0.05. na not applicable
LRG1 and TGFBR2 expression in peripheral blood leukocytes
To identify the potential sources of LRG1 and TGFBR2 production, we investigated LRG1 and TGFBR2 expression in peripheral blood leukocytes. The result showed that large proportions of CD123 + HLA-DR−, CD16+, CD4+, CD8+, CD14+, and CD19+ cells expressed LRG1. The percentages of LRG1+ cells in CD123 + HLA-DR−, CD16+, CD4+, CD8+, CD14+, and CD19+ cell populations of AR, AS, and RA patients were lower than those of HC subjects. However, for AR + AS patients, LRG1+ cells were only diminished in CD123 + HLA-DR− and CD8+ cell populations (Fig. 2). No significant difference in the mean fluoresce intensity (MFI) of LRG1 expression was observed between AR, AS, RA or AR + AS, and HC subjects. Decreased LRG1 plasma levels correlated with diminished LRG1 expression in CD123 + HLA-DR−, CD16+, CD4+, CD8+, CD14+, and CD19+ cell populations from AR patients; CD123 + HLA-DR− and CD16 + cells from AS patients; and CD123 + HLA-DR− and CD8+ cells from AR + AS patients (Fig. 3b).
Fig. 2.
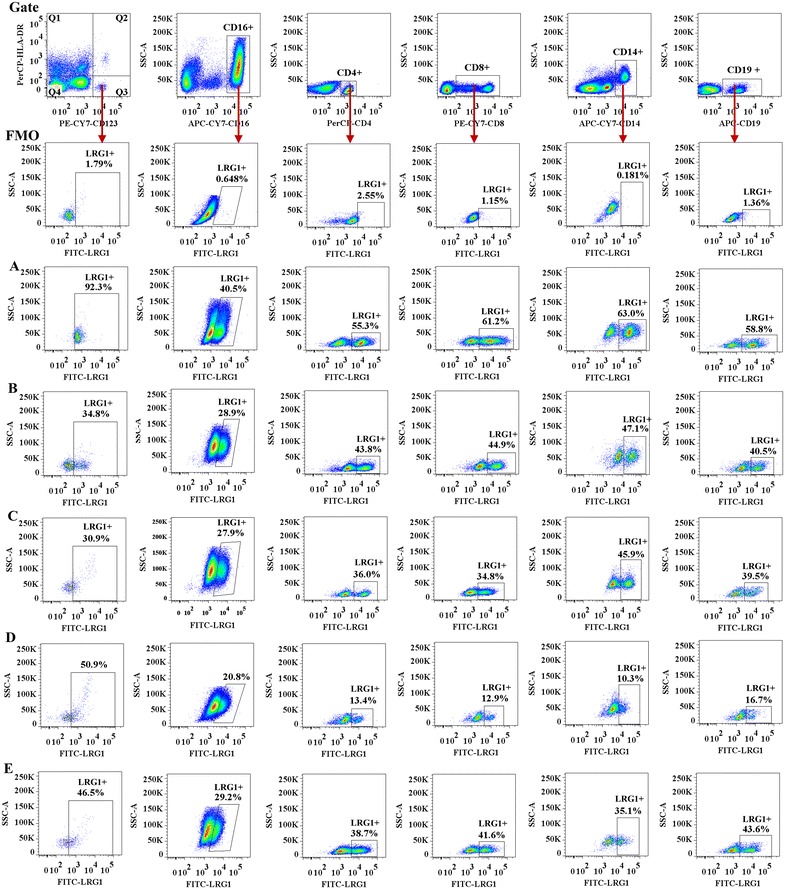
Flow cytometric analysis of LRG1 expression in peripheral blood leukocytes. A representative graph of LRG1+ cells in (A) healthy control (HC) subjects, (B) allergic rhinitis (AR), (C) asthma (AS), (D) rheumatoid arthritis (RA), and (E) AR + AS as indicated. FMO fluorescence minus one
Fig. 3.
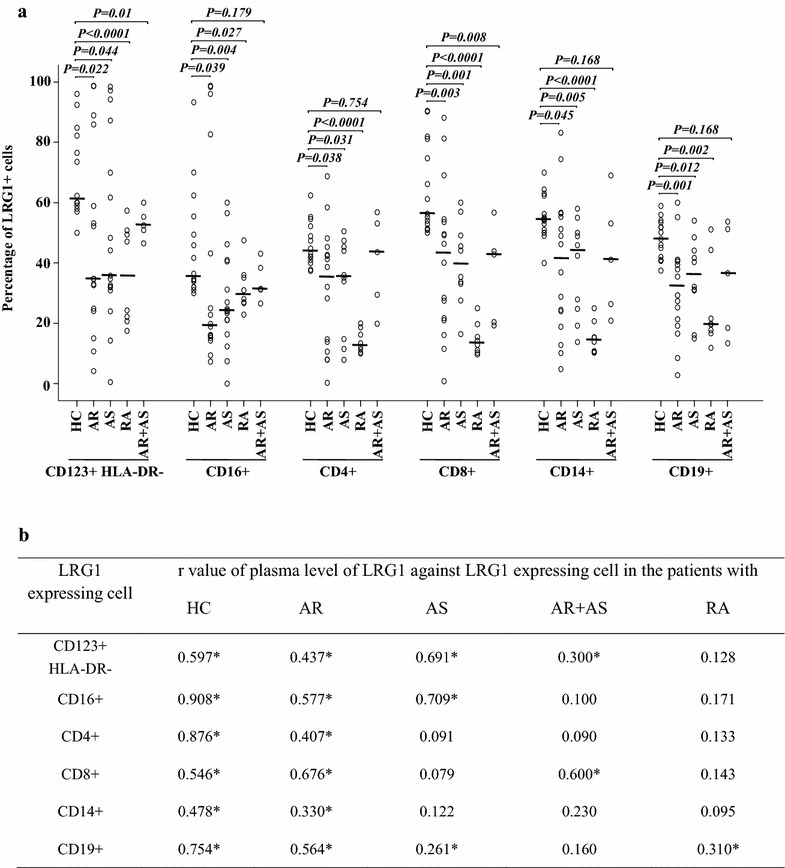
Flow cytometric analysis of LRG1 expression in peripheral blood leukocytes. a Scatter plots of LRG1 expression. P < 0.05 was considered statistically significant. b Rank correlation (Spearman’s correlation coefficient) between the plasma level of LRG1 and percentage of LRG1 expressing cells. *P < 0.05
The percentage of TGFBR2+ cells present in CD123 + HLA-DR− cell populations was lower in patients with AR (median value 9.1 %, P = 0.03) when compared with HC subjects (median value 15.9 %), but not when compared to patients with AS, RA, or AR + AS. It was also observed that the percentages of TGFBR2+ cells in CD16+, CD4+, CD8+, CD14+, and CD19+ cells from the AR + AS group were lower than those from the HC group. Compared with the HC group, the percentage of TGFBR2+ cells in CD19+ cells from the AS group was slightly low (0.36 vs.1.52 %, P = 0.019). In contrast, the percentage of TGFBR2+ cells in the CD14+ cell population from RA subjects was higher than that from HC subjects (Fig. 4). Similar to LRG1, the MFI of TGFBR2 expression was not significantly different between samples from the AR, AS, RA or AR + AS, and HC groups. Decreased plasma levels of TGFBR2 correlated with diminished TGFBR2 expression in the CD123 + HLA-DR−, CD4+ and CD14+ cell populations from the AR group; CD16+ and CD4+ cells from the AS group; CD16+ and CD4+, CD14+, and CD19+ cells from the AR + AS group; and CD4+ cells from the RA group (Fig. 5b).
Fig. 4.
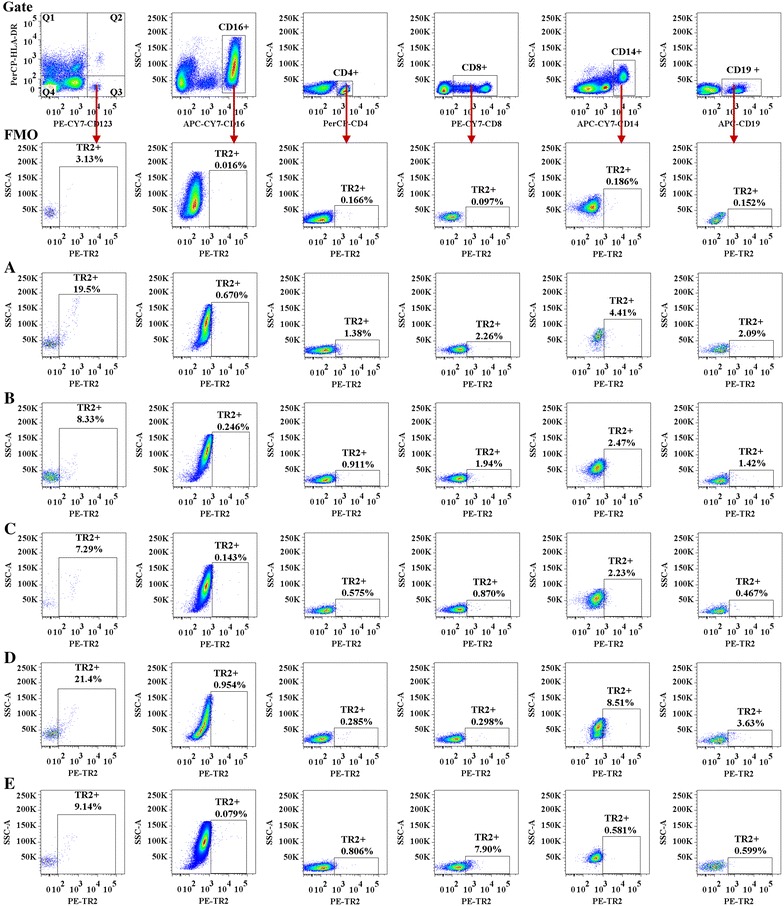
Flow cytometric analysis of TGFBR2 (TR2) expression in peripheral blood leukocytes. A representative graph of TR2+ cells in (A) healthy control (HC) subjects, (B) allergic rhinitis (AR), (C) asthma (AS), (D) rheumatoid arthritis (RA), and (E) AR + AS as indicated. FMO fluorescence minus one
Fig. 5.
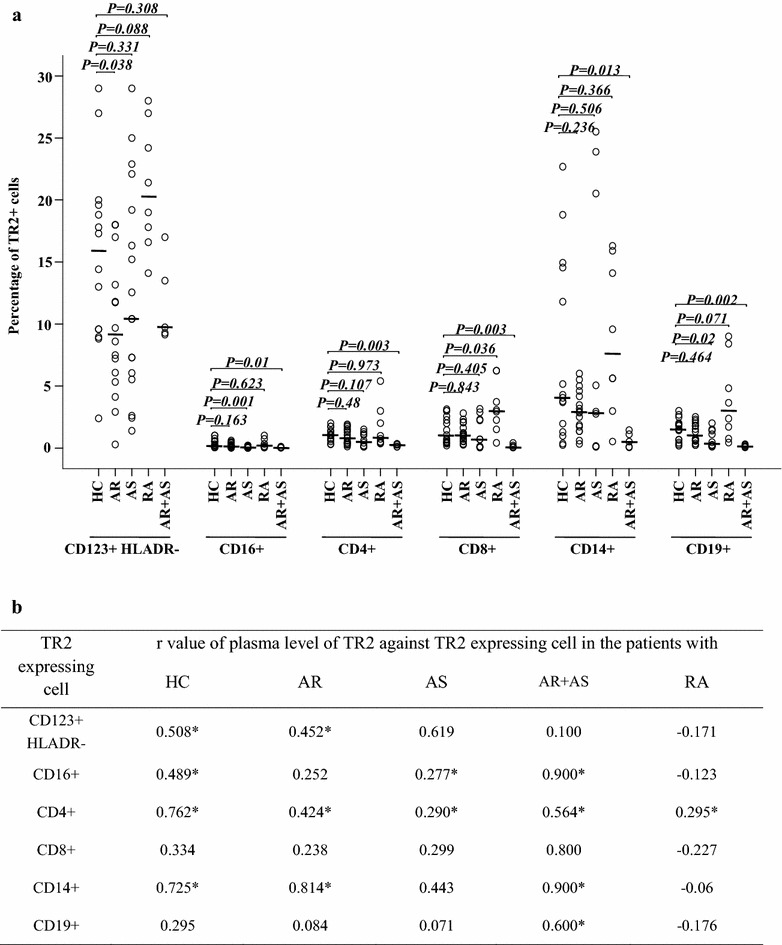
Flow cytometric analysis of TGFBR2 (TR2) expression in peripheral blood leukocytes. a Scatter plots of TR2 expression. P < 0.05 was considered statistically significant. b Rank correlation between the plasma level of TR2 and percentage of TR2 expressing cells. *P < 0.05
Expression of LRG1 and TGFBR2 in dispersed tissue cells
To further identify the potential source of LRG1 and TGFBR2 production, we investigated the expression of LRG1 and TGFBR2 in dispersed tissue cells. The result showed that approximately 89.8 % CD34-FcεRI + CD117+ cells (representing mast cells) and 5.7 % CD90+ cells (representing fibroblasts) expressed LRG1, while 15.5 % mast cells and 0.03 % fibroblasts expressed TGFBR2 in skin tissue. In comparison, only 5.0 and 1.9 % mast cells expressed LRG1 and TGFBR2 in tonsil tissue, respectively (Fig. 6).
Fig. 6.
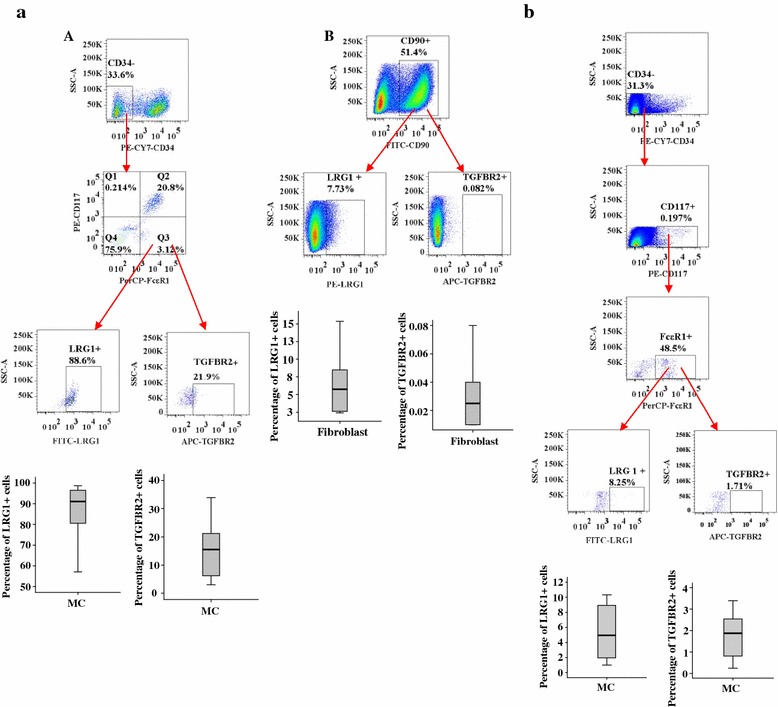
Flow cytometric analysis of LRG1 and TGFBR2 expression in dispersed human mast cells (CD34-CD117 + FcεRI + , MC) and fibroblasts (CD90+). a Dispersed skin MC (A) and fibroblasts (B). b Dispersed tonsil MC. Data are displayed as a boxplot for 6–7 skin or tonsil tissues, which indicates the median, interquartile range, and the largest and smallest values
Time course of LRG1 expression in HMC-1 cells
Since reduced plasma level of LRG1 could result from decreased expression of LRG1 in mast cells, we investigated the effects of the ASWE, PPE, and HDME on HMC-1 cells. The result showed that ASWE, PPE or HDME all at 0.1 and 1.0 μg/ml induced dose-dependent downregulation of LRG1 expression in HMC-1 cells on day 1. On day 6 and 12, these allergen extracts also suppressed LRG1 expression in HMC-1 cells. It was also observed that the percentage of LRG1-expressing HMC-1 cells decreased markedly on day 6 and 12, with or without allergen challenge (Fig. 7).
Fig. 7.
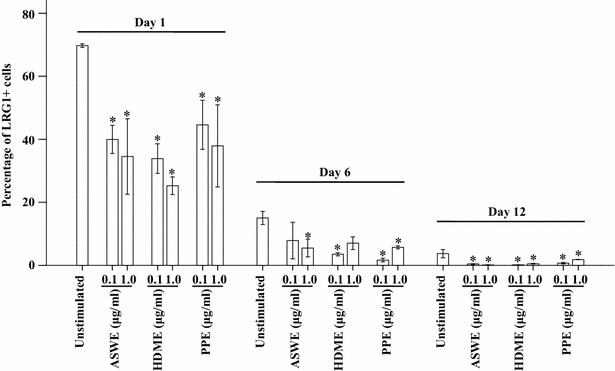
Induction of LRG1 expression in HMC-1 cells by exposure to Artemisia sieversiana willd extract (ASWE), Platanus pollen extract (PPE), or house dust mite extract (HDME) for 1, 6, or 12 days before being analyzed by flow cytometry. The data are the mean ± SE for 4 separate experiments. *P < 0.05, compared with unstimulated control on the same day
Decreased levels of LRG1 and TGFBR2 production in plasma following allergen challenge
To further confirm the reduced plasma levels of LRG1 and TGFBR2 in allergic airway disorders, we investigated the effects of the ASWE, PPE, and HDME allergens on LRG1 and TGFBR2 plasma levels. The result showed that ASWE, PPE, and HDME caused up to 40 and 42.2, 48 and 40, and 38.9 and 43.9 % reduction of plasma LRG1 levels in patients with AR and AS, respectively (Fig. 8a). Similarly, ASWE, PPE, and HDME treatment resulted in up to 17.3 and 24.1, 35.9 and 29.7, and 24.1 and 31 % decrease of TGFBR2 plasma levels in patients with AR and AS, respectively (Fig. 8b). Compared with the peripheral blood from HC subjects, challenging the peripheral blood from AR and AS subjects by ASWE, PPE, and HDME reduced the release of LRG1 by up to 54.4 and 55.2, 60.5 and 53.5, and 53.5 and 56.5 %, respectively. Such treatment also reduced the release of TGFBR2 by up to 52.4 and 62.6, 63.1 and 65.4, and 56.3 and 66.0 %, respectively (Fig. 8b).
Fig. 8.
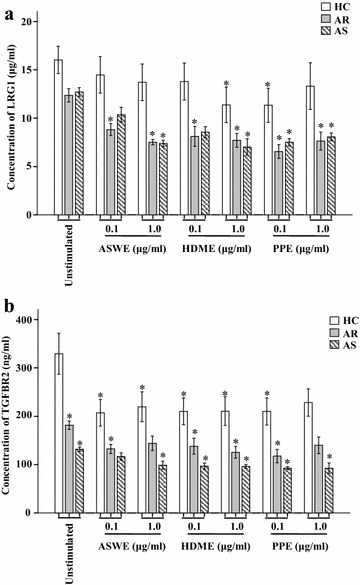
LRG1 (a) and TGFBR2 (b) production levels in the plasma of allergic rhinitis (AR) and asthma (AS) patient samples following Artemisia sieversiana willd extract (ASWE), Platanus pollen extract (PPE), or house dust mite extract (HDME) challenge. The values shown are the mean ± SEM for 8 experiments. *P < 0.05 represents statistically different from the corresponding unstimulated group
Downregulation LRG1 and TGFBR2 expression in peripheral blood leukocytes following allergen challenge
Since allergen-induced reduction of LRG1 and TGFBR2 plasma levels likely resulted from decreased LRG1 and TGFBR2 production in peripheral blood leukocytes, we investigated the effects of the ASWE, PPE, and HDME allergens on LRG1 and TGFBR2 expression in peripheral blood leukocytes. The result showed that ASWE, PPE, and HDME exposure decreased LRG1 expression by up to 62.4, 57.9, and 43; 23.8, 35.2, and 57; and 33.5, 23.3, and 41.7 % in CD4+ cells from AR, AS, and HC subjects, respectively (Fig. 9a). Similarly, ASWE, PPE, and HDME treatment decreased LRG1 expression by up to 57.7, 47.2, and 41.3; 31.7, 37.4, and 41.8; and 49.6, 37.3, and 48.5 % in CD8 + cells from AR, AS, and HC subjects, respectively (Fig. 9a). ASWE, PPE, and HDME decreased LRG1 expression by up to 61.4, 66.1, and 51; 58.7, 19.6, and 40.7; and 40.3, 33.2, and 47.8 % in CD14+ cells from AR, AS, and HC subjects, respectively (Fig. 9a). ASWE, PPE, and HDME treatment also decreased LRG1 expression by up to 64.4, 65, and 48.9; 38.8, 25.7, and 60.2; and 37, 28.7, and 47.7 % in CD19+ cells from AR, AS, and HC subjects, respectively (Fig. 9a). ASWE, PPE, and HDME treatment failed to alter LRG1 expression in CD123 + HLA-DR− and CD16+ cells (data not shown).
Fig. 9.
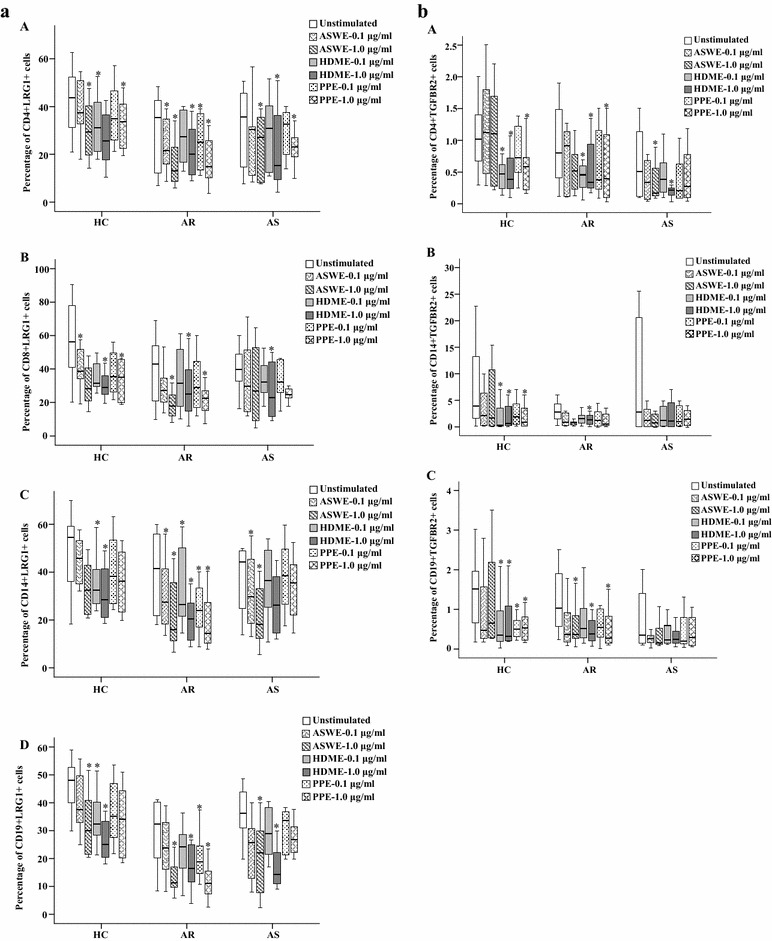
Flow cytometric analysis of LRG1 and TGFBR2 expression in peripheral blood leukocytes of allergic rhinitis (AR, n = 8), asthma (AS, n = 8), and healthy control (HC, n = 8) subjects. a LRG1 expression in (A) CD4+, (B) CD8+, (C) CD14+, and (D) CD19+ cells following Artemisia sieversiana willd extract (ASWE), Platanus pollen extract (PPE) or house dust mite extract (HDME) challenge. b TGFBR2 expression in (A) CD4+, (B) CD14+, and (C) CD19+ cells. Data are displayed as a boxplot. *P < 0.05, compared with responses observed in the corresponding unstimulated control
Although only up to 1.1, 4.0, and 1.5 % of CD4+, CD14+, and CD19+ cells from the HC group expressed TGFBR2, respectively, HDME and PPE further reduced TGFBR2 expression to 0.4 and 0.6 % in CD4+ cells (Fig. 9b), 0.3 and 0.9 % in CD14+ cells (Fig. 9b), and 0.3 and 0.5 % in CD19+ cells (Fig. 9b), respectively, from the HC group. ASWE, PPE, and HDME treatment also diminished TGFBR2 expression by up to 35.8, 53.1, and 56.8 % in CD4+ cells; up to 73.4, 51.7, and 78.3 % in CD14+ cells; and up to 63.5, 73.1, and 63.5 % in CD19+ cells from the AR group, respectively. ASWE, PPE, and HDME exhibited little effect on TGFBR2 expression in CD123 + HLA-DR−, CD8+, and CD16+ cells (data not shown).
Discussion
The current study demonstrated for the first time that plasma production levels of LRG1 and its soluble receptor TGFBR2 in AR, AS, and AR + AS subjects are reduced and that LRG1 and TGFBR2 expression is downregulated in various subsets of blood leukocytes and mast cells. Since serum LRG concentrations are increased in autoimmune diseases such as ulcerative colitis [11], RA [12], and various types of cancers, our current findings may provide a novel diagnostic measure for differentiating autoimmune disease or cancer from allergic responses. Because allergens diminish plasma LRG1 and TGFBR2 levels in AR and AS subjects and suppress LRG1 expression in various subsets of blood leukocytes and mast cells, LRG1 likely mediates the pathogenesis of allergic airway disorders.
Observing reduced plasma LRG1 levels in AR, AS and AR + AS subjects was unexpected, as LRG1 downregulation has not been reported previously under pathological conditions. The overwhelming majority of clinical reports have shown that serum or plasma LRG1 levels are elevated during the development of various diseases. For example, LRG1 was upregulated in the serum or plasma of patients with hepatocellular carcinoma [20], pancreatic cancer [21], ovarian cancer [7], lung cancer [8], and colorectal cancer [22]. Increased LRG1 expression was also found in patients undergoing neurodegenerative diseases [23], acute appendicitis [9], hydrocephalus [24], heart failure [25], autoimmune diseases [12], and ageing [26]. LRG1 has also been suggested as promising biomarker in other disease entities, such as Still’s disease [27] and in peptidomics studies [28, 29].
The observation that plasma LRG1 level in patients with RA was significantly decreased was unexpected as previous report [12] demonstrated that LRG level in patients with RA was elevated compared with those in the healthy controls. The main difference between the two studies was the data for HC subjects, which was ~5 μg/ml in the study performed by Serada et al. and 16 μg/ml in the current study. Since different ELISA kits were used by the two study groups, plasma LRG1 was measured in the present study and serum LRG was determined by Serada et al., it is difficult to compare the data from these two studies. Nevertheless, the serum level of LRG for RA in Serada’s study was ~11.5 μg/ml, and the plasma level of LRG1 for RA in our study was 9.2 μg/ml, which seems no big difference between the two.
In contrast to findings with LRG1, some reports have described a decrease of TGFBR2 production under pathological conditions. For instance, decreased TGFBR2 expression was observed in prostate cancer cells [30], carcinoma cells of the urinary bladder [31], and the oropharyngeal mucosa during SIV infection [32]. These data may support our current observation that plasma levels of TGFBR2 were reduced in AR, AS, and AR + AS subjects. It should be noticed that the HC group is significantly younger than the others in the present study, which may be a confounding factor for the interpretation of differences.
LRG1 is expressed during haematopoiesis, especially during differentiation of the neutrophilic granulocyte lineage [5]. We found that not only neutrophils, but also large proportions of basophils, helper T cells, cytotoxic T cells, monocytes, and B cells populations expressed LRG1, which could be the major contributors of plasma LRG1 (μg/ml scale). Thus, reduced plasma LRG1 levels in AR, AS, and AR + AS subjects could result from decreased LRG1 secretion from these subsets of leukocytes. Indeed, we observed diminished percentages of LRG1+ cells in all subsets of leukocytes in patients with AR and AS, in comparison with HC subjects, suggesting that allergens may suppress LRG1 production in these cell types. To our surprise, the plasma level of LRG1 in patients with RA was also lower than that of HC subjects, which conflicts with data from a previous report [12]. Since the plasma LRG1 levels observed in RA patients in the present study is similar to previously reported values (median values: present study, 8.12 vs. previous study, 11.4 μg/ml), the difference between both studies lies in the LRG1 levels observed in HC subjects (median value: present study, 15.9 vs. previous study, 3.0 μg/ml). Since the plasma levels of LRG1 in AR, AS, RA, and AR + AS subjects were all reduced, it is difficult to clearly differentiate AR or AS from RA, based upon plasma LRG1 levels alone.
TGF-β receptors are expressed on almost all types of mammalian cell types examined. The TGF-β signalling pathway involves 2 transmembrane serine/threonine kinases, known as TGF-β receptors I and II [33]. The type-II receptor, a 70 kDa transmembrane protein with a cytoplasm serine/threonine kinase domain, is required for the antiproliferative activity of TGF-β. The abundance of cell-surface TGF-β R-II expression is the limiting factor during initial activation of the signal transduction pathway [34]. Therefore, our findings that plasma TGFBR2 levels were reduced in AR, AS, and AR + AS subjects; that the percentage of TGFBR2+ cells in CD123 + HLA-DR− cells decreased in patients with AR; and that the percentage of TGFBR2 + cells in CD16+, CD4+, CD8+, CD14+, and CD19+ cell populations of AR + AS subjects was lower than that in HC subjects suggested that LRG1 and TGF-β-provoked cell activities may be enhanced in the above cell types.
It was found that ASWE, PPE, and HDME allergen exposure reduced LRG1 and TGFBR2 plasma levels in patients with AR and AS. Because ASWE, PPE, and HDME could also suppress the production of LRG1 and TGFBR2 in peripheral blood helper T cells, NKT cells, monocytes, and B cells from AR and AS subjects, the reduction of plasma LRG1 and TGFBR2 levels may results in part from a decreased release of LRG1 and TGFBR2 from these leukocytes. However, it is difficult to explain the facts that LRG1 concentration was reduced in HC subjects when incubated with 1.0 HDME and 0.1 PPE (and not 1.0 PPE), and that TGFBR2 concentrations were decreased in HC subjects in response to various allergens. Since expression of LRG1 and TGFBR2 are not supposed to be reduced in HC subjects when incubated with allergens, further work is required to address the issue. Lack of association between allergen type in skin allergen-testing and the plasma levels of LRG1 and TGFBR2 in the AR and AS patient population, and 3 different allergens caused similar pattern of reduced LRG1 and TGFBR2 concentrations in plasma, we believe that reduction of plasma levels of LRG1 and TGFBR2 is a common feature of allergy regardless of allergen type.
Little is known of expression of LRG1 in mast cells, the major primary effector cells of allergic responses [35]. Since mast cell degranulation is a key event occurring during allergic responses, the negative correlations between tryptase and LRG1 and TGFBR2 in the plasma of AR, AS, and AR + AS subjects suggested that plasma LRG1 and TGFBR2 may be released from cells other than tryptase-producing cells, or that allergen may have dual activities in mast cells (provoking degranulation and inhibiting LRG1 and TGFBR2 production). Our observations that approximately 89.8 and 15.5 % of mast cells expressed LRG1 and TGFBR2 in skin tissue; that 5.0 and 1.9 % of mast cells expressed TGFBR2 in tonsil tissue; and that the allergens ASWE, PPE, and HDME diminished LRG1 expression in HMC-1 cells support the possibility that allergens may serve such dual roles in mast cells.
Conclusions
Unlike RA and ulcerative colitis, patients with allergic airway disorders possess a feature of decreased LRG1 concentration in their plasma, which may serve as a maker to differentiate allergic disease from autoimmune disease. The reduced LRG1 and TGFBR2 levels in plasma of allergic airway disorders are most likely caused by the inhibitory actions of allergens on LRG1 and TGFBR2 producing cells. Therefore, LRG1 could be a key regulatory factor of allergy, and its reduced release may contribute to the development of allergy.
Authors’ contributions
LH carried out most experiments, and wrote large part of the first draft of the manuscript. HX carried out most experiments, and generated majority of the data. BZ performed the statistical analysis, and wrote large part of the first draft of the manuscript. HZ performed the clinical study and performed data analysis. DC performed ELISA and wrote a part of the first draft of the manuscript. SW participated in flowcytometry, cell culture and challenge test. SH designed and conducted the study, analyzed the data and wrote the second and final drafts of the manuscript. All authors read and approved the final manuscript.
Competing interests
The authors declare that they have no competing interests.
Funding
This project was sponsored by the grants from the “12th Five-Year” National Science and Technology Support Plan (2014BAI07B02), the National Natural Science Foundation of China (No. 81172836, 81471592, 81472016); Major Science and Technology Platform for Institution of Higher Education in Liaoning Province (2014168); “Twelfth five-year” Public Welfare Industry Special Scientific Research Project (2015SQ00136); the National Natural Science Foundation of Liaoning Province (2014022027 and 2014022019); Program for Liaoning Innovation Research Team in University (LNIRT, LT2013017); Climbing Scholar Project for Institution of Higher Education in Liaoning province (2013222); Allergic Disease Translational Medicine Research Centre of Liaoning Province (201341); Liaoning Provincial Engineering Research Centre for Diagnosing & Treating Inflammatory Disease (20141093); Clinical Capability Construction Project for Liaoning Provincial Hospitals (LNCCC-A06-2014) and Science and Technology Planning Project of Suzhou (SYS201272). The roles of these funding were related to collecting research materials, performing experiments, as well as the publication fees of papers.
Abbreviations
- AR
allergic rhinitis
- AS
asthma
- ASWE
Artemisia sieversiana willd allergen extract
- ELISA
enzyme-linked immunosorbent assay
- HC
healthy control
- HDME
house dust mite allergen extract
- HMC-1
human mast cell-1
- INPH
idiopathic normal pressure hydrocephalus
- LRG1
leucine-rich α2-glycoprotein-1
- PPE
Platanus pollen allergen extract
- RA
rheumatoid arthritis
- TR2
TGFBR2 (transforming growth factor-beta receptor II)
Footnotes
Lijing Hao, Hua Xie and Bin Zhang contributed equally to this work
Contributor Information
Lijing Hao, Email: 1028548274@qq.com.
Hua Xie, Email: 13309885483@163.com.
Bin Zhang, Email: zhangbinjin@sina.com.
Dong Chen, Email: entdoctorchen@163.com.
Shufen Wang, Email: 1039777687@qq.com.
Huiyun Zhang, Email: zhanghuiyun2003@163.com.
Shaoheng He, Phone: 86-416-4605081, Email: shoahenghe@hotmail.com, Email: zhanghuiyun2003@126.com.
References
- 1.Haupt H, Baudner S. Isolation and characterization of an unknown, leucine-rich 3.1-S-alpha2-glycoprotein from human serum (author’s transl) Hoppe Seylers Z Physiol Chem. 1977;358:639–646. doi: 10.1515/bchm2.1977.358.1.639. [DOI] [PubMed] [Google Scholar]
- 2.Takahashi N, Takahashi Y, Putnam FW. Periodicity of leucine and tandem repetition of a 24-amino acid segment in the primary structure of leucine-rich alpha 2-glycoprotein of human serum. Proc Natl Acad Sci USA. 1985;82:1906–1910. doi: 10.1073/pnas.82.7.1906. [DOI] [PMC free article] [PubMed] [Google Scholar]
- 3.Ng AC, Eisenberg JM, Heath RJ, Huett A, Robinson CM, Nau GJ, et al. Human leucine-rich repeat proteins: a genome-wide bioinformatic categorization and functional analysis in innate immunity. Proc Natl Acad Sci USA. 2011;108(Suppl 1):4631–4638. doi: 10.1073/pnas.1000093107. [DOI] [PMC free article] [PubMed] [Google Scholar]
- 4.Kobe B, Deisenhofer J. Proteins with leucine-rich repeats. Curr Opin Struct Biol. 1995;5:409–416. doi: 10.1016/0959-440X(95)80105-7. [DOI] [PubMed] [Google Scholar]
- 5.O’Donnell LC, Druhan LJ, Avalos BR. Molecular characterization and expression analysis of leucine-rich alpha2-glycoprotein, a novel marker of granulocytic differentiation. J Leukoc Biol. 2002;72:478–485. [PubMed] [Google Scholar]
- 6.Wang X, Abraham S, McKenzie JA, Jeffs N, Swire M, Tripathi VB, et al. LRG1 promotes angiogenesis by modulating endothelial TGF-beta signalling. Nature. 2013;499:306–311. doi: 10.1038/nature12345. [DOI] [PMC free article] [PubMed] [Google Scholar]
- 7.Andersen JD, Boylan KL, Jemmerson R, Geller MA, Misemer B, Harrington KM, et al. Leucine-rich alpha-2- glycoprotein-1 is upregulated in sera and tumors of ovarian cancer patients. J Ovarian Res. 2010;3:21. doi: 10.1186/1757-2215-3-21. [DOI] [PMC free article] [PubMed] [Google Scholar]
- 8.Guergova-Kuras M, Kurucz I, Hempel W, Tardieu N, Kádas J, Malderez-Bloes C, et al. Discovery of lung cancer biomarkers by profiling the plasma proteome with monoclonal antibody libraries. Mol Cell Proteomics. 2011;10(M111):010298. doi: 10.1074/mcp.M111.010298. [DOI] [PMC free article] [PubMed] [Google Scholar]
- 9.Kentsis A, Ahmed S, Kurek K, Brennan E, Bradwin G, Steen H, et al. Detection and diagnostic value of urine leucine-rich alpha-2-glycoprotein in children with suspected acute appendicitis. Ann Emerg Med. 2012;60(78–83):e1. doi: 10.1016/j.annemergmed.2011.12.015. [DOI] [PMC free article] [PubMed] [Google Scholar]
- 10.Kharbanda AB, Rai AJ, Cosme Y, Liu K, Dayan PS. Novel serum and urine markers for pediatric appendicitis. Acad Emerg Med. 2012;19:56–62. doi: 10.1111/j.1553-2712.2011.01251.x. [DOI] [PMC free article] [PubMed] [Google Scholar]
- 11.Serada S, Fujimoto M, Terabe F, Iijima H, Shinzaki S, Matsuzaki S, et al. Serum leucine-rich alpha-2 glycoprotein is a disease activity biomarker in ulcerative colitis. Inflamm Bowel Dis. 2012;18:2169–2179. doi: 10.1002/ibd.22936. [DOI] [PubMed] [Google Scholar]
- 12.Serada S, Fujimoto M, Ogata A, Terabe F, Hirano T, Iijima H, et al. iTRAQ-based proteomic identification of leucine-rich alpha-2 glycoprotein as a novel inflammatory biomarker in autoimmune diseases. Ann Rheum Dis. 2010;69:770–774. doi: 10.1136/ard.2009.118919. [DOI] [PubMed] [Google Scholar]
- 13.Sun D, Kar S, Carr BI. Differentially expressed genes in TGF-beta 1 sensitive and resistant human hepatoma cells. Cancer Lett. 1995;89:73–79. doi: 10.1016/0304-3835(95)90160-4. [DOI] [PubMed] [Google Scholar]
- 14.Li X, Miyajima M, Jiang C, Arai H. Expression of TGF-betas and TGF-beta type II receptor in cerebrospinal fluid of patients with idiopathic normal pressure hydrocephalus. Neurosci Lett. 2007;413:141–144. doi: 10.1016/j.neulet.2006.11.039. [DOI] [PubMed] [Google Scholar]
- 15.Von Mutius E. Presentation of new GINA guidelines for paediatrics. The Global Initiative on Asthma. Clin Exp Allergy. 2000;30(Suppl 1):6–10. doi: 10.1046/j.1365-2222.2000.00089.x. [DOI] [PubMed] [Google Scholar]
- 16.Demoly P, Allaert FA, Lecasble M, Bousquet J. PRAGMA. Validation of the classification of ARIA (allergic rhinitis and its impact on asthma) Allergy. 2003;58:672–675. doi: 10.1034/j.1398-9995.2003.t01-1-00202.x. [DOI] [PubMed] [Google Scholar]
- 17.Kay J, Upchurch KS. ACR/EULAR 2010 rheumatoid arthritis classification criteria. Rheumatology (Oxford) 2012;51(Suppl 6):vi5–9. doi: 10.1093/rheumatology/kes279. [DOI] [PubMed] [Google Scholar]
- 18.He S, Gaca MD, Walls AF. A role for tryptase in the activation of human mast cells: modulation of histamine release by tryptase and inhibitors of tryptase. J Pharmacol Exp Ther. 1998;286:289–297. [PubMed] [Google Scholar]
- 19.Zhang H, Lin L, Yang H, Zhang Z, Yang X, Zhang L, et al. Induction of IL-13 production and upregulation of gene expression of protease activated receptors in P815 cells by IL-6. Cytokine. 2010;50:138–145. doi: 10.1016/j.cyto.2010.02.006. [DOI] [PubMed] [Google Scholar]
- 20.He X, Wang Y, Zhang W, Li H, Luo R, Zhou Y, et al. Screening differential expression of serum proteins in AFP-negative HBV-related hepatocellular carcinoma using iTRAQ -MALDI-MS/MS. Neoplasma. 2014;61:17–26. doi: 10.4149/neo_2014_001. [DOI] [PubMed] [Google Scholar]
- 21.Kakisaka T, Kondo T, Okano T, Fujii K, Honda K, Endo M, et al. Plasma proteomics of pancreatic cancer patients by multi-dimensional liquid chromatography and two-dimensional difference gel electrophoresis (2D-DIGE): up-regulation of leucine-rich alpha-2-glycoprotein in pancreatic cancer. J Chromatogr B Analyt Technol Biomed Life Sci. 2007;852:257–267. doi: 10.1016/j.jchromb.2007.01.029. [DOI] [PMC free article] [PubMed] [Google Scholar]
- 22.Ladd JJ, Busald T, Johnson MM, Zhang Q, Pitteri SJ, Wang H, et al. Increased plasma levels of the APC-interacting protein MAPRE1, LRG1, and IGFBP2 preceding a diagnosis of colorectal cancer in women. Cancer Prev Res (Phila) 2012;5:655–664. doi: 10.1158/1940-6207.CAPR-11-0412. [DOI] [PMC free article] [PubMed] [Google Scholar]
- 23.Miyajima M, Nakajima M, Motoi Y, Moriya M, Sugano H, Ogino I, et al. Leucine-rich alpha2-glycoprotein is a novel biomarker of neurodegenerative disease in human cerebrospinal fluid and causes neurodegeneration in mouse cerebral cortex. PLoS One. 2013;8:e74453. doi: 10.1371/journal.pone.0074453. [DOI] [PMC free article] [PubMed] [Google Scholar]
- 24.Nakajima M, Miyajima M, Ogino I, Watanabe M, Miyata H, Karagiozov KL, et al. Leucine-rich alpha-2-glycoprotein is a marker for idiopathic normal pressure hydrocephalus. Acta Neurochir (Wien) 2011;153:1339–1346. doi: 10.1007/s00701-011-0963-z. [DOI] [PMC free article] [PubMed] [Google Scholar]
- 25.Watson CJ, Ledwidge MT, Phelan D, Collier P, Byrne JC, Dunn MJ, et al. Proteomic analysis of coronary sinus serum reveals leucine-rich alpha2-glycoprotein as a novel biomarker of ventricular dysfunction and heart failure. Circ Heart Fail. 2011;4:188–197. doi: 10.1161/CIRCHEARTFAILURE.110.952200. [DOI] [PubMed] [Google Scholar]
- 26.Nakajima M, Miyajima M, Ogino I, Watanabe M, Hagiwara Y, Segawa T, et al. Brain localization of leucine-rich alpha2-glycoprotein and its role. Acta Neurochir Suppl. 2012;113:97–101. doi: 10.1007/978-3-7091-0923-6_20. [DOI] [PubMed] [Google Scholar]
- 27.Ha YJ, Kang EJ, Lee SW, Park YB, Lee SK, Song JS, et al. Serum leucine-rich α2-glycoprotein is a useful biomarker for monitoring disease activity in patients with adult-onset Still’s disease. Scand J Rheumatol. 2015;44:399–403. doi: 10.3109/03009742.2015.1016103. [DOI] [PubMed] [Google Scholar]
- 28.Smith CR, Batruch I, Bauça JM, Kosanam H, Ridley J, Bernardini MQ, et al. Deciphering the peptidome of urine from ovarian cancer patients and healthy controls. Clin Proteomics. 2014;11:23. doi: 10.1186/1559-0275-11-23. [DOI] [PMC free article] [PubMed] [Google Scholar]
- 29.Bauça JM, Martínez-Morillo E, Diamandis EP. Peptidomics of urine and other biofluids for cancer diagnostics. Clin Chem. 2014;60:1052–1061. doi: 10.1373/clinchem.2013.211714. [DOI] [PubMed] [Google Scholar]
- 30.Meikle AW, Swope RE, Yin DY, Fullmer D, Loop SM, Murray DK. Transforming growth factor beta-1 and beta-2 and type II receptor functional regulation of ALVA-101 human prostate cancer cells. Metabolism. 1999;48:1075–1081. doi: 10.1016/S0026-0495(99)90118-X. [DOI] [PubMed] [Google Scholar]
- 31.Kim JH, Shariat SF, Kim IY, Menesses-Diaz A, Tokunaga H, Wheeler TM, et al. Predictive value of expression of transforming growth factor-beta(1) and its receptors in transitional cell carcinoma of the urinary bladder. Cancer. 2001;92:1475–1483. doi: 10.1002/1097-0142(20010915)92:6<1475::AID-CNCR1472>3.0.CO;2-X. [DOI] [PubMed] [Google Scholar]
- 32.George J, Lewis MG, Renne R, Mattapallil JJ. Suppression of transforming growth factor beta receptor 2 and Smad5 is associated with high levels of microRNA miR-155 in the oral mucosa during chronic simian immunodeficiency virus infection. J Virol. 2015;89:2972–2978. doi: 10.1128/JVI.03248-14. [DOI] [PMC free article] [PubMed] [Google Scholar]
- 33.Bottner M, Unsicker K, Suter-Crazzolara C. Expression of TGF-beta type II receptor mRNA in the CNS. NeuroReport. 1996;7:2903–2907. doi: 10.1097/00001756-199611250-00019. [DOI] [PubMed] [Google Scholar]
- 34.Kingsley DM. The TGF-beta superfamily: new members, new receptors, and new genetic tests of function in different organisms. Genes Dev. 1994;8:133–146. doi: 10.1101/gad.8.2.133. [DOI] [PubMed] [Google Scholar]
- 35.He SH, Zhang HY, Zeng XN, Chen D, Yang PC. Mast cells and basophils are essential for allergies: mechanisms of allergic inflammation and a proposed procedure for diagnosis. Acta Pharmacol Sin. 2013;34:1270–1283. doi: 10.1038/aps.2013.88. [DOI] [PMC free article] [PubMed] [Google Scholar]


