Abstract
The impact of the nutritional status during foetal life in the overall health of adults has been recognised1. However dietary effects on the developing immune system are largely unknown. Development of secondary lymphoid organs (SLOs) occurs during embryogenesis and is considered to be developmentally programmed2,3. SLO formation dependents on a subset of type 3 innate lymphoid cells (ILC3) named lymphoid tissue inducer (LTi) cells2,3,4,5. Here we show that foetal ILC3s are controlled by cell-autonomous retinoic acid (RA) signalling in utero pre-setting the immune fitness in adulthood. We found that embryonic lymphoid organs contain ILC progenitors that differentiate locally into mature LTi cells. Local LTi differentiation was controlled by maternal retinoid intake and foetal RA signalling acting in a haematopoietic cell-autonomous manner. RA controlled LTi cell maturation upstream of the transcription factor RORγt. Accordingly, enforced expression of Rorgt restored maturation of LTi cells with impaired RA signalling, while RA receptors directly regulated the Rorc locus. Finally, we established that maternal levels of dietary retinoids control the size of secondary lymphoid organs and the efficiency of immune responses in the adult offspring. Our results reveal a molecular link between maternal nutrients and the formation of immune structures required for resistance to infection in the offspring.
Haematopoietic cells that initially colonise SLO sites include CD3−c-Kit+IL7Rα−α4β7+CD11c+CD4− Lymphoid Tissue initiator (LTin) cells and the prototypical member of type 3 ILCs, LTi cells2,3,4,5,6,7. While the majority of LTi cells express CD4, this is a late event in LTi differentiation and not all RORγt+ LTi cells express this marker5,6,8,9. Thus, we hypothesised that CD3−IL7Rα+α4β7+ID2+c-Kit+CD11c−CD4− ILCs (herein called ILC4neg cells) receive local cues giving rise to ID2+RORγt+CD4+ LTi cells (LTi4) within developing SLOs. Noteworthy, enteric ILC4neg cells include mainly ID2+RORγt+CD4− LTi cells (LTi0) but also a small fraction of ID2+RORγt−CD4− precursors with LTi cell potential (herein called pre-ILC cells)9. In contrast, nearly 100% of LN ILC4neg cells are LTi0 cells (Extended Data Fig. 1a,b). Analysis of E12.5 guts revealed that ILC4neg cells are the only appreciable IL7Rα+ colonising cells (Fig. 1a,b). Accordingly, non-cycling mature Sca1− LTi4 cells increased throughout development, seemingly at the expense of Sca1+ ILC4neg cells (Fig. 1a–c; Extended Data Fig. 1c). Further evidence that ILC4neg cells differentiate locally was provided by organ cultures and transplantation of E12.5 intestines. Despite absence of foetal liver out-put in these settings, LTi4 cells increased with time at the expense of local ILC4neg cells (Fig. 1d,e). Furthermore, in E14.5 Rorgt−/− embryos ILC4neg cells were attracted to the intestine and LNs, supporting initial anlagen colonisation by these cells (Extended Data Fig. 1d,e). Strikingly, RA stimulation of E13.5 LN cells showed increased frequency of LTi4 cells and reduction of ILC4neg cells suggesting that differentiation of LTi4 cells is regulated by RA (Fig. 1f). To confirm the effect of RA in LTi differentiation in vivo, pregnant mice received RA enriched diet starting at E10.5. Supplementation of RA increased LTi4 cells in the embryo, in detriment of ILC4neg cells (Fig. 1f). In agreement, provision of the RA signalling inhibitor BMS493 to pregnant females resulted in decrease of foetal LTi4 cells despite normal frequency of foetal liver progenitors and enteric haematopoietic cells (Fig. 1f; Extended Data Fig. 1f). Consequently, despite normal embryo size BMS493 administration led to reduction in LN dimensions and PP developmental failure (Fig.1g–i; Extended Data Fig.1g). Collectively, our data indicate that maternal retinoids control LTi cell differentiation within developing SLOs.
Figure 1. Maternal RA controls LTi differentiation.
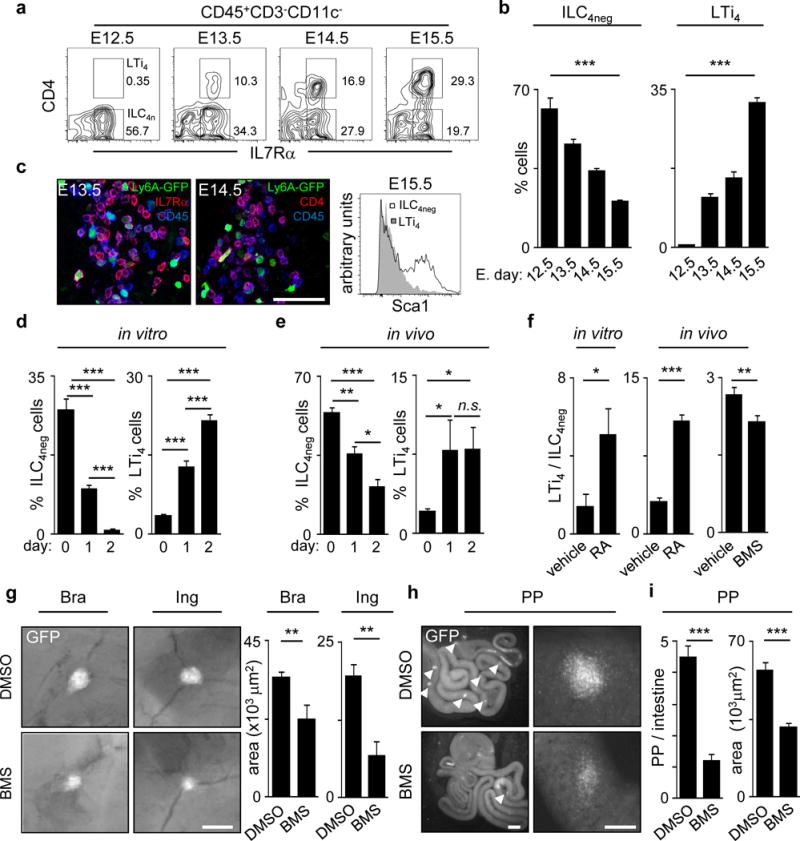
a, Enteric foetal ILC4neg and LTi4 cells. b, E12.5 n=8; E13.5 n=3; E14.5 n=6; E15.5 n=3. c, Left: Sca1-GFP LNs. Right: E15.5 gut cells. d,e, Cultured or transplanted E12.5 guts. d, d0 n=4; d1 n=6; d2 n=6. e, d0 n=7; d1 n=3; d2 n=5. f, Left: E13.5 LN cells; n=7. Centre: RA was provided to females. E13.5 LN cells; n=8. Right: Females received BMS493; n=8. g–i, hCD2-GFP females received BMS493. E17.5 SLOs. g, Brachial and inguinal LNs; n=6. h, Arrowheads: PP. i, Dimensions; DMSO n=8; BMS n=22. Area; DMSO n=30; BMS n=25. Scale bar: 50μm (c), 200μm (g, h right), 1mm (h left). Error bars show s.e.. *P<0.05; **P<0.01; ***P<0.001.
RA is a vitamin A metabolite that controls early vertebrate development, some immune processes in adulthood and it was shown to mediate CXCL13 expression in foetal mesenchymal cells10,11,12,13,14,15,16. RA binds to heterodimers formed by the RA receptors (RARs) and retinoid X receptors (RXRs), which bind DNA RA response elements (RAREs)11. In order to address putative RA cell-autonomous responses, we assessed RAR and RXR expression in E15.5 ILC4neg, LTi4 and LTin cells. RARs and RXRs were predominantly expressed by ILC4neg and LTi4 cells, while LTin cells expressed these molecules at lower levels (Fig.2a). RA stimulation revealed that only ILC4neg and LTi4 cells respond robustly as shown by Rarb up-regulation (Fig.2b)16. Altogether, these data suggest that impaired SLO development in BMS493 treated mice might be the consequence of RA signal ablation in LTi cells. To test this hypothesis we employed a lineage-targeted model to block RA signalling. We used a mouse line in which a truncated form of the RARα gene was knocked into the ROSA26 locus preceded by a triple polyadenylation signal flanked by two loxP sites (ROSA26-RARα403). This line was bred to Vav-iCre mice that in contrast to other tested Cre lines ensured Cre activity in foetal LTin, ILC4neg and LTi4 cells (Extended Data Fig.2a–d)17,18. Despite normal frequencies of foetal liver precursors, and SLO LTin, ILC4neg and LTi0 cells, Vav-iCre/ROSA26-RARα403 embryos (Rar mice) revealed a dose-dependent reduction of LTi4 cells (Fig.2c,d; Extended Data Fig.3a–f). To assess whether the differentiation potential of ILC4neg cells is controlled by RA thresholds, we cultured purified ILC4neg cells from RarHet, RarHom and WT littermate control mice. While WT ILC4neg cells upregulated pro-inflammatory cytokines and chemokines and gave rise to LTi4 cells in vitro, these were impaired proportionally to the degree of RA signalling abrogation in ILC4neg cells (Fig.2e,f; Extended Data Fig.3g). Finally, despite normal frequency of colonising ILC4neg cells (Fig.2d), haematopoietic cell-autonomous impairment of RA responses resulted in severely diminished foetal LN size and reduced number of minute PPs (Fig.2g,h; Extended Data Fig.3h). Altogether our data indicate that LTi cell differentiation is controlled by cell-autonomous RA signalling in developing SLOs.
Figure 2. Cell-autonomous RA controls LTi cells and SLO development.
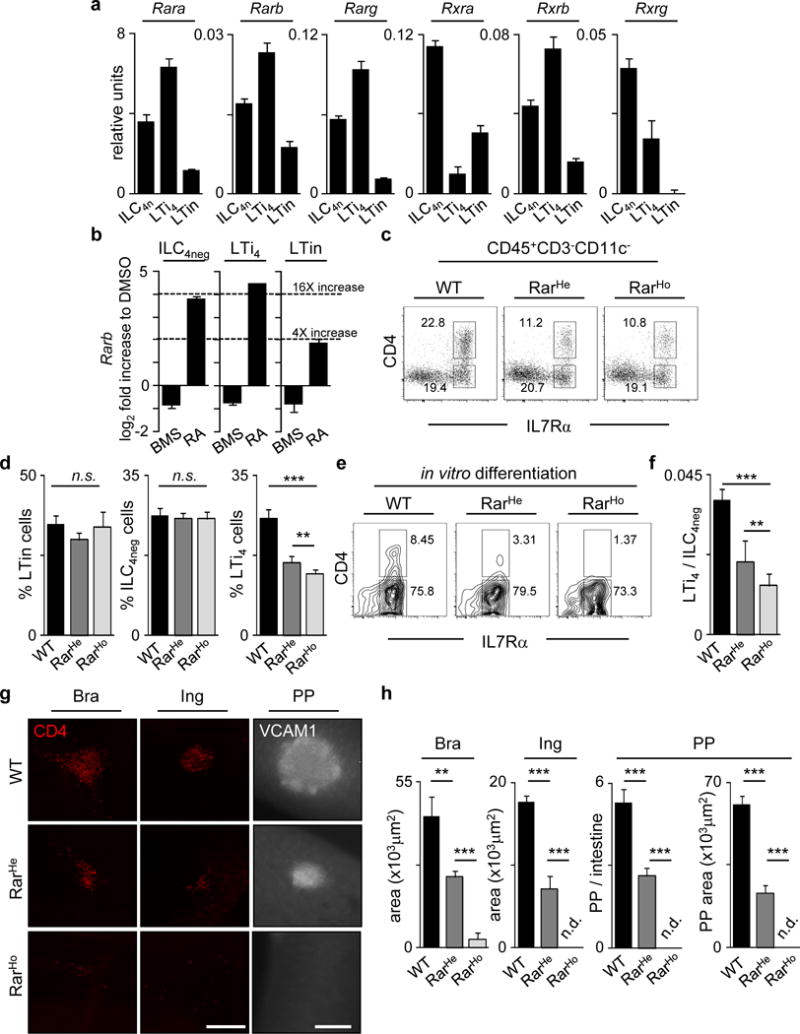
a, RT-PCR of enteric cells. Represents 3 independent experiments. b, DMSO, BMS493 or RA stimulation. Represents 3 independent experiments. c, E15.5. enteric ILC subsets. d, LTin n=4. ILC4neg n=5. LTi4 n=5. e, E15.5 ILC4neg cells cultured for 6 days. f, ILC4neg cell cultures at day 6; n=5. g, E15.5. CD4 (red); VCAM1 (grey). Scale bars: 200μm. h, SLO size; n=6. Error bars show s.e.. *P<0.05; **P<0.01; ***P<0.001.
Previous reports have identified key LTi cell regulators2. Mice mutant for the transcription factors ID2 and RORγt lack LTi cells and do not develop SLOs19,20. Runx1, Tox and Notch1 were also implicated in LTi cell maturation9,21,22,23. We found that while most LTi related genes were normally expressed in RarHom and RarHet ILC4neg and LTi4 cells, Runx1 was increased and Rorgt was reduced (Fig.3a; Extended Data Fig.4a–d). Expression of pro-inflammatory genes was also reduced in RarHom and RarHet ILC4neg and LTi4 cells (Fig.3a; Extended Data Fig.4b–d). The marked reduction of Rorgt suggested that RA could provide ILC4neg cells with signals leading to Rorgt regulation. Accordingly, RA stimulation of ILC4neg cells resulted in Rorgt up-regulation while most other transcription factors were unperturbed, notably Runx1 (Fig.3b). In agreement, BMS493 inhibited RA induced Rorgt and efficient block of RORγt by digoxin prevented RA induced differentiation of ILC4neg cells into LTi4 cells, while cell viability was unaffected (Fig.3c; Extended Data Fig.5a–c). To further test whether RA induced LTi maturation required RORγt, we determined if differentiation of RAR dominant negative ILC4neg cells was restored by enforced Rorgt expression. Retro-viral transduction of Rorgt revealed that RAR dominant negative ILC4neg cells restored high levels of pro-inflammatory genes and reacquired their potential to differentiate towards LTi4 cells (Fig.3d–f). Further evidence that RA can directly regulate Rorgt expression was provided by computational analysis of potential RARE sites and chromatin immuno precipitation (ChIP) with pan-RAR and RXR antibodies. RA stimulation resulted in increased binding of RAR and RXR upstream and within the Rorc gene (Fig.3g,h; Extended Table 1). To analyse the role of these sites we introduced the RARE C (−5,478 Rorg TSS), E (−1,800 Rorg TSS) and G (−1,619 Rorgt TSS) half-sites in a Luciferase reporter vector. Mutations in these sites resulted in significant reduction of the regulatory function of these elements as measured by Luciferase activity (Fig.3i). Thus, cell-autonomous RA signalling provides LTi cells with critical differentiation signals via direct regulation of Rorgt.
Figure 3. RA controls LTi cells via RORγt.
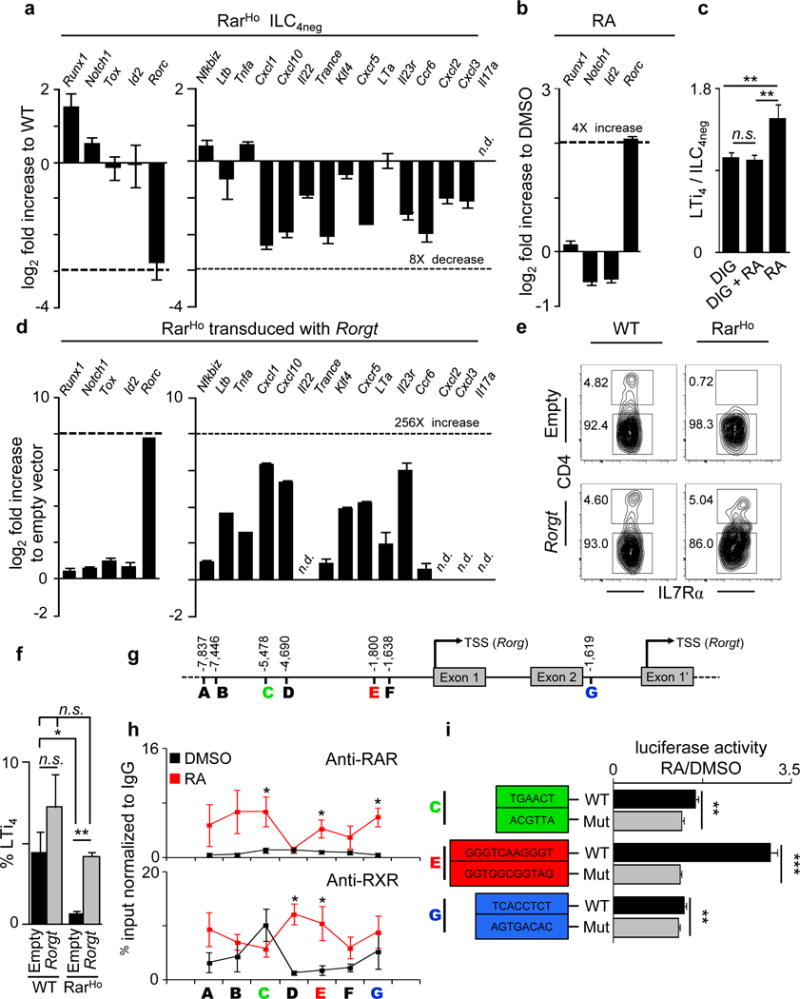
a, E15.5 ILC4neg cells. Represents 3 experiments. b, E15.5 ILC4neg cells stimulated with RA. Represents 3 experiments. c, E13.5 LN cells stimulated with RA and digoxin; n=16. d-f, ILC4neg cells transduced with pMig.Rorgt-IRES-GFP virus (day 6). d, Represents 3 experiments. e, Cytometry analysis. f, Emergent LTi4 cells. WT n=5; RarHo n=3. g, RARE sites. h, E15.5 ILC4neg cells stimulated with RA. ChIP analysis of 5 biological replicates. i, Luciferase activity of RARE WT and mutated sites. C n=6; E n=9; G n=6. Error bars show s.e.. *P<0.05; **P<0.01; ***P<0.001. n.d.: not detected.
Our data suggest that mature LTi cell numbers regulate the size of SLO primordia and may determine lymphoid organ size in adulthood24. RarHet adult mice revealed reduced SLOs and lymphocyte numbers when compared to their WT littermate controls (Fig.4a,b; Extended Data Fig.6a,b). In agreement, mice that received vitamin A deficient (VAD) diet throughout life had reduced lymphoid organ size when compared to vitamin A control mice (VAC) (Fig.4c). However, since RarHet and VAD lymphocytes have life-long access to altered levels of RA signals, it is possible that SLO size might be a consequence of altered lymphocyte pools12,13,14,15. To clarify this issue, we provided pregnant mice with vitamin A high (VAH), VAD or VAC diet and switched all diets to the same VAC diet after birth. At 10 weeks of age mice that were exposed to VAH diet exclusively in utero had larger SLOs while VAD diet exposed mice had small SLOs when compared to VAC control mice (Fig.4d). Interestingly, provision of variable vitamin A diet levels exclusively after birth no longer controlled SLO size (Extended Data Fig.6c,d). Additional evidence that RA determines SLO size in early life was provided by transplantation of CD45.1 WT bone marrow into lethally irradiated RarHet (WT→RarHet) or WT (WT→WT) CD45.2 littermate control hosts at 2 weeks of age (Fig.4e). Thus, we generated mice that pre- and peri-natally received low input of RA signals in haematopoietic cells, but that upon transplantation harbour a normal WT haematopoietic system. WT→RarHet mice, which received low RA cues in utero, exhibited small SLOs when compared to their WT→WT counterparts at 8 weeks after transplantation (Fig.4f,g; Extended Data Fig.6e,f). This phenotype also revealed reduced lymphocyte numbers, albeit normal SLO organisation and similar haematopoietic cell reconstitution (Fig.4h; Extended Data Fig.6f; Extended Data Fig.7a–d). In agreement, dendritic cells from WT→RarHet or WT→WT chimeras had similar capacity to activate lymphocytes (Extended Data Fig. 7e,f).
Figure 4. Retinoid levels in utero determine the offspring immunity.
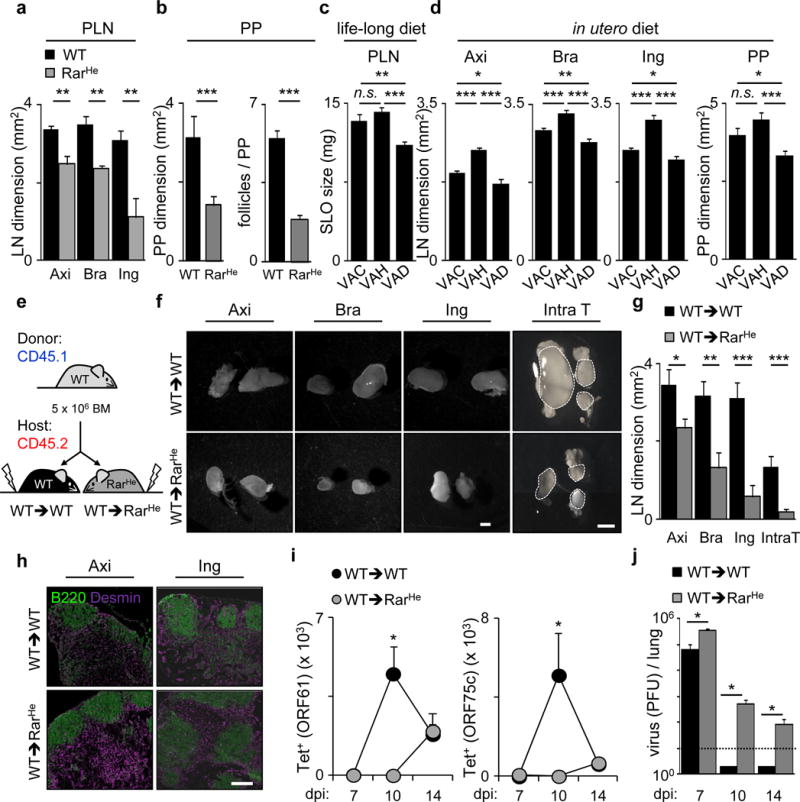
a, Adult axillary, brachial and inguinal LNs. n=6. b, WT n=26; RarHe n=23. c, Females received diets that were maintained in the offspring. VAC n=10; VAH n=8; VAD n=18. d, Females received variable diets. Their offspring received VAC diet. LN: VAC n=18; VAH n=24; VAD n=25. PP: VAC n=20; VAH n=40; VAD n=63. e, Transplantation scheme. f, Chimeric LNs. Scale bar: 1mm. g, Chimeric LNs. n=6. h, Chimeric LNs. Scale bar: 200μm. i, Chimeras infected with Murid herpesvirus-4. Tetramer positive CD8 T cells in intrathoracic LNs. j, Virus titers (PFU/lung). dpi7: WT→WT n=3; WT→RarHet n=3. dpi10: WT→WT n=4; WT→RarHet n=3. dpi14: WT→WT n=8; WT→RarHet n=5. Dash line: detection limit. Error bars show s.e.. *P<0.05; **P<0.01; ***P<0.001.
Our data suggest that available RA in utero regulates the size of lymphocyte pools in the offspring, with possible consequences on their adaptive immune responses. To test this hypothesis, WT→RarHet or WT→WT chimeras were infected intranasally with Murid herpesvirus-4, resulting in acute lung infection. Analysis of draining intrathoracic LNs revealed reduced expansion but normal frequency of CD8+ T cells specific for the viral epitopes ORF61 and ORF75c in WT→RarHet mice (Fig.4i; Extended Data Fig.8a–c). Consequently, while WT→WT chimeras efficiently cleared lytic virus by day 10, high viral titres were still detected in WT→RarHet chimeras 14 days after infection (Fig.4j)25. Thus, a deficit of RA signals within haematopoietic cells in early life results in small SLOs and poor capacity to control infection.
Defining the requirements that control SLO development is essential to understand how immunity may be regulated. We now show that RA controls LTi cells, regulating LTi pro-inflammatory genes and the frequency of LTi4 cells (Extended Data Fig.9). RA operates in a cell-autonomous fashion, via RORγt, although additional factors regulate Rorgt in ILC3s.
SLO development has been considered to be developmentally programmed; we now show that formation of these structures can be also controlled by dietary signals. Thus, in addition to the established impact of dietary plant-derived chemicals in post-natal immune cells, our work reveals dietary retinoids as key regulators of pre-natal ILCs with a lifelong impact in adult lymphoid organ size26,27,28. It was previously shown that complete absence of lymphoid organs leads to long-life virus persistence29. Our data reveal that the efficiency of adaptive immune responses to infection and possibly to other immune insults may be pre-tuned in early life through dietary signals from maternal origin.
We report here that cell-autonomous RA signalling is a key axis for Rorgt expression and LTi cell differentiation within developing SLOs. Similarly, RA may also be important after birth in infection and chronic inflammatory diseases30. Lineage targeted strategies will be central to elucidate the contribution of dietary retinoids in these outcomes.
Methods Summary
Mice were maintained at IMM or VU University Medical Centre according to national and international guidelines. Bone marrow cells were isolated from 8 week-old C57Bl/6 CD45.1 mice and injected intravenously into 2 week-old lethally irradiated CD45.2 ROSA26-RARa403Het (WT→RarHet) or WT littermate controls (WT→WT). C57Bl/6 female mice received either vitamin A deficient (VAD), with no vitamin A (vitamin free casein), vitamin A high (VAH, 25,000IU/Kg) or vitamin A control (VAC, 4,000IU/kg) diets. Retinoic acid was provided to pregnant mice from E10.5 until sacrifice. Quantitative real time RT-PCR was performed as previously described6,7,10. Computational analysis was performed with TESS. DNA/protein complexes were immunoprecipitated using antibodies against mouse pan-RAR, pan-RXR or control IgG.
Methods
Mice
C57Bl/6 mice were purchased from Charles River and C57Bl/6 CD45.1 mice were obtained at IMM. Vav-iCre17, hCD2-GFP6, Id2-CreERT231, ROSA26-RARa40318, Rorgt-Cre32, ROSA26-eYFP33, hCD2-Cre17, ROSA26-mGFPTomato34, Ly-6A (Sca1) GFP35, Rorgt−/− 19, Id2-GFP31, and OT1 Tg Rag1−/− 36,37 mice were previously described. Tamoxifen (2mg/female) was injected daily into Id2-CreERT2 pregnant females from E8.5 to E13.5. All animal experiments were approved by national and institutional ethical committees. Direção Geral de Veterinária and IMM ethical committee (IMM) and Animal Experimental Committee, VU University (VUMC). Power Analysis was performed in order to estimate the number of experimental mice.
Bone marrow transplantation
Bone marrow cells were isolated from 8 week-old C57Bl/6 CD45.1 mice and 5×10⁶ cells were injected intravenously into 2 week-old lethally irradiated (1,000 rad) CD45.2 ROSA26-RARa403Het (WT→RarHet) or CD45.2 WT littermate controls (WT→WT).
Vitamin A Diets
C57Bl/6 female mice received either vitamin A deficient (VAD), with no vitamin A (vitamin free casein), vitamin A high (VAH, 25,000IU/Kg) or vitamin A control (VAC, 4,000IU/kg) diet at E8.5 or 2 weeks before coitus in Fig.4d. Diets were purchased from MP Biomedical (AIN93M feed, Solon, Ohio, USA) (please see also below). RA is rapidly degraded under normal light and temperature conditions; thus it is unlikely that bioactive RA is present in normal diets. Therefore, bioactive RA levels in the differently used diets or normal chow is negligible. Analysis of the adult offspring with life-long diet (mice kept under VAD, VAH or VAC diet until analysis) was performed at 10 weeks of age. Analysis of the adult offspring with pre- and peri-natal VAH and VAD diet (in utero) was performed at 10 weeks of age (all mice were switched to the same VAC diet after birth). Post-birth diet experiments (VAD, VAH and VAC) were initiated at 6 weeks of age and analysed at 13 weeks of age. For adult SLO analysis axillary, brachial, inguinal and intrathoracic LNs and Peyer’s patches (PPs) were carefully dissected. Dimensions were determined using a Zeiss Stereo Lumar V12 microscope with a Zeiss Neolumar S 0.8X objective and weights determined with precision scales (Sartorius). Vitamin A deficient diet had similar composition to control diet but with no added vitamin A palmitate. Vitamin A high diet contained 1g vitamin A palmitate (250,000U/g) per 10kg of diet. Thus, 10Kg of vitamin A control diet was composed of 4,657g corn starch, 1,400g vitamin free Casein, 1,550g dextrinized corn starch, 1,000g sucrose, 400g soybean oil, 500g Alphacel non-nutrive bulk, 350g AIN-93M mineral mix, 18g L-Cystine, 25g Choline Bitartrate, 0.080g T-Butyl Hydroquinone, 0.3g Niacin, 0.16g D-Calcium Pantothenate, 0.07g Pyridoxine HCl, 0.06g Thiamine HCl, 0.06g Riboflavin, 0.02g Folic acid, 0.002g Biotin, 0.25g vitamin B-12 (0.1%Trit), 3g Alpha Tocopherol powder (250U/g), 0.16g vitamin A palmitate (250,000U/g), 0.025 g vitamin D3 (400,000U/g), 0.008g Phylloquinone and 96 g powder sugar.
Retinoic acid and BMS493 treatment
For in vivo stimulation, retinoic acid was provided to pregnant mice as previously described38. In short, mice were mated overnight and the day of vaginal plug detection was marked as E0.5. Retinoic acid supplemented food was given from E10.5 until sacrifice (Sigma-Aldrich, 250mg/g chow or vehicle, i.e., ethanol). Food was stored in the dark at 4°C and refreshed every day until sacrifice. For in vivo blocking of retinoic acid signalling, pregnant C57BL/6 mice were treated with in vivo pan-RAR inverse agonist BMS493 (Tocris Bioscience) (5mg/kg) or vehicle (DMSO) 1:10 in corn oil.
Kidney capsule and ex-vivo differentiation assay
E12.5 intestines (CD45.2) were transplanted under the kidney capsule of anaesthetised 6 to 7 week-old C57Bl/6 CD45.1 mice. For explant organ cultures E12.5 intestines were micro dissected and cultured as previously described6,39. Intestines were digested with collagenase D (5mg/ml; Roche) and DNase I (0.1mg/ml; Roche) and were analysed by flow cytometry.
Confocal microscopy
Gut whole mount analysis was performed as previously described6,39. For embryo whole mount analysis, E15.5 mice were fixed with 4% paraformaldehyde and incubated in blocking/permeabilising buffer (PBS containing 10% foetal bovine serum, 2% BSA and 0.3% Triton X-100). Embryos were incubated at 4°C overnight with primary and secondary antibodies. Samples were cleared using benzyl-alcohol-benzyl-benzoate (BABB) and were imaged in a Zeiss LSM 710 (Carl Zeiss) using EC Plan-Neofluar 10x/0.30 M27 and objective Plan Apochromat 20x/0.8 M27. Images were processed using Zeiss LSM Image Browser 4.2 software (Carl Zeiss).
Immunofluorescence analysis of embryo sections were performed as previously described10. Briefly, samples were formalin fixed and 8μm cryosections were dehydrated in acetone for 10 minutes. Sections were air-dried for 10 minutes. Cryosections were post-fixed 30 minutes with 1% formalin, pre-incubated for 1 hour with PBS containing 10% normal goat serum and 0.2% Triton X-100. Sections were incubated 90 minutes with primary and secondary antibodies in PBS containing 0.2% Triton X-100 and 2% normal goat serum. Sections were embedded in Mowiol with DAPI (Calbiochem) and analysed using Leica SP2 confocal laser scanning microscope.
For immunofluorescence analysis of adult lymph nodes, samples were snap frozen in isopenthane pre-cooled in liquid nitrogen and kept at −80°C. Lymph nodes were sectioned (5μm sections), fixed with 4% paraformaldehyde for 10 minutes and incubated in blocking/permeabilising buffer (PBS containing 10% fetal bovine serum, 2% BSA and 0.3% Triton X-100). Samples were incubated with primary and secondary antibodies overnight or for 2 hours in PBS containing 10% foetal bovine serum, 2% BSA and 0.3% Triton X-100. Sections were mounted in Mowiol with DAPI (Calbiochem). Images were acquired on Zeiss LSM 710 (Carl Zeiss) using EC Plan-Neofluar 10x/0.30 M27 and objective Plan Apochromat 20x/0.8 M27. Images were processed using Zeiss LSM Image Browser 4.2 software (Carl Zeiss).
Flow cytometry analysis and cell sorting
Embryonic guts and lymph nodes were harvested, digested with collagenase D (5mg/ml; Roche) or Blenzyme 2 (0.5mg/ml, Roche) and DNase I (0.1mg/ml; Roche) in DMEM, 3% FBS for approximately 40 minutes at 37°C under gentle agitation. Foetal liver, adult spleen and LN cells suspensions were obtained using 70μm strainers. Lineage (Lin) was: Ter119, TCRβ, CD3ɛ, CD19, NK1.1, CD11c and Gr1. Flow cytometry analysis and cell sorting were performed using FORTESSA, FACSCanto I, FACSAria I and II flow cytometers (BD Biosciences), MoFlo XDP or Cyan ADP flow cytometer (Beckman Coulter). Data analysis was done using FlowJo software (Tristar). Sorted populations were >95% pure.
Cell culture and viral transduction
For in vitro stimulation, LN embryonic cells were harvested as previously described10. Tissues were digested with Blenzyme 2 (0.5mg/ml, Roche), DNaseI (0.2mg/ml, Roche) in PBS for 15 minutes at 37°C while constant stirring. Cell suspensions were washed with RPMI (Invitrogen), supplemented with 2% heat-inactivated FCS, 100U/ml penicillin, and 100μg/ml streptomycin. For retinoic acid stimulation experiments, all-trans retinoic acid ((Sigma-Aldrich) dissolved at 10mM in 100% ethanol) was added at 100nM as previously described10. After 24 hours incubation at 37°C and 5% CO2, cells were isolated and analysed by flow cytometry and RT-PCR. Efficiency of RA treatment was assesses by expression of the RA target gene Rarb16.
Digoxin (Sigma-Aldrich) was dissolved in ethanol at 10mM and used at 10μM, as previously described40. Efficiency of digoxin treatment was assessed by expression of the RORγt target genes Il1r1, Il17a, Il23r, Ccr6, Ccl20 and Csf240.
For treatment of ILC4neg cells in vitro, guts and lymph nodes from E15.5 embryos were harvested, digested with collagenase D (5mg/ml; Roche) and DNaseI (0.1mg/ml; Roche) in DMEM, 3% FBS, for approximately 40 minutes at 37°C with gentle agitation. Total cell suspension or flow cytometry sorted cells were starved overnight and stimulated with all-trans retinoic acid (Sigma-Aldrich, 1μM) or vehicle (DMSO, 0.0015%, Sigma-Aldrich) for 24 hours at 37°C and 5% CO2. Cells were analysed by flow cytometry or quantitative real time RT-PCR. For cell culture, ILC4neg cells were sorted from E15.5 guts and lymph nodes and suspended in culture medium OPTI MEM (Invitrogen) supplemented with 20% FBS, penicillin and streptomycin (respectively 50U and 50mg/ml, Invitrogen), sodium pyruvate (1mM, Invitrogen) and β-mercaptoethanol (50mM, Invitrogen) and recombinant murine RANK Ligand (rRANKL; 50ng/ml; Peprotech). Cells were seeded into flat bottom 96-well plates previously coated with 3,000 rad-irradiated OP9 stromal cells for 6 days. E15.5 ILC4neg cells from RAR dominant negative and WT littermate controls were sorted and transduced with pMig.IRES-GFP retroviral empty vector or containing Rorgt in the presence of polybrene (0.8mg/mL; Sigma-Aldrich). pMig.IRES-Rorgt was a gift of Dr. Littman (Addgene plasmid #24069). Transduced cells were cultured for 6 days. Cultured cells were trypsinised and directly analysed by flow cytometry or FACS sorted and analysed by RT-PCR.
Quantitative RT-PCR
Total RNA was extracted using RNeasy Micro kit (Qiagen) or using Trizol (Invitrogen) according to manufacturer’s protocol. RNA concentration was determined using Nanodrop Spectrophotometer (Nanodrop Technologies). Quantitative real time RT-PCR was performed as previously described6,7,10. Listed primers are sense and anti-sense, respectively. When a nested-sense primer was used, this is last in the list. Gene sequences were obtained from https://www.ensembl.org. Rara: 5′-GCATCCAGAAGAACATGGTG-3′ and 5′-CTCGTTGTTCTGAGCTGTTG-3′; Rarb: 5′-AGCCCACCATCTCCACTTC-3′ and 5′-CTCGATGGCAAGTGTAGATC-3′; Rarg: 5′-TGCAATGACAAGTCTTCTGG-3′ and : 5′-GTTTTTGTCACGGTGACATG-3′; Rxra: 5′-TTCTCTACCCAGGTGAACTC-3′ and 5′-AGGAGGCCATATTTCCTGAG-3′; Rxrb: 5′-CAAAGACTGTACAGTGGAC-3′ and 5′-CCTTGGTCACTCTTCTGCTC-3′; Rxrg: 5′-TCTTGGCTCTCCGTATAGAG-3′ and 5′-CTGCTGACACTGTTGACCAC-3′; Hprt1: 5′-TCCCTGGTTAAGCAGTACAG-3′, 5′-GCTTTGTATTTGGCTTTTCC-3′ and 5′-GACCTCTCGAAGTGTTGGAT-3′.
TaqMan specific primers and probes were from Applied Biosystems. TaqMan Gene Expression Assays were the following: Gapdh Mm99999915_g1; Hprt1 Mm00446968_m1; Id2 Mm00711781_m1; Runx1 Mm01213405_m1; Lta Mm00440228_gH; Trance Mm00441906_m1; Cxcl10 Mm00445235_m1; Cxcr5 Mm00432086_m1; Ccr6 Mm99999114_s1; Cxcl3 Mm01701838_m1; Tnfa Mm00443260_g1; Cxcl1 Mm04207460_m1; Nfkbiz Mm00600522_m1; Cxcl2 Mm00436450_m1; Klf4 Mm00516104_m1; Tox Mm00455231_m1; Il22 Mm01226722_g1; Il17a Mm00439618_m1; Il23r Mm00519943_m1; Rorc Mm01261022_m1; Ltb Mm00434774_g1; Notch1 Mm00435249_m1; Il1r1 Mm00434237_m1, Ccl20 Mm01268754_m1 and Csf2 Mm01290062_m1. Gene expression was normalised to Hprt1 and Gapdh. Real time PCR analysis was performed using ABI Prism 7900HT Sequence Detection System or StepOne Real-Time PCR system (Applied Biosystems).
Bioinformatics and chromatin immunoprecipitation (ChIP) assay
TESS (www.cbil.upenn.edu/tess) web-based-tool was used to identify putative RA response elements (RARE) in the mouse Rorc locus. Embryonic ILC4neg cells (2×10⁵) were isolated by flow cytometry from E15.5 intestines and PLNs. Cell suspensions were starved overnight and incubated with all-trans RA (1μM) or DMSO (0.0015%) for eight hours and fixed with 0.8% formaldehyde (EMS sciences). Cells were lysed and chromosomal DNA-protein complex sonicated to generate DNA fragments ranging from 100–300 bp. DNA/protein complexes were immunoprecipitated using 6μg of rabbit polyclonal antibody against mouse pan-RAR (M-454, Santa Cruz Biotech, Inc), 4μg of rabbit polyclonal antibody against mouse pan-RXR (ΔN197, Santa Cruz Biotech, Inc) or rabbit control IgG (Abcam). Immunoprecipitates were uncross-linked and analysed by quantitative PCR using primer pairs flanking putative RARE sites: A, F-TGAAGCAGCTAGTCACTTCC and R-CAGCTCTCCAGCTTGTATTG; B, F-GAAACTTTATCTGGGGCTGG and R-TGAACTCAGGAAGAGCAGCA; C, F-AACCTGGCACTTCGCACTTAA and R-GAGTGGGCGGACTTCTCAGA; D, F-GAGGCCTCTAAGTACCGCCATT and R-CGCCCTGAATCCTGTCACA; E, F-CAGAGATGACCTAGTCAGTGGAGTACTG and R-ACCCCCCAAAACCCTTGA; F, F-ACCACTGAGCCATCTCTCCTACC and R-TTTTGTGATGTGGGTTCTGGG; G, F-GACAATCTCATCAGAGGAGG and R-GGGCAACCAATGAGTATGTG. Results were normalised to input, intensity and control IgG.
Luciferase reporter assay
Putative RARE sequences were cloned into pTA-Luc firefly Luciferase reporter plasmid (Clontech). Corresponding scrambled mutated sequences were also cloned into the same plasmid. Sequences were cloned in tandems (4 copies). WT and scrambled sequences (1 copy) were, respectively: C: AACCTGGCACTTCGCACTTAAACCTGTGAACTCTGAGAAGTCCGCCCACTC and AACCTGGCACTTCGCACTTAAACCTGACGTTACTGAGAAGTCCGCCCACTCE; E: CAGAGATGACCTAGTCAGTGGAGTACTGCCACAAACACACTGGGGTCAAGGGTTTTGGGGGGT and CAGAGACACTTGAGTCAGTGGAGTACTGCCACAAACACACTAGGTGGCGGTAGTTTGGGGGGT; G: GACAATCTCATCAGAGGAGGTCACCTCTACTCTTCCATCACATACTCATTGGTTGCCC and GACAATCTCATCAGAGGCCTAGTGACACTCTCTTCCATCACATACTCATTGGTTGCCC. Putative binding sites and respective scrambled sequences are underlined. To test the activity of these elements 293T cells were transfected with the aforementioned reporter constructs together with expression vectors expressing murine RARα, RXRα (kind gift from Drs. Vilhais-Neto and Pourquié) and Renilla-Luciferase using X-tremeGene9 DNA Transfection Reagent (Roche). At 48 hours cells were starved and 20 hours later treated with DMSO or RA (1μM) for 24 hours, and Luciferase activity was measured in total cell lysates using the Dual-Luciferase Reporter Assay System (Promega). Data were normalised for transfection efficiency using the ratio between firefly Luciferase activity and Renilla Luciferase.
Murid herpesvirus-4 infection
Chimeric mice obtained from transplantation of WT bone marrow (CD45.1) into lethally irradiated RARHet (WT→RarHet) or WT (WT→WT) littermate control hosts (CD45.2) were used. Mice were infected intranasally with 104 PFU of Murid herpesvirus-4 (MuHV-4)41,42 under isofluorane anaesthesia 12 weeks post transplantation. Intrathoracic lymph nodes and lungs were removed for analysis. Titres of lytic (infectious) virus were determined by plaque assay of freeze-thawed lung tissue homogenates on BHK-21 cells. Plates were incubated for 4 days, then fixed with 4% formal saline and counterstained with toluidine blue for plaque counting. Frequency and number of virus specific CD8 T cells (Tetramer positive) for two viral epitopes (ORF61 and ORF75c) were determined in the draining intrathoracic LNs by tetramer staining (a kind gift from Dr. Ploegh) and flow cytometry25.
OT1 CD8 T cell activation
Dendritic cells were isolated from single cell suspensions of lymph nodes and spleen from WT→RarHet or WT→WT chimeric mice. Cells were negatively depleted for TCRβ, CD19, TER119, Mac1, Gr1, CD3ɛ using DynaBeads Biotin Binder kit (Life Technologies) and positively enriched for CD11c using MACS Cell Separation Reagents (Miltenyi Biotech). OT1 CD8 T cells were isolated from peripheral lymph nodes of OT1 Tg Rag1−/− mice by Thy1.2 positive enrichment using MACS Cell Separation Reagents (Miltenyi Biotech). 2.5×10⁴ dendritic cells pre-loaded with 10−5μM OVA peptide (Thermo Scientific) were cultured for 3 days with 1.25×10⁵ monoclonal OT1 CD8 T cells labeled with 2μM CFSE (BioLegend). Expansion of OT1 CD8 T cells was measured by CFSE dilution and proliferative index was calculated using FlowJo (TreeStar, Inc). Intracellular INFγ levels were measured by flow cytometry using IC fixation/permeabilisation kit (eBioscience).
Antibody list
Cell suspensions were stained for flow cytometry using: anti-CD45 (30-F11); anti-CD11c (N418); anti-CD127 (IL7Rα; A7R34); anti-Ly-6A/E (Sca1; D7); anti-CD45.1 (A20); anti-CD45.2 (104); anti-CD8α (53-6.7); anti-CD19 (eBio1D3); anti-Thy1.2 (53-2.1); anti-NK1.1 (PK136); anti-CD3ɛ (eBio500A2), TER119 (TER-119), CD11b (Mi/70), Gr1 (RB6-8C5), NK1.1 (PK136), IFNγ (XMG1.2), isotype for IFNγ (eBRG1), α4β7 (DATK32) and MHCII (M5/114.15.2) antibodies and streptavidin fluorochrome conjugates from eBioscience. Anti-CD4 (GK1.5) and TCRβ (H57-595) antibodies were purchased from Biolegend. Anti-RORγt (Q31-378) and RORγt isotype (G155-178) were purchased from BD Pharmingen. Anti-GFP (A11008) antibody was purchased from Invitrogen. Intracellular staining for flow cytometry was performed using IC fixation/permeabilisation kit (eBioscience). Embryo sections for immunofluorescence analysis were stained with GK1.5 (anti-CD4), MP33 (anti-CD45) and A7R34 (anti-IL7Rα; kindly provided by Dr. Nishikawa) purified from hybridoma cell culture supernatants with protein G-Sepharose (Pharmacia). Anti-Ki67 and anti-podoplanin (8.1.1) antidodies were purchased from BD Biosciences and Biolegend, respectively. Embryos were whole mount stained using Alexa Fluor 647-conjugated anti-CD4 (YTS191.1) from AbDSerotec; Intestines were whole mount stained using rat anti-CD106 (VCAM-1, 429 MVCAM.A) from BD Biosciences. Adult LN sections were stained using rabbit polyclonal anti-desmin and rat monoclonal anti-B220 (RA3-6B2) from Abcam and eBioscience, respectively. Anti-species specific Alexa Fluor 594; Alexa Fluor 555; Alexa Fluor 488 or Alexa Fluor 647 were used as secondary antibodies (Invitrogen).
Statistics
Variance was analysed using F-test. Student’s t-test was performed on homoscedastic populations and student t-test with Welch correction was applied on samples with different variances.
Extended Data
Extended Data Figure 1. Foetal ILCs.
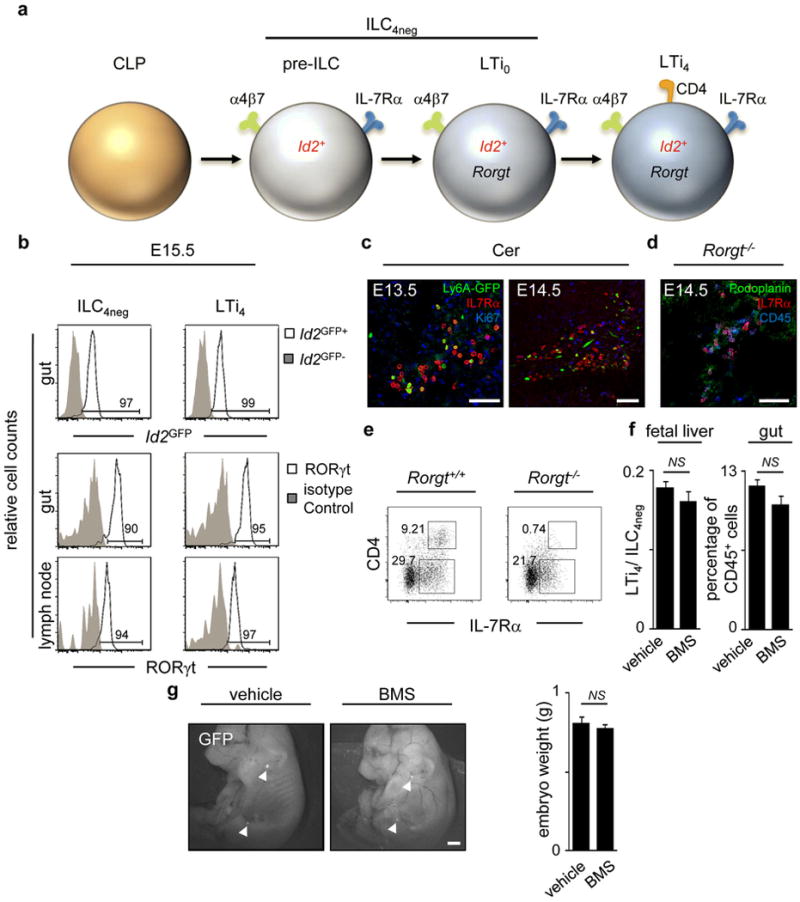
a, ILC subsets in foetal gut and LNs. b, E15.5 intestines and LN cells were purified from Id2GFP and WT mice. Id2GFP and RORγt expression are shown in ILC4neg (CD3−IL7Rα+α4β7+ID2+c-Kit+CD11c−CD4−) and LTi4 (CD3−IL7Rα+α4β7+ID2+c-Kit+CD11c−RORγt+CD4+) cells. c, E13.5 and E14.5 Ly6A-GFP anlagen LN were stained with GFP, IL7Rα and Ki67 antibodies and analysed by confocal microscopy. d, E14.5 Rorgt−/− mesenteric LNs were stained with podoplanin, IL7Rα and CD45 antibodies and analysed by confocal microscopy. e, Percentage of E16.5 ILC4neg and LTi4 cells gated in CD45+CD3−CD11c− determined by flow cytometry in Rorgt+/+ and Rorgt−/− intestines. Data are representative of three independent experiments. f, Left: Pregnant mice received RAR antagonist BMS493 or the vehicle DMSO from E10.5 until E13.5. The ratio LTi4/ILC4neg cells in the foetal liver was determined at E13.5; n=8. Right: Pregnant mice received BMS493 or the vehicle DMSO. Frequency of colonising haematopoietic cells was determined in E17.5 intestines by flow cytometry; n=4. g, Pregnant hCD2-GFP mice were administered BMS493 or DMSO from E10.5 until E13.5. Embryos were analysed at E17.5; n=13. Arrowheads show anlagen LNs. Scale bars: 50μm (c,d); 500μm (g). Error bars show s.e.. Two tailed t-test p values are indicated. *P<0.05; **P<0.01; ***P<0.001. n.s., not significant.
Extended Data Figure 2. Analysis of haematopoietic cell Cre mouse lines.
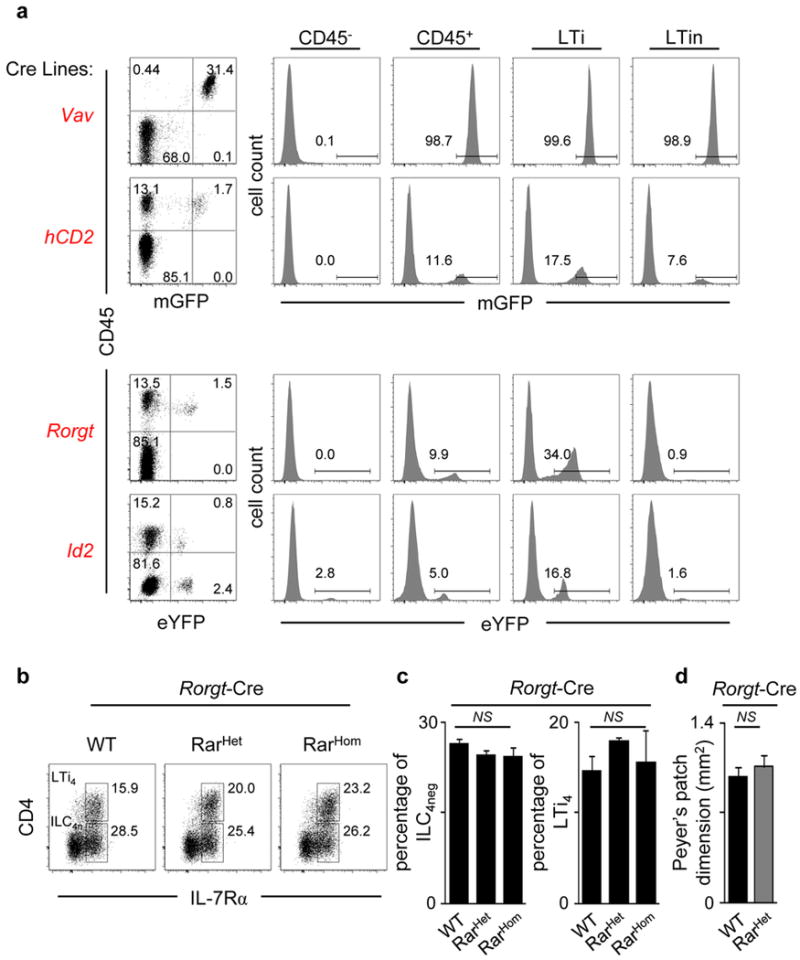
a, Vav-iCre and hCD2-Cre mice were crossed with ROSA26-Tomato-mGFP mice. Rorgt-Cre and Id2-CreERT2 mice were crossed with ROSA26-eYFP mice. E15.5 intestines were analysed by flow cytometry. Left: Results show the percentage of mGFP or eYFP positive cells in gut cell suspensions. Right: Percentage of mGFP or eYFP positive cells in non-haematopoietic (CD45−), haematopoietic (CD45+), LTi and LTin cells. Results are representative of three independent experiments. b, Percentage of enteric E15.5 pre-LTi and LTi4 cells determined by flow cytometry in WT, Rorgt-Cre RarHet and Rorgt-Cre RarHom littermates. c, Frequencies of enteric ILC4neg and LTi4 cells in WT, Rorgt-Cre RarHet and Rorgt-Cre RarHom littermates. WT n=5; Rorgt-Cre RarHet n= 5; Rorgt-Cre RarHom n=4. d, PP area at 6–7 weeks of age. WT n=3; Rorgt-Cre RarHet n= 4. Two tailed t-test p values are indicated. *P<0.05; **P<0.01; ***P<0.001. n.s., not significant.
Extended Data Figure 3. Analysis of Vav-iCre/ROSA26-RARα403 mice.
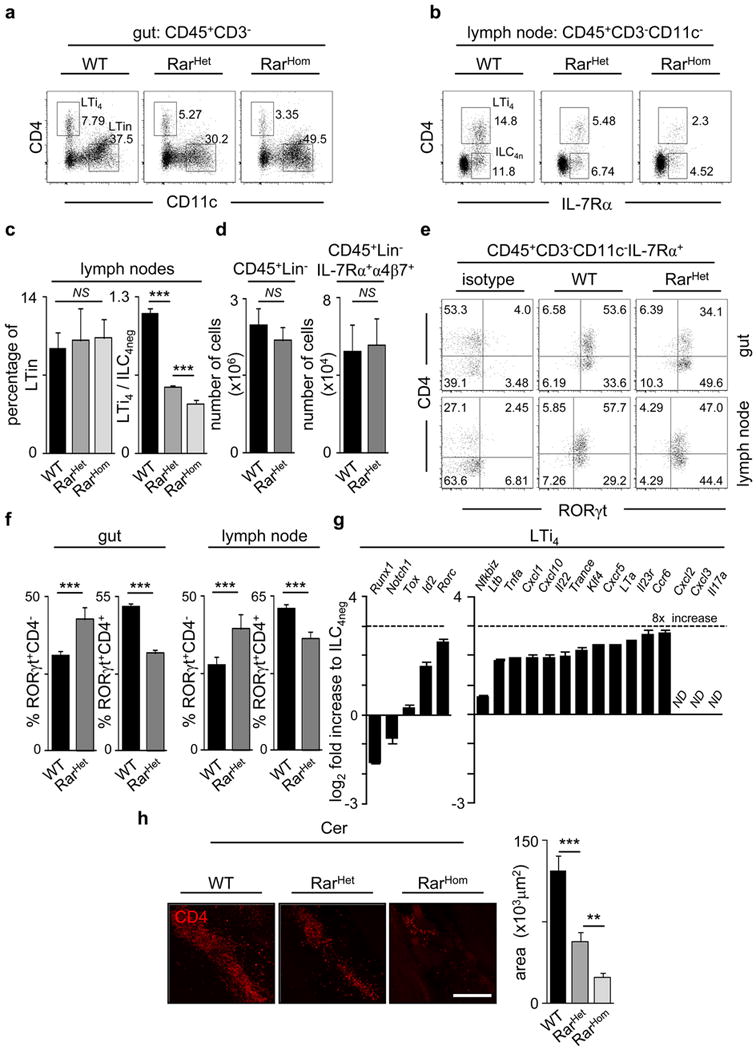
a, E15.5 intestines from WT, Vav-iCre RarHet and RarHom mice were analysed by flow cytometry. Representative analysis of six independent experiments is shown. b, E15.5 regions of cervical, brachial and inguinal LN from WT, Vav-iCre RarHet and RarHom mice were analysed by flow cytometry. Representative analysis of two independent experiments. c, LTin cell percentage and LTi4/ILC4neg cell ratios are shown in E15.5 LNs; n=4. d, E15.5 foetal livers from WT and Vav-iCre RarHet mice were analysed by flow cytometry. Results show number of CD45+Lin− (n=4) and CD45−Lin−IL7Rα+α4β7+ progenitors (n=3). e, Percentage of CD45+CD3−CD11c−IL7Rα+RORγt+CD4− (RORγt+CD4−) and CD45+CD3−CD11c−IL7Rα+RORγt+CD4+ (RORγt+CD4+) cells determined by flow cytometry in RARHet and WT littermate controls in E15.5 guts and LNs. f, Frequencies of RORγt+CD4− and RORγt+CD4+ cells in mice described in (e) WT n=9; RarHet n=3. g, ILC4neg cells were purified from E15.5 WT intestines by flow cytometry and cultured for 6 days. LTi4 cells raised in vitro were purified by flow cytometry and quantitative RT-PCR analysis performed. Results show Log2 fold increase in comparison to their cultured ILC4neg cell counterparts. Results were normalised to Hprt1 and Gapdh. h. Left: E15.5 embryos were whole mount stained for CD4 (red) and imaged by confocal microscopy. Cervical (Cer) LNs are shown. Right: Cervical LN dimensions are shown. WT n=5; RarHet n=7; RarHom n=6. Scale bar: 50μm. Two tailed t-test p values are indicated. *P<0.05; **P<0.01; ***P<0.001. n.s., not significant.
Extended Data Figure 4. Gene expression patterns in ILC4neg and LTi4 cells.
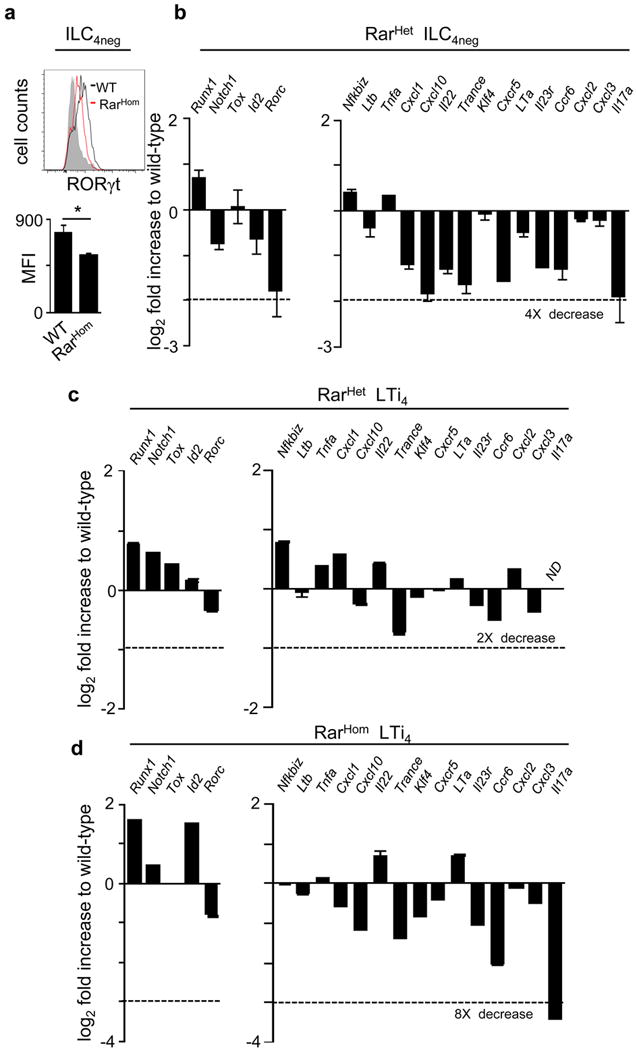
a, E15.5 intestines from RarHom and WT littermate controls were brought to suspension and analysed by flow cytometry. Upper panel: RORγt expression. Lower panel: mean fluorescence intensity of RORγt expression in ILC4neg cells; n=3. b, Pre-LTi cells were purified from E15.5 RarHet and WT littermate control intestines and lymph nodes. Quantitative RT-PCR analysis was performed. Results show Log2 fold increase to WT. Results were normalised to Hprt1 and Gapdh. Results from three independent measurements are shown. c,d, LTi4 cells were purified from E15.5 RarHet (c), RarHom (d) and WT littermate control intestines and lymph nodes. Quantitative RT-PCR analysis was performed. Results show Log2 fold increase to WT. Results were normalised to Hprt1 and Gapdh. Data from three independent measurements are shown. Two tailed t-test p values are indicated. *P<0.05; **P<0.01; ***P<0.001. n.s., not significant.
Extended Data Figure 5. Treatment of ILC4neg and LTi4 cells with digoxin.
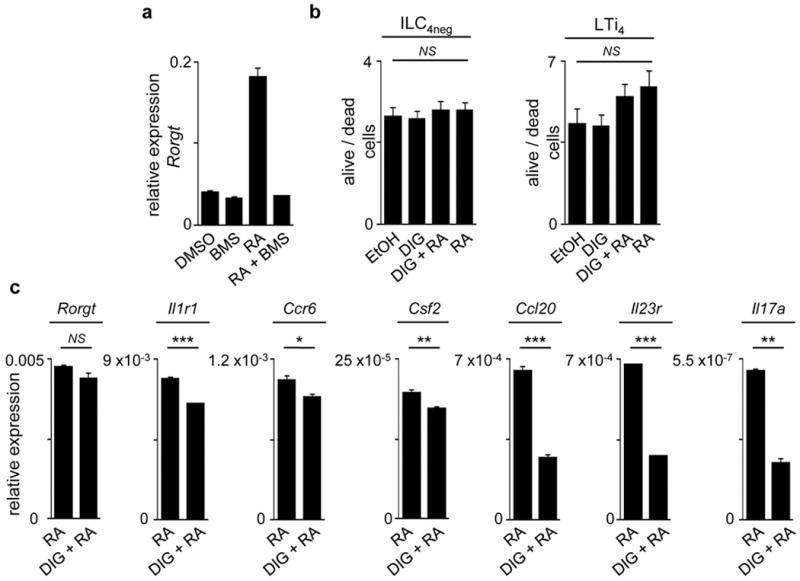
a, WT ILC4neg cell were FACS purified starved overnight and stimulated with DMSO, BMS493 (100nM), RA (100nM) and RA+BMS493 (100nM each) for 16 hours. Results show quantitative RT-PCR analysis normalised to Gapdh; n=3. b, E13.5 LN cell suspensions were cultured with vehicle (ethanol), digoxin, digoxin+RA and RA alone for 24H. Alive/dead cell ratios were determined by flow cytometry and DAPI staining; n=4. c, ILC4neg cells were isolated from WT E15.5 embryos starved overnight and stimulated for 6 hours in the presence of RA (100nM) or DIG (10μM) + RA (100nM). Results show quantitative RT-PCR analysis of Rorgt and RORγt downstream targets normalised to Gapdh. Representative of three independent experiments. Error bars show s.e.. Two tailed t-test p values are indicated. *P<0.05; **P<0.01; ***P<0.001. n.s., not significant.
Extended Data Figure 6. Analysis of SLOs from adult mice with variable RA signalling levels.
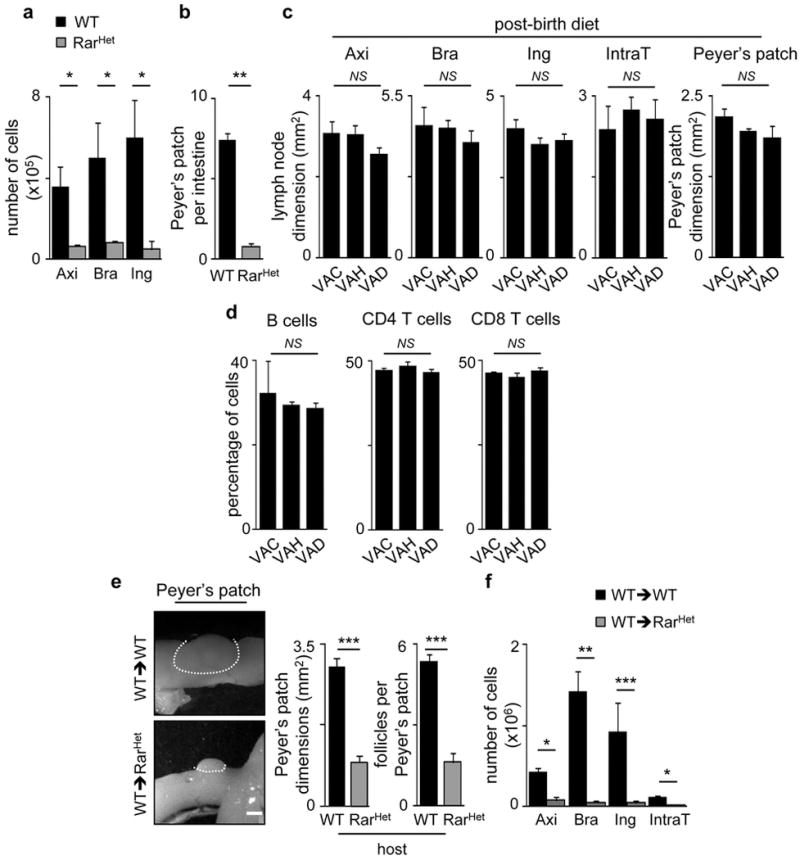
a, Axillary (Axi), brachial (Bra) and inguinal (Ing) LNs from adult RarHet and WT littermate controls were analysed. Results show LN cell numbers; n=6. b, Results show PP number per intestine from adult RarHet and WT littermate controls; n=6. c. Six-week old WT females received VAC, VAH or VAD (n=3) diet for 7 weeks. Axillary (Axi), brachial (Bra), inguinal (Ing), intrathoracic (IntraT) LNs and Peyer’s patches (PP) dimensions were analysed; n=3. d. Percentage of CD45+CD19+ B cells; CD4+ and CD8+ T cells in inguinal LNs; n=3. e,f, Two week-old CD45.2 RarHet and WT littermate controls were lethally irradiated and transplanted with WT CD45.1 bone marrow cells. Chimeric mice were analysed 8 weeks after reconstitution. e, Results show PP dimensions and follicle number/PP; n=6. f, Results show number of cells in axillary (Axi), brachial (Bra) inguinal (Ing) and intrathoracic (Intra T) LNs; n=6. Scale bar: 1mm. Error bars show s.e.. Two tailed t-test p values are indicated. *P<0.05; **P<0.01; ***P<0.001. n.s., not significant.
Extended Data Figure 7. Analysis of WT→WT and WT→RarHet bone marrow chimeras.
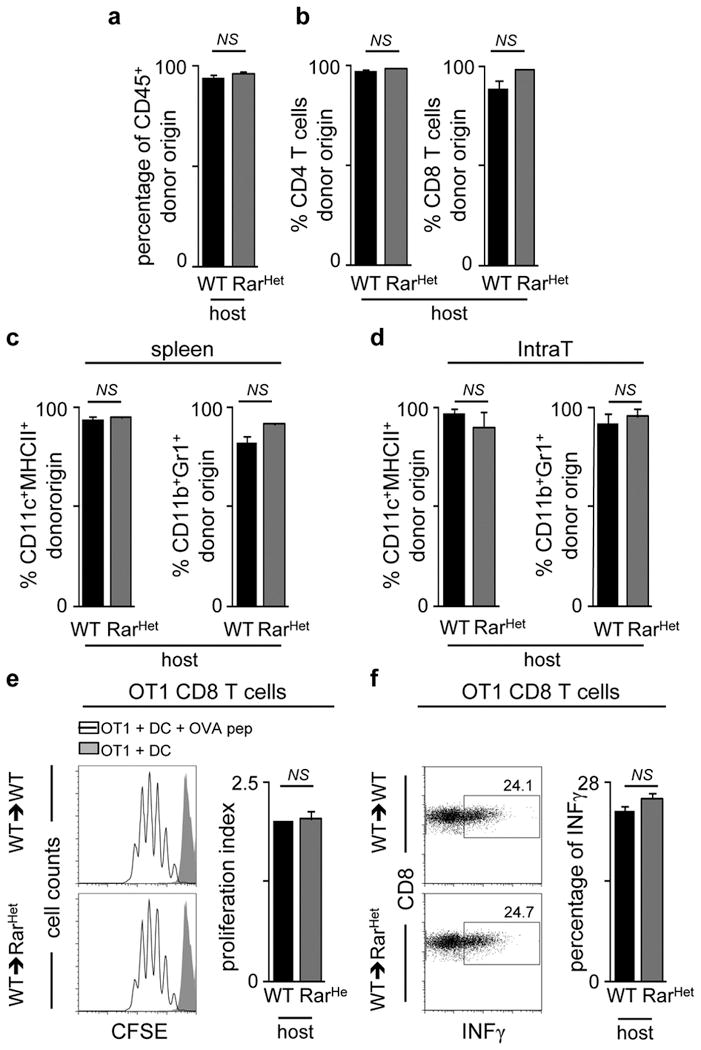
Two week-old CD45.2 RarHet and WT littermate controls were lethally irradiated and transplanted with WT CD45.1 bone marrow cells. Chimeric mice were analysed 8 weeks after reconstitution. a, Reconstitution of donor CD45.1 cells in WT→WT and WT→RarHet chimeras in the spleen (n=4). b, Reconstitution of donor CD45.1 CD4 and CD8 T cells in WT→WT and WT→RarHet chimeras in the spleen. WT→WT n=4; WT→RarHet n=11. c, Reconstitution of donor CD45.1 CD11c+MHCII+ and CD11b+Gr1+ myeloid cells in WT→WT and WT→RarHet chimeras in the spleen; n=3. d, Reconstitution of donor CD45.1 CD11c+MHCII+ and CD11b+Gr1+ cells in WT→WT and WT→RarHet chimeras in intrathoracic LNs; n=3. e, Dendritic cells (DCs) were purified from WT→WT and WT→RarHet chimeras. DCs were loaded with OVA peptide (10−5 μM) and co-cultured for 3 days with CFSE-labelled monoclonal OT1 CD8 T cells. OT1 CD8 T cell proliferation was analysed by CFSE dilution. Proliferation index is shown. WT n=4; RarHet n=6. f, Dendritic cells (DCs) were purified from WT→WT and WT→RarHet chimeras. DCs were loaded with OVA peptide (10−5 μM) and co-cultured for 3 days with OT1 CD8 T cells. Percentage of IFNγ producing OT1 CD8 T cells is shown; n=4. Error bars show s.e.. Two tailed t-test p values are indicated. *P<0.05; **P<0.01; ***P<0.001. n.s., not significant.
Extended Data Figure 8. Infection of WT→RarHet or WT→WT chimeras with Murid herpesvirus-4.
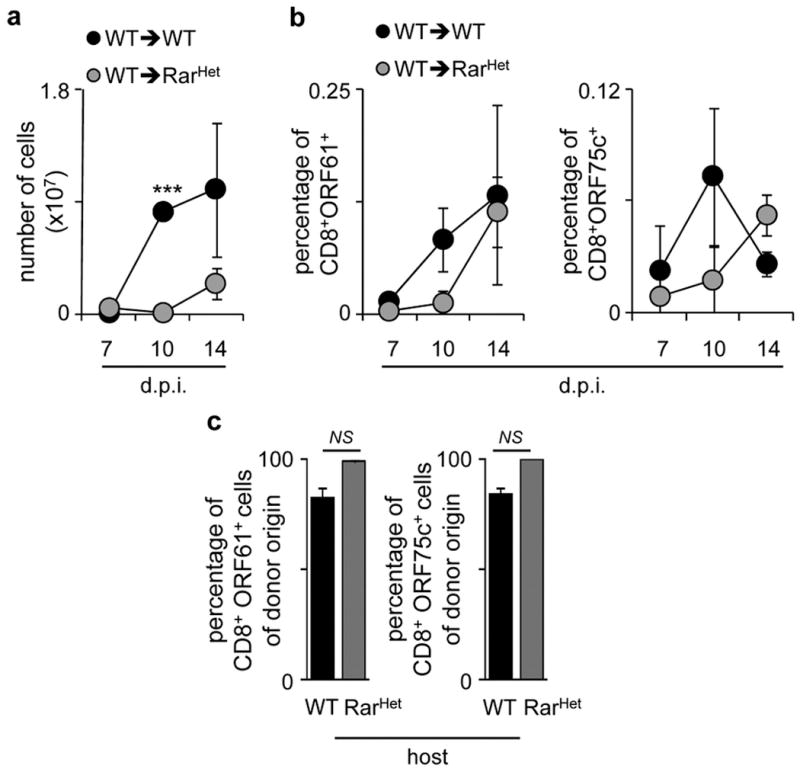
a, Intrathoracic lymph node cellularity in WT→WT and WT→RarHet chimeras at different days post infection (dpi). WT n=5; RarHet n=3. b, Percentage of CD8+ORF61+ (left) and ORF75c+ (right) T cells in intrathoracic lymph nodes at different days post infection (dpi). WT n=5; RarHet n=3. c. Percentage of donor CD45.1 CD8+ORF61+ (left) and CD8+ORF75c+ (right) T cells in WT→WT and WT→RarHet chimeras after infection with Murid herpesvirus-4. WT n=6; RarHet n=12. Error bars show s.e.. Two tailed t-test p values are indicated. *P<0.05; **P<0.01; ***P<0.001. n.s., not significant.
Extended Data Figure 9. Impact of maternal retinoids in ILC3s.
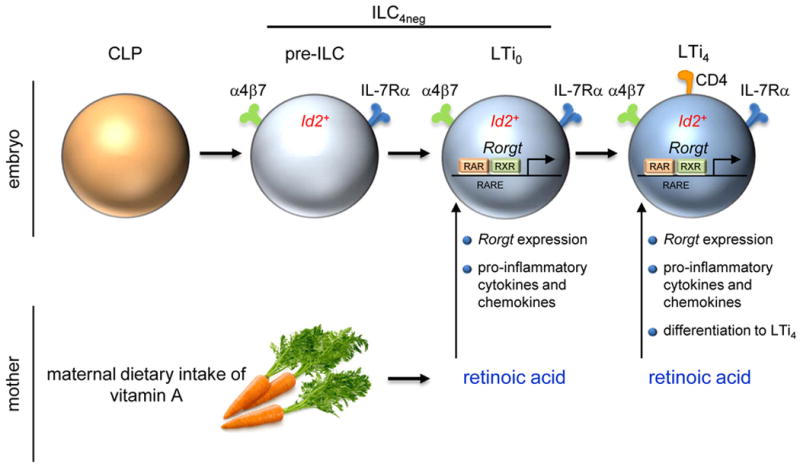
Maternal dietary intake of vitamin A is catabolised into bioactive retinoic acid (RA). RA signals control type 3 innate lymphoid cells (ILC3) in the embryo. Foetal ILC3s include ILC4neg and LTi4 cells. LTi4 cells are Id2+RORγt+, while enteric ILC4neg cells contain a minor subset of Id2+RORγt− cells (pre-ILCs). RA signalling operates in a cell-autonomous fashion, via direct regulation of Rorgt, programming innate pro-inflammatory cytokines and chemokines and differentiation of LTi4 cells.
Extended Data Table 1. Computational analysis of putative RARE sites in the Rorc locus.
Computational analysis was performed using TESS (Transcription Element Search System) (www.cbil.upenn.edu/tess). TSS (Rorg): ACGGGCCAGGTGCTCCCTCC; TSS (Rorgt): AGAAACACTGGGGGAGAGCTTTG.
| Site ID | Primer Sequences | Putative RARE Sites | Position | TESS Sequence entry | TESS Factor |
|---|---|---|---|---|---|
| A | TGAAGCAGCTAGTCACTTCC CAGCTCTCCAGCTTGTATTG | GAGGAGCAGGG | −7.837 Rorg TSS | GAGGtCAGGG | T00721 RAR-beta T01334 RXR-beta |
| B | GAAACTTTATCTGGGGCTGG TGAACTCAGGAAGAGCAGCA | GGTTCAGAGGT | −7,446 Rorg TSS | GGTTCA | T00721 RAR-beta |
| GGTTCAGAGGT | 100038 (RXR-alpha) | ||||
| C | AACCTGGCACTTCGCACTTAA GAGTGGGCGGACTTCTCAGA0 | TGAACT | −5.478 Rorg TSS | TGAACT | T00721 RAR-beta |
| D | GAGGCCTCTAAGTACCGCCATT CGCCCTGAATCCTGTCACA | AGGTCAGCACCA | −4.690 Rorg TSS | AGGTCA | T00721 RAR-beta |
| AGGTCA | _00000 RAR-beta | ||||
| AGGTCAGCACCA | T00719 RAR-alpha1 T01345 RXR-alpha | ||||
| E | CAGAGATGACCTAGTCAGTGGAGTACTG ACCCCCCAAAACCCTTGA | GGGGTCAAGGGT TGACCT | −1,800 Rorg TSS | GGGTCA | T00719 RAR-alpha1 T00720 RAR-gamma T00721 RAR-beta T01329 RAR-gamma |
| GGGTCA | _00000 RAR-beta | ||||
| GGGGTCA | T01331 RXR-alpha T01332 RXR-beta | ||||
| GGGTCA | T00719 RAR-alpha1 T00720 RAR-gamma T00721 RAR-beta T01329 RAR-gamma | ||||
| TGACCT | _00000 RAR-beta | ||||
| GGGTCAAGGGT | _00000 RXR-alpha | ||||
| GGGTCA | T00721 RAR-beta | ||||
| TGACCT | T00721 RAR-beta | ||||
| F | ACCACTGAGCCATCTCTCCTACC TTTTGTGATGTGGGTTCTGGG | GGGTCA | −1,638 Rorg TSS | GGGTCA | T00719RAR-alpha1 T00720 RAR-gamma T00721 RAR-beta T01329 RAR-gamma |
| GGGTCA | _00000 RAR-beta | ||||
| GGGTCA | T00721 RAR-beta | ||||
| G | GACAATCTCATCAGAGGAGG GGGCAACCAATGAGTATGTG | TCACCTCT | −1.619 Rorgt TSS | TCACCTC | _00000 RAR-gamma |
Acknowledgments
We thank the imaging, animal and flow cytometry facilities at IMM and UPC for technical assistance; Cathy Mendelsohn for proving ROSA26-RARa403 mice; N. Schmolka, J.G. van Rietschoten, R.E. van Kesteren, T.H.B. Geijtenbeek, S. Gringhuis, E. Keuning, J. Peterson-Maduro, M.G. Roukens, D. D’Astolfo, M. Vermunt, A.Rijerkerk, J. Koning, J. van der Meulen and B. Oliver for technical help; G. Vilhais-Neto, M.C. Coles, G. Eberl for helpful discussion. M. F., L. M.-S. and R. G. D. were supported by FCT, Portugal; H.V.-F. by EMBO (1648) and ERC (207057); D.R.L. by NIH (RO1AI080885) and HHMI; M.R.M. by Dutch MS research foundation (MS 12–797); S.A.vd.P. by NGI Breakthrough Horizon (40-41009-98-9077); and R.E.M. by a VICI (918.56.612) and ALW-TOP grant (09.048).
Footnotes
Author contribution M.F. wrote the manuscript, designed, performed and analysed the experiments in Figures: 1a,b,d,e,g,h,i; 2a,b,c,d,e,f,g,h; 3a,b,d,e,f,g,h,i; 4a,b,d,e,f,g,h,i,j; and Extended Data Figures: 1a,d,e,f; 2a,b,c,d; 3a,b,c,d,e,f,g,h; 4a,b,c,d; 5a,b,c; 6; 7a,b,c,d,e,f; 8a,b,c,d; 9a,b; 10a,b,c;. S.A.vd.P. wrote the manuscript, designed, performed and analysed the experiments in Figures: 1c,f; 3c,g,h,i; 4c; and Extended Data Figures: 1b,c,e; 5b,c; 6. R.G.D., H.R., R.M., L.M.–S., F.F.A., S.I., I.B., G.G., C.L.-A., T.K., D.S., T.O’T., M.R.M., Y.H., S.S-M. contributed to several experiments. C.G.-S. and J.P.S. provided Murid herpesvirus-4. D.R.L. and F.R.S provided Rorgt−/− embryos. E.H. and E.D. provided Ly-6A (Sca1)-GFP mice. R.E.M. and H.V.-F. supervised the work, planned the experiments and wrote the manuscript.
Author information The authors declare no competing financial interests.
References
- 1.Gluckman PD, Hanson MA. Living with the past: evolution, development, and patterns of disease. Science. 2004;305:1733–1736. doi: 10.1126/science.1095292. [DOI] [PubMed] [Google Scholar]
- 2.van de Pavert SA, Mebius RE. New insights into the development of lymphoid tissues. Nat Rev Immunol. 2010;10:664–674. doi: 10.1038/nri2832. [DOI] [PubMed] [Google Scholar]
- 3.Randall TD, Carragher DM, Rangel-Moreno J. Development of secondary lymphoid organs. Annu Rev Immunol. 2008;26:627–650. doi: 10.1146/annurev.immunol.26.021607.090257. [DOI] [PMC free article] [PubMed] [Google Scholar]
- 4.Mebius RE, Rennert P, Weissman IL. Developing lymph nodes collect CD4+CD3- LTbeta+ cells that can differentiate to APC, NK cells, and follicular cells but not T or B cells. Immunity. 1997;7:493–504. doi: 10.1016/s1074-7613(00)80371-4. [DOI] [PubMed] [Google Scholar]
- 5.Eberl G, et al. An essential function for the nuclear receptor RORgamma(t) in the generation of fetal lymphoid tissue inducer cells. Nat Immunol. 2004;5:64–73. doi: 10.1038/ni1022. [DOI] [PubMed] [Google Scholar]
- 6.Veiga-Fernandes H, et al. Tyrosine kinase receptor RET is a key regulator of Peyer’s Patch organogenesis. Nature. 2007;446:547–551. doi: 10.1038/nature05597. [DOI] [PubMed] [Google Scholar]
- 7.Patel A, et al. Differential RET signaling pathways drive development of the enteric lymphoid and nervous systems. Sci Signal. 2012;5:ra55. doi: 10.1126/scisignal.2002734. [DOI] [PubMed] [Google Scholar]
- 8.Cupedo T, et al. Presumptive lymph node organizers are differentially represented in developing mesenteric and peripheral nodes. J Immunol. 2004;173:2968–2975. doi: 10.4049/jimmunol.173.5.2968. [DOI] [PubMed] [Google Scholar]
- 9.Cherrier M, Sawa S, Eberl G. Notch, Id2, and RORgammat sequentially orchestrate the fetal development of lymphoid tissue inducer cells. J Exp Med. 2012;209:729–740. doi: 10.1084/jem.20111594. [DOI] [PMC free article] [PubMed] [Google Scholar]
- 10.van de Pavert SA, et al. Chemokine CXCL13 is essential for lymph node initiation and is induced by retinoic acid and neuronal stimulation. Nat Immunol. 2009;10:1193–1199. doi: 10.1038/ni.1789. [DOI] [PMC free article] [PubMed] [Google Scholar]
- 11.Niederreither K, Dolle P. Retinoic acid in development: towards an integrated view. Nat Rev Genet. 2008;9:541–553. doi: 10.1038/nrg2340. [DOI] [PubMed] [Google Scholar]
- 12.Iwata M. Retinoic acid production by intestinal dendritic cells and its role in T-cell trafficking. Semin Immunol. 2009;21:8–13. doi: 10.1016/j.smim.2008.09.002. [DOI] [PubMed] [Google Scholar]
- 13.Hall JA, et al. Essential role for retinoic acid in the promotion of CD4(+) T cell effector responses via retinoic acid receptor alpha. Immunity. 2011;34:435–447. doi: 10.1016/j.immuni.2011.03.003. [DOI] [PMC free article] [PubMed] [Google Scholar]
- 14.Mora JR, von Andrian UH. Role of retinoic acid in the imprinting of gut-homing IgA-secreting cells. Semin Immunol. 2009;21:28–35. doi: 10.1016/j.smim.2008.08.002. [DOI] [PMC free article] [PubMed] [Google Scholar]
- 15.Mucida D, et al. Retinoic acid can directly promote TGF-beta-mediated Foxp3(+) Treg cell conversion of naive T cells. Immunity. 2009;30:471–472. doi: 10.1016/j.immuni.2009.03.008. author reply 472–473. [DOI] [PMC free article] [PubMed] [Google Scholar]
- 16.Hall JA, Grainger JR, Spencer SP, Belkaid Y. The role of retinoic acid in tolerance and immunity. Immunity. 2011;35:13–22. doi: 10.1016/j.immuni.2011.07.002. [DOI] [PMC free article] [PubMed] [Google Scholar]
- 17.de Boer J, et al. Transgenic mice with hematopoietic and lymphoid specific expression of Cre. Eur J Immunol. 2003;33:314–325. doi: 10.1002/immu.200310005. [DOI] [PubMed] [Google Scholar]
- 18.Rosselot C, et al. Non-cell-autonomous retinoid signaling is crucial for renal development. Development. 2010;137:283–292. doi: 10.1242/dev.040287. [DOI] [PMC free article] [PubMed] [Google Scholar]
- 19.Sun Z, et al. Requirement for RORgamma in thymocyte survival and lymphoid organ development. Science. 2000;288:2369–2373. doi: 10.1126/science.288.5475.2369. [DOI] [PubMed] [Google Scholar]
- 20.Yokota Y, et al. Development of peripheral lymphoid organs and natural killer cells depends on the helix-loop-helix inhibitor Id2. Nature. 1999;397:702–706. doi: 10.1038/17812. [DOI] [PubMed] [Google Scholar]
- 21.Aliahmad P, de la Torre B, Kaye J. Shared dependence on the DNA-binding factor TOX for the development of lymphoid tissue-inducer cell and NK cell lineages. Nat Immunol. 2010;11:945–952. doi: 10.1038/ni.1930. [DOI] [PMC free article] [PubMed] [Google Scholar]
- 22.Possot C, et al. Notch signaling is necessary for adult, but not fetal, development of RORgammat(+) innate lymphoid cells. Nat Immunol. 2011;12:949–958. doi: 10.1038/ni.2105. [DOI] [PubMed] [Google Scholar]
- 23.Tachibana M, et al. Runx1/Cbfbeta2 complexes are required for lymphoid tissue inducer cell differentiation at two developmental stages. J Immunol. 2011;186:1450–1457. doi: 10.4049/jimmunol.1000162. [DOI] [PubMed] [Google Scholar]
- 24.Meier D, et al. Ectopic lymphoid-organ development occurs through interleukin 7-mediated enhanced survival of lymphoid-tissue-inducer cells. Immunity. 2007;26:643–654. doi: 10.1016/j.immuni.2007.04.009. [DOI] [PubMed] [Google Scholar]
- 25.Gredmark-Russ S, Cheung EJ, Isaacson MK, Ploegh HL, Grotenbreg GM. The CD8 T-cell response against murine gammaherpesvirus 68 is directed toward a broad repertoire of epitopes from both early and late antigens. J Virol. 2008;82:12205–12212. doi: 10.1128/JVI.01463-08. [DOI] [PMC free article] [PubMed] [Google Scholar]
- 26.Kiss EA, et al. Natural aryl hydrocarbon receptor ligands control organogenesis of intestinal lymphoid follicles. Science. 2011;334:1561–1565. doi: 10.1126/science.1214914. [DOI] [PubMed] [Google Scholar]
- 27.Lee JS, et al. AHR drives the development of gut ILC22 cells and postnatal lymphoid tissues via pathways dependent on and independent of Notch. Nat Immunol. 2011;13:144–151. doi: 10.1038/ni.2187. [DOI] [PMC free article] [PubMed] [Google Scholar]
- 28.Qiu J, et al. The aryl hydrocarbon receptor regulates gut immunity through modulation of innate lymphoid cells. Immunity. 2011;36:92–104. doi: 10.1016/j.immuni.2011.11.011. [DOI] [PMC free article] [PubMed] [Google Scholar]
- 29.Karrer U, et al. On the key role of secondary lymphoid organs in antiviral immune responses studied in alymphoplastic (aly/aly) and spleenless (Hox11(-)/-) mutant mice. J Exp Med. 1997;185:2157–2170. doi: 10.1084/jem.185.12.2157. [DOI] [PMC free article] [PubMed] [Google Scholar]
- 30.Spencer SP, et al. Adaptation of innate lymphoid cells to a micronutrient deficiency promotes type 2 barrier immunity. Science. 2014;343:432–437. doi: 10.1126/science.1247606. [DOI] [PMC free article] [PubMed] [Google Scholar]
- 31.Rawlins EL, Clark CP, Xue Y, Hogan BL. The Id2+ distal tip lung epithelium contains individual multipotent embryonic progenitor cells. Development. 2009;136:3741–3745. doi: 10.1242/dev.037317. [DOI] [PMC free article] [PubMed] [Google Scholar]
- 32.Eberl G, Littman DR. Thymic origin of intestinal alphabeta T cells revealed by fate mapping of RORgammat+ cells. Science. 2004;305:248–251. doi: 10.1126/science.1096472. [DOI] [PubMed] [Google Scholar]
- 33.Srinivas S, et al. Cre reporter strains produced by targeted insertion of EYFP and ECFP into the ROSA26 locus. BMC Dev Biol. 2001;1:4. doi: 10.1186/1471-213X-1-4. [DOI] [PMC free article] [PubMed] [Google Scholar]
- 34.Muzumdar MD, Tasic B, Miyamichi K, Li L, Luo L. A global double-fluorescent Cre reporter mouse. Genesis. 2007;45:593–605. doi: 10.1002/dvg.20335. [DOI] [PubMed] [Google Scholar]
- 35.de Bruijn MF, et al. Hematopoietic stem cells localize to the endothelial cell layer in the midgestation mouse aorta. Immunity. 2002;16:673–683. doi: 10.1016/s1074-7613(02)00313-8. [DOI] [PubMed] [Google Scholar]
- 36.Hogquist KA, et al. T cell receptor antagonist peptides induce positive selection. Cell. 1994;76:17–27. doi: 10.1016/0092-8674(94)90169-4. [DOI] [PubMed] [Google Scholar]
- 37.Mombaerts P, et al. RAG-1-deficient mice have no mature B and T lymphocytes. Cell. 1992;68:869–877. doi: 10.1016/0092-8674(92)90030-g. [DOI] [PubMed] [Google Scholar]
- 38.Niederreither K, et al. Embryonic retinoic acid synthesis is essential for heart morphogenesis in the mouse. Development. 2001;128:1019–1031. doi: 10.1242/dev.128.7.1019. [DOI] [PubMed] [Google Scholar]
- 39.Veiga-Fernandes H, Foster K, Patel A, Coles M, Kioussis D. Visualisation of lymphoid organ development. Methods Mol Biol. 2010;616:161–179. doi: 10.1007/978-1-60761-461-6_11. [DOI] [PubMed] [Google Scholar]
- 40.Huh JR, et al. Digoxin and its derivatives suppress TH17 cell differentiation by antagonizing RORgammat activity. Nature. 2011;472:486–490. doi: 10.1038/nature09978. [DOI] [PMC free article] [PubMed] [Google Scholar]
- 41.Sunil-Chandra NP, Efstathiou S, Arno J, Nash AA. Virological and pathological features of mice infected with murine gamma-herpesvirus 68. J Gen Virol. 1992;73(Pt 9):2347–2356. doi: 10.1099/0022-1317-73-9-2347. [DOI] [PubMed] [Google Scholar]
- 42.Weck KE, Barkon ML, Yoo LI, Speck SH, Virgin HI. Mature B cells are required for acute splenic infection, but not for establishment of latency, by murine gammaherpesvirus 68. J Virol. 1996;70:6775–6780. doi: 10.1128/jvi.70.10.6775-6780.1996. [DOI] [PMC free article] [PubMed] [Google Scholar]


