Abstract
Controversy regarding the number and function of ligand binding sites in neurotransmitter/sodium symporters arose from conflicting data in crystal structures and molecular pharmacology. Here, we designed novel tools for atomic force microscopy that directly measure the interaction forces between the serotonin transporter (SERT) and the S- and R-enantiomers of citalopram on the single molecule level. Our approach is based on force spectroscopy, which allows for the extraction of dynamic information under physiological conditions thus inaccessible via X-ray crystallography. Two distinct populations of characteristic binding strengths of citalopram to SERT were revealed in Na+-containing buffer. In contrast, in Li+-containing buffer, SERT showed only low force interactions. Conversely, the vestibular mutant SERT-G402H merely displayed the high force population. These observations provide physical evidence for the existence of two binding sites in SERT when accessed in a physiological context. Competition experiments revealed that these two sites are allosterically coupled and exert reciprocal modulation.
Keywords: nanopharmacology, serotonin transporter, citalopram, allostery, binding site
Graphical abstract
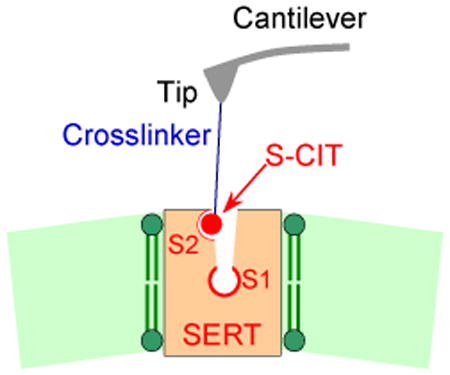
Novel tools for direct measurement of the interaction forces between the serotonin transporter and the S- and R-enantiomers of citalopram on the single molecule level allows for the demonstration of two distinct populations of characteristic binding strengths which provide physical evidence for the existence of two binding sites that are allosterically coupled and exert reciprocal modulation.

The serotonin transporter (SERT) shapes serotonergic neurotransmission by retrieving extracellular serotonin, thus replenishing the presynaptic stores[1]. SERT is a member of the neurotransmitter/sodium symporter (NSS) family and a common target of antidepressants (e.g. citalopram (CIT)) and illicit drugs (e.g cocaine). Because SERT is refractory to crystallographic analysis, structural models of SERT rely on crystal structures of homologues, i.e. bacterial LeuTAa[2], and more recently, dDAT (the Drosophila melanogaster dopamine transporter)[3]. This approach is limited by sequence divergence. Specific ligands of SERT, for instance, bind poorly to LeuTAa or DAT. There is controversy about the number of ligand binding sites in NSS[4-8]. Some studies provide evidence of two sites, i.e. a central S1-site occupied by the substrate in the occluded state and a second S2-site, located within the extracellular vestibule[9-15]. However, this has been questioned: S1 has been proposed to exclusively account for high-affinity binding of inhibitors and the substrate[4,5,16,17]. Moreover, to the best of our knowledge, no data of lifetime of the S2-site in SERT have been reported to date. To elucidate the number and the mechanism of the ligand binding site(s) in SERT, we used a nanopharmacological sensing approach based on single molecule recognition force spectroscopy (SMRFS)[18] to directly measure the interaction forces between SERT and both S- and R-enantiomers of CIT.
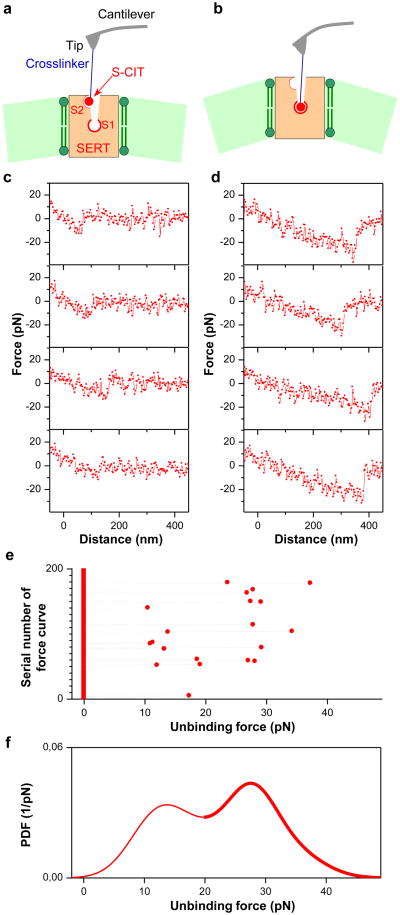
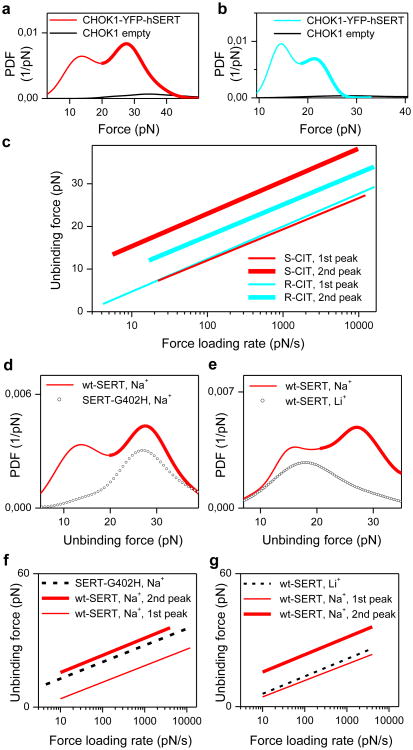
An alkyne-modified 5-aminomethyl analogue[19] of the pure S- or the R-enantiomer of CIT was covalently conjugated onto the AFM cantilever tip (Fig. 1a, supplementary Fig.1) via an azido-terminated flexible polyethylene glycol (PEG) linker through click chemistry (supplementary Methods). Single molecular force measurements were conducted by performing force-distance cycles on living CHOK1 cells that stably express human SERT. The S- or R-CIT-adorned AFM cantilever tip was lowered towards the cellular surface to allow for SERT binding and was subsequently moved upwards. When the CIT moiety on the AFM tip bound to SERT on the cell surface, a pulling force developed during the upward movement between the tip and cell membrane, causing the cantilever to bend downwards (Fig.1b). The pulling force increased to a critical value until the bond between SERT and CIT was ruptured (unbinding force). Force curves with distinct unbinding forces (Fig.1c and d) were observed when using the same conditions in repeated measurements (Fig.1e), and the experimental probability density function (PDF) of forces was thus generated (Fig.1f). These probability density functions represent the original data and can be viewed as the equivalent of continuous histograms. The PDF of unbinding forces obtained from an S-CIT-modified tip (Fig.1f) showed two distinct peaks, most likely reflecting the S-CIT rupture from binding sites with two different strengths of interaction. Two populations of unbinding forces were also observed with R-CIT-modified tips (Fig.2b). That these unbinding forces indeed arose from specific SERT/CIT interactions was verified in control experiments. On CHOK1 cells lacking SERT, binding activity (fraction of curves showing unbinding events, which equals to the area under the PDF line) was largely reduced, as evident from Fig.2a and b (black lines). In order to attain the dissociation rate constant (koff) and the width (xB) of prominent energy barriers of the interaction for the individual force populations (supplementary Fig.2), we depicted the specific unbinding forces as a function of the force loading rate (r) for both S- and R-CIT (Fig.2c). In particular, a maximum likelihood approach was employed as an estimation technique to fit a statistical model to the obtained data (supplementary Fig.2), and thus provide estimations for the parameters of the model. The Evans model[20] was employed as an analytical model to estimate for the maximum likelihood of xB and koff. According to the single energy barrier binding model, the probability p that the complex breaks at a certain force, F, is given as:
Figure 1. Two populations of unbinding events.
The cantilever (force sensor) tip was functionalized with S-CIT via a flexible crosslinker (a). Two populations of interaction forces were observed after repeated measurements (e). Four representative curves of each population are shown in (c) and (d) respectively, which likely arose from two different binding sites (a and b) in SERT. Larger forces result in longer unbinding lengths that mainly arise from deformation of the elastic cell membrane. An experimental probability density function (PDF) of the unbinding forces (f) was generated from data as shown in (e). For each unbinding force value, a Gaussian of unitary area with its center representing the unbinding force and the width reflecting its measuring uncertainty was computed. All Gaussians from one experimental setting were accordingly positioned, summed, and normalized with its binding probability to yield the experimental PDF of unbinding forces.
Figure 2. Identification of two binding sites.
Both S-CIT (a) and R-CIT (b) show two peaks in PDF curves of unbinding forces. Control experiments on cells lacking SERT revealed negligible binding activity for both S- and R-CIT tips (black lines in a and b). The unbinding forces of the two PDF peaks were plotted against the force loading rate for S- and R-CIT (c). This shows similar binding strength at the S2 site (corresponding to the first peak in force PDF) for S- and R-CIT, but reveals distinct binding forces at the S1 site (the second peak) for the two enantiomers. Force measurements on mutant SERT-G402H (point mutation in vestibular S2 site) show a single peak (d, f), which corresponds to the second peak for wt SERT. This indicates that the S2 binding site is not accessible with the mutation, but the S1 site remains intact. Force measurements on wt SERT in buffer without Na+ (Li+ buffer) display a single peak (e, g), which corresponds to the first peak for wt SERT in Na+ buffer. This indicates that the S1 site is completely inactivated in Li+ buffer, but the S2 binding site is still active. Force data points for force vs. loading rate plots are shown in supplementary Fig.2 and 3.
The fitted curves for the two populations of unbinding events (Fig.2c) showed similar binding strengths and dissociation rates for the weaker binding site of both enantiomers of CIT, but revealed much higher binding forces for S-CIT compared to R-CIT for the stronger binding site (supplementary Table 1). The distinct difference between S- and R-CIT at the stronger binding site is identical to the enantioselectivity of CIT, which was found at the S1 site in SERT[21].
To further verify the results from the force spectroscopy experiments, we measured koff of pegylated R-CIT and S-CIT by using the whole-cell patch-clamp technique (supplementary Methods and supplementary Fig.7). From electrophysiological measurements, koff values of pegylated R-CIT and S-CIT were in excellent agreement with the koff values at the S1 site determined by the force spectroscopy method (supplementary Table 2).
We identified the location of the binding sites for the two populations by recording forces of the interaction of S-CIT with SERT-G402H which contains a point mutation in the outer vestibule[15]. The force PDF from SERT-G402H (cf. Fig.2d) showed only a single peak, which corresponded to the second peak in the force PDF from wild type (wt) SERT. This indicates that the first peak in the force PDF from wt SERT originates from the vestibular S2 site, which is not accessible in SERT-G402H. The stronger binding site (S1) of SERT-G402H remained intact, but its interaction energy landscape was changed as evident from plots of the unbinding force versus the force loading rate (cf. Fig.2f, supplementary Table 1). In addition, we verified that Na+ ions were important for accessibility to the SERT binding sites by recording forces of S-CIT binding to wt SERT in Li+ buffer. The PDF showed a single peak in the force PDF (cf. Fig.2e) that coincided with the first peak in the force PDF observed in Na+ buffer. The absence of the second peak is consistent with the notion that the central S1 site is Na+-dependent. The persistence of the first peak implies that access to the vestibule S2 site does not require Na+.
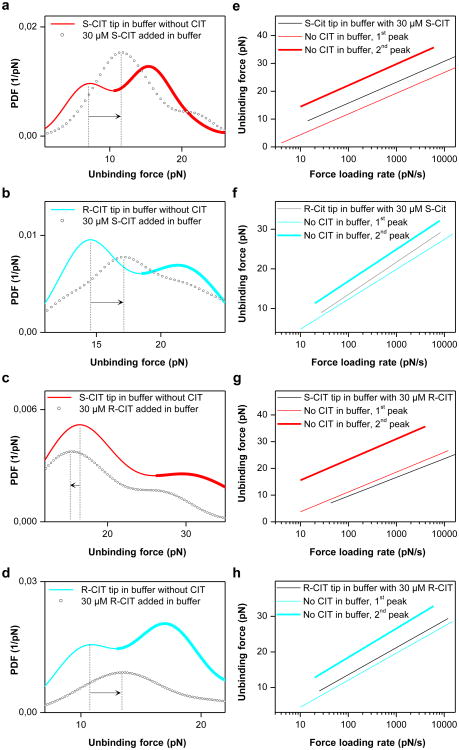
Dissociation of S-CIT at the central S1 site is delayed by occupancy of the vestibule S2 site with either S- or R-CIT[15]. This observation was interpreted as an allosteric modulation resulting in steric hindrance for S-CIT exiting S1. We sought to elucidate the interplay between the S1 and S2 sites and performed competition experiments by addition of free S- or R-CIT at saturating conditions (30 μM) in which the higher affinity central binding site was assumed to be occupied. In contrast to the control experiments (Fig.2a and b, black lines; supplementary Fig.4e and f), the binding activities for both the S- and the R-CIT-modified tips were not drastically reduced subsequent to the addition of CIT. The relative reduction of the binding activity was 0.16 ± 0.15 for S-CIT tips in S-CIT containing buffer, 0.38 ± 0.12 for S-CIT tips in R-CIT buffer, 0.06 ± 0.08 for R-CIT tips in S-CIT buffer, and 0.48 ± 0.06 for R-CIT tip in buffer with R-CIT (mean ± SEM, measured on 15, 18, 30, and 18 cells respectively with 3 different cycle times) (supplementary Fig.4). These data indicate that the lower affinity vestibule binding site is still accessible to CIT on the tip. As shown in Fig.3a-d, only a single peak remained visible in the force PDFs in the presence of S- or R-CIT in solution. This peak was attributed to the vestibule S2 site because the dissociation rates of CIT from the S2 site are much higher than those of the S1 site (supplementary Table 1). Thus, the AFM-tip tethered CIT which has a local concentration of ∼3.7 mM (corresponding to 1 CIT molecule within a hemisphere of radius ∼6 nm, defined by the length of PEG linker[22] through which CIT is coupled to the AFM tip) is likely to effectively compete with the CIT in solution for binding to the S2 site. The lifespan of the bond between the CIT from solution and the S1 site (∼20 min for S-CIT[9]) is much longer than the time the AFM tip dwells on the cell surface (25-350 ms), thus preventing CIT on the AFM tip from accessing the S1 site. The maximum of the remaining peak was shifted in the presence of CIT in solution when compared to the interaction forces of the S2 site in the absence of CIT (arrows in Fig.3a-d). The force maximum decreased for the S-CIT tip in R-CIT buffer (Fig.3c), whereas it increased in other conditions (Fig.3a,b,d). Force data points recorded in the absence and presence (supplementary Fig.5) of S- or R-CIT were plotted against the force loading rate (Fig.3e-h, supplementary Table 1). In the presence of S-CIT, the binding strength at the S2 site was clearly enhanced for S-CIT (Fig.3e, koff decreased from 0.796 s-1 to 0.246 s-1, P < 0.0001), but less significantly for R-CIT (Fig.3f, koff decreased from 0.705 s-1 to 0.609 s-1, P = 0.335). These results indicate that when S-CIT binds at the central S1 site, it exerts a positive allosteric modulation on the S2 site for S-CIT. R-CIT in solution enhanced the binding strength of R-CIT to S2 as well (Fig.3h, koff changed from 0.789 s-1 to 0.491 s-1, P = 0.014). However, when R-CIT binds to the S1 site, it reduces the binding strength of S-CIT at the S2 site (Fig.3g, koff increased from 0.968 s-1 to 1.385 s-1, P = 0.00015). The latter finding indicates a negative allosteric effect.
Figure 3. Allosteric effects revealed by force measurements.
Force PDFs (a, b) and force vs. loading rate plots (e, f) show that the S-CIT in solution blocked the S1 site (the second peak in the force PDF) but the S2 site was strengthened for both S- and R-CIT (shift of the first peak in force PDF to the right), which indicates a positive allosteric effect. R-CIT in solution blocked the S1 site and strengthened the S2 site for R-CIT (d, h) as well but weakened the S2 site for S-CIT (c, g) (shift of the first peak in force PDF to the left), which indicates a negative allosteric effect.
Our approach relied on nanopharmacological force sensing in physiological conditions and allowed for the extraction of dynamic information that is inaccessible via X-ray crystallography. The flexible PEG linker between the AFM tip and the drug molecule provide the unique opportunity to detect the transient binding site in SERT and to determine its lifetime, which is still impossible for other techniques. Accordingly, the current observations unequivocally document the existence of two binding sites by tracking binding events to SERT in the native membrane at the single molecule level. In addition, the experiments also showed that these two sites were allosterically coupled and exerted reciprocal modulation. Our experiments of force spectroscopy provided direct physical evidence of both positive and negative allostery at the single molecule level and identified the vestibular S2 binding site as the enigmatic allosteric site of SERT. Given the importance of allosteric regulation in biology and pharmacology, our nanopharmacological approach paved a new avenue to explore transient binding sites in clinically relevant membrane transporters and opened the door to quantitatively address the modulation of interaction forces between ligands and allosterically coupled binding sites.
Supplementary Material
Acknowledgments
We thank L. Wildling, D. Vater, M. Kastner, M. Leitner, and Q. Beatty for assistance, C. J. Loland and A. Ebner for discussion, N. Müller for NMR facilities. This work was supported by Austrian Science Fund Grant F35 and the National Institute on Drug Abuse-Intramural Research Program, NIH.
Footnotes
Supporting information for this article is given via a link at the end of the document.
References
- 1.Kristensen AS, et al. Pharmacol Rev. 2011;63:585–640. doi: 10.1124/pr.108.000869. [DOI] [PubMed] [Google Scholar]
- 2.Yamashita A, Singh SK, Kawate T, Jin Y, Gouaux E. Nature. 2005;437:215–223. doi: 10.1038/nature03978. [DOI] [PubMed] [Google Scholar]
- 3.Penmatsa A, Wang KH, Gouaux E. Nature. 2013;503:85–90. doi: 10.1038/nature12533. [DOI] [PMC free article] [PubMed] [Google Scholar]
- 4.Piscitelli CL, Krishnamurthy H, Gouaux E. Nature. 2010;468:1129–1132. doi: 10.1038/nature09581. [DOI] [PMC free article] [PubMed] [Google Scholar]
- 5.Wang H, Elferich J, Gouaux E. Nature Struct Mol Biol. 2012;19:212–219. doi: 10.1038/nsmb.2215. [DOI] [PMC free article] [PubMed] [Google Scholar]
- 6.Shi L, et al. Mol Cell. 2008;30:667–677. doi: 10.1016/j.molcel.2008.05.008. [DOI] [PMC free article] [PubMed] [Google Scholar]
- 7.Zhao Y, et al. Nature. 2011;474:109–113. doi: 10.1038/nature09971. [DOI] [PMC free article] [PubMed] [Google Scholar]
- 8.Quick M, Shi L, Zehnpfennig B, Weinstein H, Javitch JA. Nature Struct Mol Biol. 2012;19:207–211. doi: 10.1038/nsmb.2197. [DOI] [PMC free article] [PubMed] [Google Scholar]
- 9.Plenge P, Mellerup ET. Pharmacol Toxicol. 1997;80:197–201. doi: 10.1111/j.1600-0773.1997.tb00396.x. [DOI] [PubMed] [Google Scholar]
- 10.Chen F, et al. J Neurochem. 2005;92:21–28. doi: 10.1111/j.1471-4159.2004.02835.x. [DOI] [PubMed] [Google Scholar]
- 11.Plenge P, Gether U, Rasmussen SG. Eur J Pharmacol. 2007;567:1–9. doi: 10.1016/j.ejphar.2007.03.055. [DOI] [PubMed] [Google Scholar]
- 12.Zhong H, et al. Neurosci Lett. 2009;462:207–212. doi: 10.1016/j.neulet.2009.07.030. [DOI] [PubMed] [Google Scholar]
- 13.Sarker S, et al. Mol Pharmacol. 2010;78:1026–1035. doi: 10.1124/mol.110.067538. [DOI] [PMC free article] [PubMed] [Google Scholar]
- 14.Schmitt KC, Mamidyala S, Biswas S, Dutta AK, Reith MEJ. Neurochem. 2010;112:1605–1618. doi: 10.1111/j.1471-4159.2010.06583.x. [DOI] [PMC free article] [PubMed] [Google Scholar]
- 15.Plenge P, et al. J Biol Chem. 2012;287:39316–39326. doi: 10.1074/jbc.M112.371765. [DOI] [PMC free article] [PubMed] [Google Scholar]
- 16.Sinning S, et al. J Biol Chem. 2010;285:8363–8374. doi: 10.1074/jbc.M109.045401. [DOI] [PMC free article] [PubMed] [Google Scholar]
- 17.Andersen J, et al. Proc Natl Acad Sci USA. 2011;108:12137–12142. doi: 10.1073/pnas.1103060108. [DOI] [PMC free article] [PubMed] [Google Scholar]
- 18.Wildling L, et al. J Biol Chem. 2012;287:105–113. doi: 10.1074/jbc.M111.304873. [DOI] [PMC free article] [PubMed] [Google Scholar]
- 19.Kumar V, et al. ACS Med Chem Lett. 2014;5:696–699. doi: 10.1021/ml5000806. [DOI] [PMC free article] [PubMed] [Google Scholar]
- 20.Evans E, Ritchie K. Biophys J. 1997;72:1541–1555. doi: 10.1016/S0006-3495(97)78802-7. [DOI] [PMC free article] [PubMed] [Google Scholar]
- 21.Henry LK, et al. J Biol Chem. 2006;281:2012–2023. doi: 10.1074/jbc.M505055200. [DOI] [PubMed] [Google Scholar]
- 22.Kamruzzahan ASM, et al. Bioconjug Chem. 2006;17:1473–1481. doi: 10.1021/bc060252a. [DOI] [PubMed] [Google Scholar]
Associated Data
This section collects any data citations, data availability statements, or supplementary materials included in this article.


