

Abstract
Objective
This study tested the hypothesis that poverty experienced in early childhood, as measured by income-to-needs ratio, impacts functional brain connectivity at school age, which in turn mediates influences on child negative mood/depression.
Method
Participants were from a prospective longitudinal study of emotion development. Preschoolers 3–5 years of age were originally ascertained from primary care and day care sites in the St. Louis area and then were annually assessed behaviorally for up to 12 years. Healthy preschoolers and those with a history of depression symptoms participated in neuroimaging at school age. Using fMRI, we examined whole brain resting state functional connectivity with bilateral hippocampus and amygdala.
Results
Lower income-to-needs in preschool was associated with reduced connectivity between hippocampus and amygdala and a number of regions at school-age, including superior frontal cortex, lingual gyrus, posterior cingulate and putamen. Lower income-to-needs predicted greater negative mood/depression severity at school age, as did connectivity between left hippocampus and right superior frontal cortex and between right amygdala and right lingual gyrus. Connectivity mediated the relationship between income-to-needs and negative mood/depression at the time of scan.
Conclusions
The finding that lower income-to-needs in early childhood related to connectivity of the hippocampus and the amygdala, which in turn predicted negative mood/depression at school age, further highlights a critical role for poverty in shaping brain development and elucidates a relationship to negative child outcomes.
Keywords: Poverty, functional connectivity, negative mood, depression
INTRODUCTION
Poverty is one of the most powerful risk factors for poor developmental outcomes (1–7). Children who grow up in poverty have poorer cognitive and educational outcomes and are at a higher risk for a range of mental illness, including depression and antisocial behaviors (8). The mechanisms by which poverty contributes to these negative developmental outcomes in children are multifaceted and include factors such as limitations on educational opportunities, family stress, and adverse environmental exposures, such as lead, cigarette smoke, poor nutrition and air pollution (3, 6, 9).
The clear evidence for the negative outcomes associated with poverty has led to a growing number of studies examining how the early experience of poverty influences brain development as a potential mediating pathway. This literature has recently been summarized by Brito and Noble (10), who identified evidence for a range of structural brain differences associated with various indicators of poverty (i.e., income-to-needs, parent education), including reductions in whole brain gray and white matter volumes, as well as reduced thickness in some brain areas. One of the most consistent findings has been an association between poverty indicators and reductions in hippocampal and amygdala volumes (11–19), with every study that examined hippocampal or amygdala gray matter volumes reporting significant effects. Importantly, there is evidence that these alterations in hippocampal and amygdala volumes partially mediate the influence of poverty on later behavioral problems in children (12).
These findings in humans are consistent with the animal literature showing effects of stress and environmental enrichment on hippocampal cell proliferation, and dendritic length and branching (20–23). The human versus animal findings in regards to the amygdala are more complicated. As noted above, poverty is consistently associated with reduced amygdala volume. However, animal studies show increased amygdala dendritic arborizatoin following stress (23, 24), and human studies of institutional rearing have also shown increased amygdala volume (25). The differences in amygdala findings in the results of poverty versus institutional rearing studies may reflect the fact that children living in poverty can have intact attachment relationships, and thus the mechanisms may differ. Nonetheless, it is possible that the hippocampus and amygdala volume reductions associated with poverty might also influence connectivity of these regions. Both the hippocampus and amygdala show positive resting state functional connectivity (i.e., correlated spontaneous fluctuations in blood oxygen dependent fMRI measurements) with each other and other regions in the medial and anterior temporal lobes, as well with as the ventral medial prefrontal cortex (at age 10+ for this region) (26–28). In addition, both the hippocampus and amygdala show negative functional connectivity with bilateral dorsal prefrontal and parietal regions (28). These regions showing negative correlations with the hippocampus and amygdala are the same regions that are activated in studies of emotion regulation (29, 30), and these “anti-correlations” are thought to indicate top-down regulation of emotion and stress responsivity supported by hippocampus and amygdala regions, suggesting a critical role for the integrity of these connections in mood and affective function.
Importantly, several studies have shown that early life stress and/or maternal deprivation are associated with altered connectivity between amygdala and ventral medial prefrontal cortex and pregenual anterior cingulate (31–33), as well as other regions (34), connections that are thought to be critical for effective emotion regulation. Further, patterns of altered amygdala and/or hippocampal connectivity with ventral medial and/or dorsolateral prefrontal cortex have also been seen in individuals with depressive psychopathology (28, 35–37). Given the large literature linking early stress to later depression (38, 39) [though not selectively to depression], and given previous results of connectivity alterations associated with depression, in aggregate these findings taken together could suggest that disruptions in amygdala or hippocampal connectivity might be one pathway by which early adversity contributes to risk for negative emotionality and depression. Few studies have investigated the effects of poverty on functional connectivity, with one showing that poverty predicted altered connectivity of amygdala and medial prefrontal cortex while processing emotional faces (40). However, to our knowledge, no studies have examined whether early poverty influences resting state functional connectivity of either the amygdala or the hippocampus, which could reflect alterations in the integrity of intrinsic brain networks important for emotion responsivity and regulation.
The goal of the current study was to investigate the effects of poverty on childhood hippocampal and amygdala resting state connectivity, as a means to understanding whether alterations in these neural circuits might be one pathway contributing to the negative impact of poverty on child emotional outcomes and mental health. We also investigated whether poverty-related differences in amygdala or hippocampal connectivity predicted subsequent negative mood and depression severity and if so, whether these differences in functional brain connectivity mediated the influence of poverty on subsequent negative mood.
METHODS
Participants
Participants were N=105 children (54 females) from a larger sample enrolled in the 12-year longitudinal Preschool Depression Study (N=305 at baseline, between ages 3 and 6). Children were invited to participate in the scanning portion of the study if they were psychiatrically healthy or if they had experienced a history of clinical depression or anxiety (see Supplemental Materials for additional detail). All study procedures were reviewed and approved by the Washington University School of Medicine Institutional Review Board. Children were included in the current report if they had usable functional connectivity data at the first imaging session (between the ages of 7 and 12), as described below, and had parent report data on income-to-needs from the baseline PDS assessment. There were no significant differences in demographic variables (age, gender, income-to-needs) between the imaging sub-sample and the original sample. There were no significant differences in sex (X2=0.50, p=.29), baseline income to needs (t(181)=1.47, p=.144) or negative mood/depression scores (t(181)=0.96, p=0.34) at the time of scan between the children with and without usable functional connectivity data. However, the children with usable data were slightly but significantly older (t(181)=2.12, p=0.035; mean 9.93 years for children with usable data versus mean 9.53 years for children without usable data). Table 1 shows the characteristics of the current study sample.
Table 1.
Demographics for Current Sample
| Variable | Measure | |
|---|---|---|
| Number | Percent (%) | |
| Parent Years of Education | ||
| < High school diploma | 4 | 4% |
| High school diploma | 5 | 5% |
| Some college | 44 | 42% |
| College degree | 19 | 18% |
| Some graduate school or graduate/professional degree | 33 | 31% |
| Race | ||
| African-American | 55 | 52% |
| Caucasian | 39 | 39% |
| Other | 11 | 11% |
| Child Gender | ||
| Female | 54 | 51% |
| Mean | Standard Deviation | |
| Income-to-needs ratioa | 2.09b | 1.15 |
| Children’s Age (years) | 9.93c | 1.31 |
Footnote:
Total family income divided by the federal poverty level for a family of that size closest to the year data were collected.
range 0 to 3.93;
range 7 to 12.
Measures
Income to Needs
Income-to-needs ratio was operationalized as the total family income divided by the federal poverty level based on family size (41). The value was calculated based on baseline PDS data of caregiver reported total family income and total number of people living in the household.
Psychiatric Diagnosis and Symptom Severity
Participants were assessed annually using the Preschool Age Psychiatric Assessment (PAPA; parent interview, age 3–7) and Child and Adolescent Psychiatric Assessment (CAPA; parent interview, age ≥ 8, child interview, age ≥ 9)(42) (for further details see (43). A negative mood/depression severity score at the time of study entry (preschool, when income-to-needs was measured) was calculated using the sum number of core major depressive disorder symptoms (i.e., depressed mood, anhedonia, weight change, insomnia/hypersomnia, psychomotor agitation/retardation, fatigue, worthlessness/guilt, difficulty concentrating, suicidal ideation). A similar measure was created for school aged negative mood/depression severity, using items endorsed at the assessment wave closest to the scan. An anxiety severity score at the time of scan was calculated using the core items from generalized anxiety disorder, separation anxiety, and post-traumatic stress disorder. An externalizing psychopathology score at the time of scan was calculated using the core items from attention deficit hyperactivity disorder, oppositional defiant disorder and conduct disorder.
MRI Scanning
Participants completed a neuroimaging battery including high-resolution structural, diffusion imaging, functional task, and resting state scans collected using a 3.0 Tesla TIM TRIO Siemens scanner at Washington University. The resting state data from the first imaging session were the focus of the current analysis. T1-weighted structural images were acquired in the sagittal plane using an MPRAGE 3D sequence (TR=2400ms, TE=3.16ms, flip angle=8°, 176 slices, Field of View=256 mm, voxel size=1×1×1 mm). T2-weighted images were collected for registration purposes using a 3D SPACE acquisition (TR=3200ms, TE=497ms, 160 slices, Field of View=256, voxel size=1×1×1mm). Two resting state fMRI scan runs were acquired in the vast majority of children (N=102 in the current sample, the other children ran out of time or were unable to stay still during the second run), each including 164 frames (each ~6.8 minutes). Participants were instructed to rest with their eyes closed and to remain awake. Data were acquired using a spin-echo, echo-planar sequence sensitive to blood oxygenation level–dependent (BOLD) contrast (T2*) (TR=2500ms, TE=27ms, Field of View=256mm, flip=90°, voxel size=4×4×4mm, slices=36).
fMRI Pre-processing
Imaging data were preprocessed using the following steps: (1) correction for slice-dependent time shifts; (2) removal of first 4 images of each run to allow BOLD signal to reach steady state; (3) elimination of odd/even slice intensity differences due to interpolated acquisition; (4) realignment of data acquired from each participant within and across scan runs to compensate for rigid body motion (Ojemann et al., 1997); (5) image intensity normalization to a whole-brain mode value of 1000; (6) registration of the 3D structural volume (T1) to an atlas template (WU “711-2B”) in the Talairach coordinate system (Talairach & Tournoux, 1988) using a 12-parameter affine transform and re-sampling to 1mm cubic representation (44, 45); (7) co-registration of the 3D fMRI volume to the T2, and the T2 to the participant’s T1 structural image; and (8) transformation of the fMRI data to 3×3×3mm voxel atlas space using a single affine 12-parameter transform. Additional processing of the resting state functional connectivity used in-house software and is described in more detail in the Supplemental Materials.
fMRI Analysis
We used FreeSurfer v5.1 (46, 47) to create anatomical region of interest masks. The hippocampus and amygdala were segmented bilaterally from each participant’s T1 anatomical image, down-sampled to match the functional resolution of the atlas space (3×3×3mm), and registered to the common atlas space. These images were summed and a group-level anatomical mask was created by thresholding the region where at least half of participants had overlap in their hippocampal and amygdala segmentations, allowing a more anatomically precise region of interest than relying on atlas regions of interest. The time-series from these four regions of interest were correlated with the time-series at every other voxel in the brain to create four whole brain voxel-wise correlation maps for each participant. Values in these maps were converted to z-statistics using Fisher’s r-to-z transform. These maps were used as the dependent measures described below.
Statistical Analysis
Normative Connectivity Patterns
To establish the overall patterns of amygdala connectivity in our sample, two whole-brain one-sample t-tests were run using in-house software (FIDL analysis package, http://www.nil.wustl.edu/labs/fidl/index.html; (48)) to characterize significant voxel-wise resting state functional connectivity (r-to-z transformed) with the left or right hippocampus and amygdala (note – patterns for amygdala have been shown in (49)). Whole-brain t-test results were thresholded based on Monte Carlo simulations (3dClustSim, afni.nimh.nih.gov/pub/dist/doc/program_help/3dClustSim.html) at z≥3 and ≥ 17 contiguous voxels to achieve a whole brain false positive rate of p<.05.
To test our main hypotheses, we examined whole-brain regression analyses predicting voxel-wise functional connectivity with the left or right hippocampus and the left or right amygdala. After screening for outliers (there were none that were above three standard deviations in univariate analysis, or which had Mahalanobis distance metrics greater than p<.001 in multivariate analyses), baseline income-to-needs was the predictor of interest, controlling for ethnicity (African American versus white and other versus white), sex (females vs. males), and age at the time of scan, with both income-to-needs and age mean centered. Whole-brain z-maps for the effects of income-to-needs were thresholded as above based on Monte Carlo simulations at z≥3 and ≥ 17 contiguous voxels to control for multiple comparisons (whole brain p<.05). Average connectivity values within each significant cluster were extracted for each participant to examine the relationship of these connectivity measures to potential mediators and outcomes.
To examine whether the regions showing relationships between income-to-needs and amygdala/hippocampal connectivity related to negative mood/depression, we computed linear regressions using connectivity measures extracted from the identified regions of interest to predict negative mood/depression scores at the time of scanning, controlling for age and sex. To control false positives, we corrected for the number of regions identified within the amygdala connectivity analyses (p=.05/7, = .007) and within the hippocampal connectivity analyses (p=.05/4 = .0125). When significant, we then tested whether either income-to-needs or connectivity related to depression severity at the time of scan even when accounting for depression severity upon entry to the study (when income-to-needs was measured). Significant effects in such analyses indicated a relationship to change in negative mood/depression severity over time. We then asked whether the connectivity measures mediated the relationship between income-to-needs and negative mood/depression at the time of scan, using the PROCESS procedure in SPSS (50, 51), with age at scan, sex and ethnicity as covariates.
RESULTS
Characterizing Normative Hippocampal and Amygdala Connectivity Patterns
Figure 1 presents the results of whole-brain one-sample t-tests of left and right hippocampal and amygdala functional connectivity in this sample, with these seeds defined anatomically using FreeSurfer 5.1. Consistent with the prior literature, both the left and right hippocampus and amygdala show strong positive connectivity with much of the subcortex, including contralateral homologous regions, striatum, brain stem, posterior insula, and ventral medial prefrontal cortex (vmPFC). Additionally, both the hippocampus and amygdala show strong negative connectivity with much of the dorsomedial PFC, lateral PFC, anterior insula, cingulate cortex, and parietal lobe. The hippocampus also shows positive connectivity with posterior components of the default mode network (e.g., posterior cingulate, lateral parietal cortex).
Figure 1. Functional Connectivity of Hippocampus and Amygdala and Its Relationship to Income-to-Needs.
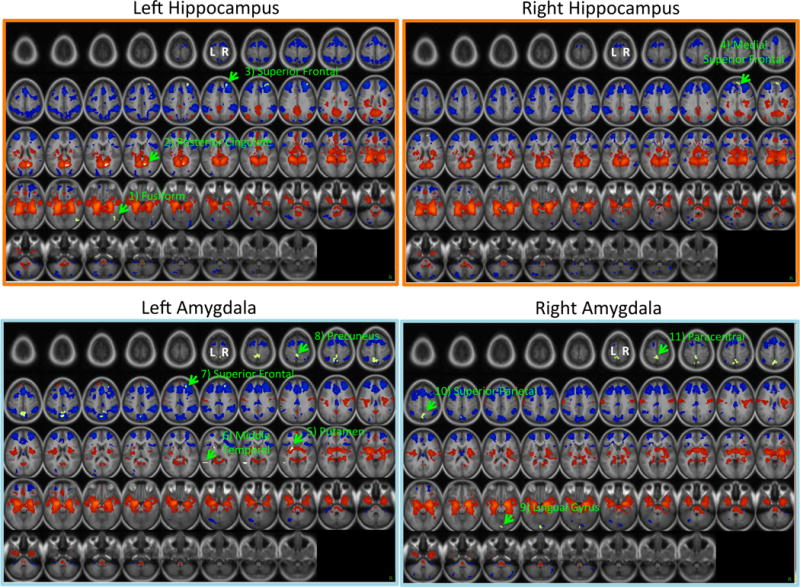
Regions in red show positive functional connectivity with the respective seed regions. Regions in blue show negative functional connectivity with the respective seed regions. Regions in green are ones that show relationships to income-to-needs. The numbers correspond to the regions listed in Table 2.
Does Income-to-Needs Predict Hippocampal and/or Amygdala Connectivity?
Whole-brain z-maps for the effects of income-to-needs, controlling for ethnicity, sex, and age at the time of scan, are shown in Table 2 and Figure 1. Income-to-needs negatively predicted connectivity between left hippocampus and regions in the right fusiform and the right superior frontal gyrus, as well as between right hippocampus and one region in the right superior frontal gyrus (higher income-to-needs -> more negative connectivity). In addition, income-to-needs positively predicted connectivity between left hippocampus and a region in the right posterior cingulate (higher income-to-needs -> more positive connectivity). Income-to-needs also negatively predicted connectivity between left amygdala and right superior frontal and right precuneus as well as between right amygdala and regions in the right lingual gyrus, left superior parietal, and left paracentral gyrus. Income-to-needs also positively predicted connectivity between left amygdala and both left putamen and left middle temporal gyrus. For the majority of these connectivity patterns related to poverty, higher income-to-needs predicted stronger connectivity in the normative direction (e.g., more positive for regions that typically show positive connectivity and more negative for those regions that typically show negative connectivity). The overlap between regions showing overall connectivity with either hippocampus or amygdala and those connections showing relationships to income-to-needs are illustrated in green in Figure 1. There were some regions showing functional connectivity relations to income-to-needs that did not appear in the average functional connectivity maps, including: left hippocampus to right fusiform, right hippocampus to medial superior frontal and left amygdala to middle temporal regions.
Table 2.
Functional Connectivity of Hippocampus and Amygdala Predicted by Income-to-needs
| Seed Region | Region (numbers correspond to regions in Figure 1) | Average Fisher’s r to Z with seed regionˆ | Brodmann Areas | X | Y | Z | Size (mm3) | r with Income-to-Needs# |
|---|---|---|---|---|---|---|---|---|
| L Hippocampus | ||||||||
| 1) R Fusiform Gyrus | −.05*** | BA 19 | 46 | −72 | −12 | 648 | −.40 | |
| 2) R Posterior Cingulate | .26*** | BA 30 | 10 | −60 | 15 | 837 | .29 | |
| 3) R Superior Frontal | −.14*** | BA 8 | 26 | 48 | 39 | 972 | −.40 | |
| R Hippocampus | ||||||||
| 4) Medial Superior Frontal | −.001 | BA 9 | 4 | 54 | 24 | 594 | −.34 | |
| L Amygdala | ||||||||
| 5) L Putamen | .08*** | −20 | 3 | 3 | 513 | .30 | ||
| 6) L Middle Temporal Gyrus | −.003 | BA 37 | −50 | −51 | 3 | 459 | .37 | |
| 7) R Superior Frontal Gyrus | −.11*** | BA 8 | 22 | 39 | 39 | 513 | −.31 | |
| 8) R Precuneus | −.06*** | BA 7 | 2 | −72 | 48 | 516 | −.39 | |
| R Amygdala | ||||||||
| 9) R Lingual Gyrus | −.04** | BA 18 | 2 | −93 | −18 | 459 | −.32 | |
| 10) L Superior Parietal | −.07*** | BA 7 | −8 | −63 | 57 | 1755 | −.28 | |
| 11) L Paracentral | −.03* | BA 5 | −4 | −42 | 63 | 972 | −.25 |
p<.05;
p<.01;
p<.001;
To illustrate the direction of “typical” connectivity;
For descriptive purposes to illustrate the direction of the relationships. Significance is not indicated since the regions were selected based on their significant relationship to income-to-needs.
Does Poverty and/or Brain Connectivity Predict Negative Mood/Depression Severity at the Time of Scan?
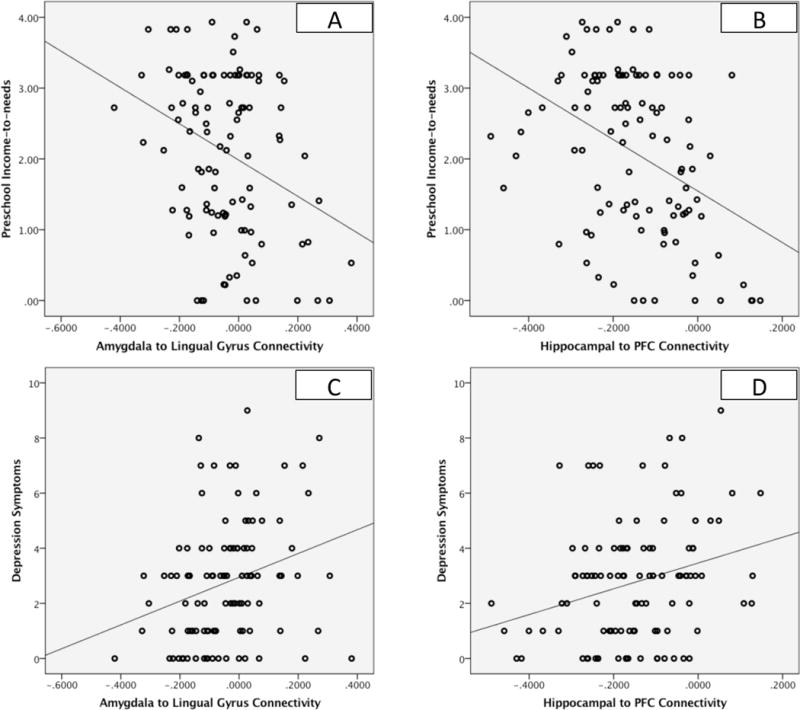
Income-to-needs from study entry at preschool age significantly negatively predicted negative mood/depression severity at the time of scanning at school age (β=−.27, p=.03). In addition, connectivity between the right amygdala and the right lingual gyrus (β=.28, p=.004), and between left hippocampus and right superior frontal cortex (β=.27, p=.005) were associated with negative mood/depression, after correcting for multiple comparisons. These relationships are illustrated in the scatterplots shown in Figure 2 and indicate that less negative connectivity (more positive) was associated with greater depression. Further, both income-to-needs and the connectivity measures continued to relate to negative mood/depression at the time of scan even after accounting for negative mood/depression at preschool age (all ps<.05), indicating a relationship between preschool levels of poverty, connectivity, and a change (i.e., increase) in negative mood/depression over time.
Figure 2. Functional Connectivity of Hippocampus and Amygdala in Relation to Income-to-Needs and Depression at the Time of Scan.
Scatterplots A and B illustrate the relationships of amygdala to lingual gyrus and hippocampal connectivity to income-to-needs, while scatterplots C and D illustrate the relationships of these connections to depression symptoms at the time of scanning.
Does Amygdala/Hippocampal Connectivity Mediate the Relationship Between Poverty and Negative Mood/Depression at the Time of Scan?
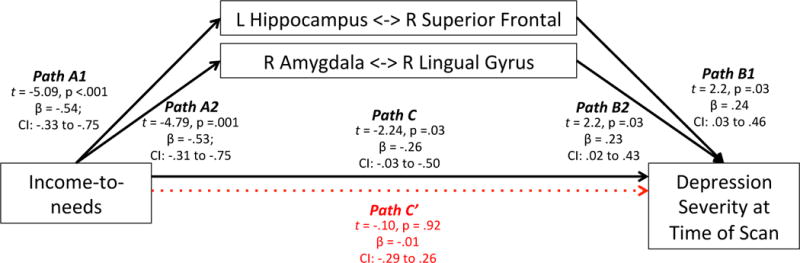
We next examined whether connectivity between right amygdala to right lingual gyrus and/or left hippocampus to right superior frontal gyrus mediated the relationship between poverty and negative mood/depression measured at the same time as the scan, since all three were related to depression in the analysis presented above. As shown in Figure 3, hippocampal and amygdala connectivity significantly mediated the relationship between income-to-needs and negative mood/depression at the time of scan.
Figure 3. Illustration of Functional Connectivity Mediation of Relationship Between Income-to-needs and Depression Severity at the Time of Scan.
This dual mediation model includes two “A” paths (income-to-needs to both left hippocampus/right superior frontal and right amygdala/right lingual gyrus connectivity) and thus also two corresponding “B” paths for the relationship of these functional connections to depression. The fact that both A and both B paths are significant indicates that each of these functional connections accounts for independent variance. Beta weights are standardized. Path C in black is the total effect of income-to-needs on depression severity with functional connectivity not in the model. This is significant. Path C’ in red is the direct effect of income-to-needs on depression severity with functional connectivity in the model. Path C’ is no longer significant with the connectivity measures in the modeling, indicating that the connectivity measures statistically mediate the relationship between poverty and subsequent depression.
All of the relationships reported above hold if we control for whether or not the child’s mother had depression. In addition, as noted, numerous studies have found that poverty predicts hippocampal and amygdala volume, including our own prior work on the hippocampus. While poverty is related to reduced hippocampal and amygdala volume in the current sample (see Supplemental Materials), these volumetric changes do not account for the relationship between income-to-needs and connectivity (see Supplemental Materials). Further, these relationships are not present for measures of anxious mood or externalizing psychopathology (see Supplemental Materials).
DISCUSSION
The goal of the current study was to investigate whether poverty was associated with alterations in the functional connectivity of either the amygdala or the hippocampus, and if so, whether these alterations in connectivity were associated with negative mood/depression severity. We found that income-to-needs significantly predicted connectivity of both bilateral amygdala and bilateral hippocampus, a novel finding that has not previously been shown. For the majority of regions, lower income-to-needs was associated with a reduction in the normative pattern of connectivity for these regions, such as reduced negative connectivity between left hippocampus and amygdala and right superior frontal cortex, functional connections thought to play a key role in emotion regulation. Further, both income-to-needs and amygdala/hippocampus connectivity were associated with the severity of negative mood/depression at the time of scanning, even after controlling for negative mood/depression at preschool age. These findings indicate that both poverty and connectivity were associated with an increase in negative mood/depression over time, as well as overall severity levels at the time of scanning. Importantly, connectivity between the left hippocampus and right superior frontal gyrus and between the right amygdala and right lingual gyrus mediated the relationship between income-to-needs and negative mood/depression at the time of scanning. As noted in the introduction, numerous studies have shown volumetric differences associated with poverty, including consistent reductions in amygdala and hippocampal volumes, as well as a recent large scale study showing reductions in surface area associated with poverty (52), which mediated links between poverty and cognitive function. Importantly, these alterations in connectivity associated with income-to-needs found in the current study were not secondary to an influence of poverty on amygdala/hippocampus volume, and point to the importance of functional as well as structure in the pathways by which poverty shapes child brain function and subsequent negative cognitive, emotional and mental health outcomes.
Our results are consistent with a growing body of literature documenting that the early experience of poverty has a host of negative influences on child development and that at least some of these negative outcomes are mediated by the relationship of poverty to brain structure and function. The current findings identify a relationship between functional connectivity among regions known to be critical for effective emotion regulation as a mediator of the detrimental effects of poverty on negative emotional outcomes. In particular, one of our key findings was a relationship between lower income-to-needs and reduced negative connectivity between the left hippocampus and amygdala and the right superior frontal gyrus. Patterns of “anti” correlations between frontal regions and amygdala/hippocampal regions are thought to reflect top-down regulation of emotion and stress reactivity by cognitive control systems that can help implement effective emotion regulation (29, 30). Of note, we do not mean to imply that these alterations in hippocampal to prefrontal connectivity associated with poverty reflect changes in structural connectivity, as regions can show functional connectivity even in the absence of direct structural connections. Further, we do not suggest a unique relationship to either left hippocampus or to superior prefrontal cortex, as examining images with a less conservative statistical threshold indicates that this area of connectivity extends down into dorsolateral prefrontal cortex and is present for the right as well as left hippocampal seeds, albeit at a less significant level. Nonetheless, the fact that the reduction in left hippocampus to right superior frontal connectivity was associated with negative mood/depression both the time of scan is consistent with a hypothesized role for such connectivity patterns in emotion regulation and is consistent with other work showing a relationship between altered hippocampal to prefrontal connectivity and depression (28). Further, these findings are generally consistent with other results published in this sample, including reduced hippocampal and amygdala volumes associated with poverty (11), reduced amygdala to cognitive control network connectivity among children with a history of depression or who are at risk for depression (35) and an interaction between genetic variation associated with increased stress reactivity and life events in predicting reduced hippocampal and amygdala volume (53).
The finding that connectivity between right amygdala and right lingual gyrus also mediated the relationship of income-to-needs to negative mood/depression at the time of scan was somewhat more surprising. Our whole-brain analysis of the normative patterns of connectivity with the amygdala did not reveal significant amygdala to lingual gyrus connectivity, though average connectivity was significant, albeit modest, when examined as a region of interest (see Table 2). As such, it is not clear whether this relationship indicates the presence of anomalous positive connectivity only present in those with low income/high depression, or the presence of negative connectivity only among those with high income/low depression. However, prior work on amygdala connectivity has demonstrated negative correlations between both lateral basal and superficial amygdala regions and lingual gyrus, though in a somewhat more superior region than we saw (26). Lingual gyrus has been related to visual form and word processing, but not typically with emotion processing. However, a growing number of studies have reported altered activity of the lingual gyrus in relationship to negative emotion processing in individuals with mood and psychotic disorders (54–57), particularly in relationship to the modulation of negative emotions. Combined with our current results, this prior work suggests the need for more focused research on the role of the lingual gyrus, and its connectivity with the amygdala, in emotion processing and emotion regulation.
A potential limitation of these data is that the original study sample was oversampled for preschoolers with symptoms of depression, which might limit generalizability. Specifically, we found that income-to-needs was associated with higher negative mood/depression. Some prior literature focusing on categorical diagnoses has suggested that change in poverty had stronger effects on disruptive behavioral problems (e.g., conduct) than emotional (e.g., depression/anxiety) problems in children (58, 59). However, work in older individuals provides evidence for a causal relationship between poverty and depression (60–63). In general, rates of emotional disorders are much lower than rates of disruptive behavioral symptoms in children, potentially limiting power to detect effects in childhood. Our sample was enriched for depression symptoms, which may have allowed greater power to detect such relationships with depression as compared to anxiety or disruptive disorders. Thus, it would be important in future work to replicate these results in a more epidemiological sample. Further, it is also likely that the relationships between connectivity and depression are more complex and bi-directional and the he current study design cannot definitely address causality. Further, the current analysis focused on income-to-needs, and work is needed to understand the impact of additional factors also frequently associated with poverty. We did not find that the current findings were influenced by maternal support or life events (see Supplemental Materials), but future work would benefit from including assessments of factors such as nutrition, school quality, and other indicators of enriched versus impoverished environments known to be associated with low income-to-needs.
In summary, the current findings provide highly novel data indicating that poverty influenced functional brain connectivity in regions thought to be critical for emotion regulation, and that these changes in connectivity are a mediating factor by which poverty is associated with subsequent negative emotional and mental health outcome. These data add to the growing awareness of the immense public health crisis represented by the huge number of children growing up in poverty and the likely long-lasting impacts these experiences have on brain development and on negative mood and depression.
Supplementary Material
Acknowledgments
Supported by NIH R01s MH064769-06 and MH090786.
Footnotes
Disclosures
Drs. Belden, Gaffrey, Luby, Harms, Pagliaccio and Sylvester declare no conflict of interest. Dr. Barch has consulted for Pfizer, Amgen, Roche and Takeda, and has a contract to analyze imaging data for Pfizer. Ms. Tillman discloses no conflict of interest.
References
- 1.Carneiro PM, Heckman JJ. In: Human Capital Policy in Inequality in America: What role for human capital policies. Heckman JJ, Krueger AB, Friedman BM, editors. Cambridge, MA: MIT Press; 2003. [Google Scholar]
- 2.Brooks-Gunn J, Duncan GJ. The effects of poverty on children. The Future of children/Center for the Future of Children, the David and Lucile Packard Foundation. 1997;7:55–71. [PubMed] [Google Scholar]
- 3.Freedman D, Woods GW. Neighborhood Effects, Mental Illness and Criminal Behavior: A Review. Journal of politics and law. 2013;6:1–16. doi: 10.5539/jpl.v6n3p1. [DOI] [PMC free article] [PubMed] [Google Scholar]
- 4.Leung JT, Shek DT. Poverty and adolescent developmental outcomes: a critical review. International journal of adolescent medicine and health. 2011;23:109–114. doi: 10.1515/ijamh.2011.019. [DOI] [PubMed] [Google Scholar]
- 5.Perkins SC, Finegood ED, Swain JE. Poverty and language development: roles of parenting and stress. Innovations in clinical neuroscience. 2013;10:10–19. [PMC free article] [PubMed] [Google Scholar]
- 6.Rauch SA, Lanphear BP. Prevention of disability in children: elevating the role of environment. The Future of children/Center for the Future of Children, the David and Lucile Packard Foundation. 2012;22:193–217. doi: 10.1353/foc.2012.0006. [DOI] [PubMed] [Google Scholar]
- 7.Raver CC. Low-income children’s self-regulation in the classroom: scientific inquiry for social change. Am Psychol. 2012;67:681–689. doi: 10.1037/a0030085. [DOI] [PMC free article] [PubMed] [Google Scholar]
- 8.Yoshikawa H, Aber JL, Beardslee WR. The effects of poverty on the mental, emotional, and behavioral health of children and youth: implications for prevention. Am Psychol. 2012;67:272–284. doi: 10.1037/a0028015. [DOI] [PubMed] [Google Scholar]
- 9.Roosa MW, Jones S, Tein JY, Cree W. Prevention science and neighborhood influences on low-income children’s development: theoretical and methodological issues. American journal of community psychology. 2003;31:55–72. doi: 10.1023/a:1023070519597. [DOI] [PubMed] [Google Scholar]
- 10.Brito NH, Noble KG. Socioeconomic status and structural brain development. Front Neurosci. 2014;8:276. doi: 10.3389/fnins.2014.00276. [DOI] [PMC free article] [PubMed] [Google Scholar]
- 11.Luby J, Belden A, Botteron K, Marrus N, Harms MP, Babb C, Nishino T, Barch D. The effects of poverty on childhood brain development: the mediating effect of caregiving and stressful life events. JAMA pediatrics. 2013;167:1135–1142. doi: 10.1001/jamapediatrics.2013.3139. [DOI] [PMC free article] [PubMed] [Google Scholar]
- 12.Hanson JL, Nacewicz BM, Sutterer MJ, Cayo AA, Schaefer SM, Rudolph KD, Shirtcliff EA, Pollak SD, Davidson RJ. Behavioral problems after early life stress: contributions of the hippocampus and amygdala. Biol Psychiatry. 2015;77:314–323. doi: 10.1016/j.biopsych.2014.04.020. [DOI] [PMC free article] [PubMed] [Google Scholar]
- 13.Jednorog K, Altarelli I, Monzalvo K, Fluss J, Dubois J, Billard C, Dehaene-Lambertz G, Ramus F. The influence of socioeconomic status on children’s brain structure. PLoS One. 2012;7:e42486. doi: 10.1371/journal.pone.0042486. [DOI] [PMC free article] [PubMed] [Google Scholar]
- 14.Hanson JL, Chandra A, Wolfe BL, Pollak SD. Association between income and the hippocampus. PLoS One. 2011;6:e18712. doi: 10.1371/journal.pone.0018712. [DOI] [PMC free article] [PubMed] [Google Scholar]
- 15.Noble KG, Grieve SM, Korgaonkar MS, Engelhardt LE, Griffith EY, Williams LM, Brickman AM. Hippocampal volume varies with educational attainment across the life-span. Front Hum Neurosci. 2012;6:307. doi: 10.3389/fnhum.2012.00307. [DOI] [PMC free article] [PubMed] [Google Scholar]
- 16.Noble KG, Houston SM, Kan E, Sowell ER. Neural correlates of socioeconomic status in the developing human brain. Dev Sci. 2012;15:516–527. doi: 10.1111/j.1467-7687.2012.01147.x. [DOI] [PMC free article] [PubMed] [Google Scholar]
- 17.Butterworth P, Cherbuin N, Sachdev P, Anstey KJ. The association between financial hardship and amygdala and hippocampal volumes: results from the PATH through life project. Soc Cogn Affect Neurosci. 2012;7:548–556. doi: 10.1093/scan/nsr027. [DOI] [PMC free article] [PubMed] [Google Scholar]
- 18.Piras F, Cherubini A, Caltagirone C, Spalletta G. Education mediates microstructural changes in bilateral hippocampus. Hum Brain Mapp. 2011;32:282–289. doi: 10.1002/hbm.21018. [DOI] [PMC free article] [PubMed] [Google Scholar]
- 19.Staff RT, Murray AD, Ahearn TS, Mustafa N, Fox HC, Whalley LJ. Childhood socioeconomic status and adult brain size: childhood socioeconomic status influences adult hippocampal size. Ann Neurol. 2012;71:653–660. doi: 10.1002/ana.22631. [DOI] [PubMed] [Google Scholar]
- 20.van Praag H, Kempermann G, Gage FH. Neural consequences of environmental enrichment. Nat Rev Neurosci. 2000;1:191–198. doi: 10.1038/35044558. [DOI] [PubMed] [Google Scholar]
- 21.Hirase H, Shinohara Y. Transformation of cortical and hippocampal neural circuit by environmental enrichment. Neuroscience. 2014;280:282–298. doi: 10.1016/j.neuroscience.2014.09.031. [DOI] [PubMed] [Google Scholar]
- 22.Okuda H, Tatsumi K, Makinodan M, Yamauchi T, Kishimoto T, Wanaka A. Environmental enrichment stimulates progenitor cell proliferation in the amygdala. J Neurosci Res. 2009;87:3546–3553. doi: 10.1002/jnr.22160. [DOI] [PubMed] [Google Scholar]
- 23.Eiland L, Ramroop J, Hill MN, Manley J, McEwen BS. Chronic juvenile stress produces corticolimbic dendritic architectural remodeling and modulates emotional behavior in male and female rats. Psychoneuroendocrinology. 2012;37:39–47. doi: 10.1016/j.psyneuen.2011.04.015. [DOI] [PMC free article] [PubMed] [Google Scholar]
- 24.Vyas A, Mitra R, Shankaranarayana Rao BS, Chattarji S. Chronic stress induces contrasting patterns of dendritic remodeling in hippocampal and amygdaloid neurons. J Neurosci. 2002;22:6810–6818. doi: 10.1523/JNEUROSCI.22-15-06810.2002. [DOI] [PMC free article] [PubMed] [Google Scholar]
- 25.Tottenham N, Hare TA, Quinn BT, McCarry TW, Nurse M, Gilhooly T, Millner A, Galvan A, Davidson MC, Eigsti IM, Thomas KM, Freed PJ, Booma ES, Gunnar MR, Altemus M, Aronson J, Casey BJ. Prolonged institutional rearing is associated with atypically large amygdala volume and difficulties in emotion regulation. Developmental science. 2010;13:46–61. doi: 10.1111/j.1467-7687.2009.00852.x. [DOI] [PMC free article] [PubMed] [Google Scholar]
- 26.Roy AK, Shehzad Z, Margulies DS, Kelly AM, Uddin LQ, Gotimer K, Biswal BB, Castellanos FX, Milham MP. Functional connectivity of the human amygdala using resting state fMRI. Neuroimage. 2009;45:614–626. doi: 10.1016/j.neuroimage.2008.11.030. [DOI] [PMC free article] [PubMed] [Google Scholar]
- 27.Marquez de la Plata CD, Garces J, Shokri Kojori E, Grinnan J, Krishnan K, Pidikiti R, Spence J, Devous MD, Sr, Moore C, McColl R, Madden C, Diaz-Arrastia R. Deficits in functional connectivity of hippocampal and frontal lobe circuits after traumatic axonal injury. Arch Neurol. 2011;68:74–84. doi: 10.1001/archneurol.2010.342. [DOI] [PMC free article] [PubMed] [Google Scholar]
- 28.Cao X, Liu Z, Xu C, Li J, Gao Q, Sun N, Xu Y, Ren Y, Yang C, Zhang K. Disrupted resting-state functional connectivity of the hippocampus in medication-naive patients with major depressive disorder. J Affect Disord. 2012;141:194–203. doi: 10.1016/j.jad.2012.03.002. [DOI] [PubMed] [Google Scholar]
- 29.Buhle JT, Silvers JA, Wager TD, Lopez R, Onyemekwu C, Kober H, Weber J, Ochsner KN. Cognitive Reappraisal of Emotion: A Meta-Analysis of Human Neuroimaging Studies. Cereb Cortex. 2013 doi: 10.1093/cercor/bht154. [DOI] [PMC free article] [PubMed] [Google Scholar]
- 30.Diekhof EK, Geier K, Falkai P, Gruber O. Fear is only as deep as the mind allows: a coordinate-based meta-analysis of neuroimaging studies on the regulation of negative affect. Neuroimage. 2011;58:275–285. doi: 10.1016/j.neuroimage.2011.05.073. [DOI] [PubMed] [Google Scholar]
- 31.Burghy CA, Stodola DE, Ruttle PL, Molloy EK, Armstrong JM, Oler JA, Fox ME, Hayes AS, Kalin NH, Essex MJ, Davidson RJ, Birn RM. Developmental pathways to amygdala-prefrontal function and internalizing symptoms in adolescence. Nat Neurosci. 2012;15:1736–1741. doi: 10.1038/nn.3257. [DOI] [PMC free article] [PubMed] [Google Scholar]
- 32.Fan Y, Herrera-Melendez AL, Pestke K, Feeser M, Aust S, Otte C, Pruessner JC, Boker H, Bajbouj M, Grimm S. Early life stress modulates amygdala-prefrontal functional connectivity: implications for oxytocin effects. Hum Brain Mapp. 2014;35:5328–5339. doi: 10.1002/hbm.22553. [DOI] [PMC free article] [PubMed] [Google Scholar]
- 33.Gee DG, Gabard-Durnam LJ, Flannery J, Goff B, Humphreys KL, Telzer EH, Hare TA, Bookheimer SY, Tottenham N. Early developmental emergence of human amygdala-prefrontal connectivity after maternal deprivation. Proc Natl Acad Sci U S A. 2013;110:15638–15643. doi: 10.1073/pnas.1307893110. [DOI] [PMC free article] [PubMed] [Google Scholar]
- 34.Grant MM, Wood K, Sreenivasan K, Wheelock M, White D, Thomas J, Knight DC, Deshpande G. Influence of early life stress on intra- and extra-amygdaloid causal connectivity. Neuropsychopharmacology. 2015;40:1782–1793. doi: 10.1038/npp.2015.28. [DOI] [PMC free article] [PubMed] [Google Scholar]
- 35.Luking KR, Repovs G, Belden AC, Gaffrey MS, Botteron KN, Luby JL, Barch DM. Functional connectivity of the amygdala in early-childhood-onset depression. Journal of the American Academy of Child and Adolescent Psychiatry. 2011;50:1027–1041 e1023. doi: 10.1016/j.jaac.2011.07.019. [DOI] [PMC free article] [PubMed] [Google Scholar]
- 36.Veer IM, Beckmann CF, van Tol MJ, Ferrarini L, Milles J, Veltman DJ, Aleman A, van Buchem MA, van der Wee NJ, Rombouts SA. Whole brain resting-state analysis reveals decreased functional connectivity in major depression. Front Syst Neurosci. 2010;4 doi: 10.3389/fnsys.2010.00041. [DOI] [PMC free article] [PubMed] [Google Scholar]
- 37.Davey CG, Whittle S, Harrison BJ, Simmons JG, Byrne ML, Schwartz OS, Allen NB. Functional brain-imaging correlates of negative affectivity and the onset of first-episode depression. Psychol Med. 2015;45:1001–1009. doi: 10.1017/S0033291714002001. [DOI] [PubMed] [Google Scholar]
- 38.Kessler RC, McLaughlin KA, Green JG, Gruber MJ, Sampson NA, Zaslavsky AM, Aguilar-Gaxiola S, Alhamzawi AO, Alonso J, Angermeyer M, Benjet C, Bromet E, Chatterji S, de Girolamo G, Demyttenaere K, Fayyad J, Florescu S, Gal G, Gureje O, Haro JM, Hu CY, Karam EG, Kawakami N, Lee S, Lepine JP, Ormel J, Posada-Villa J, Sagar R, Tsang A, Ustun TB, Vassilev S, Viana MC, Williams DR. Childhood adversities and adult psychopathology in the WHO World Mental Health Surveys. Br J Psychiatry. 2010;197:378–385. doi: 10.1192/bjp.bp.110.080499. [DOI] [PMC free article] [PubMed] [Google Scholar]
- 39.Green JG, McLaughlin KA, Berglund PA, Gruber MJ, Sampson NA, Zaslavsky AM, Kessler RC. Childhood adversities and adult psychiatric disorders in the national comorbidity survey replication I: associations with first onset of DSM-IV disorders. Arch Gen Psychiatry. 2010;67:113–123. doi: 10.1001/archgenpsychiatry.2009.186. [DOI] [PMC free article] [PubMed] [Google Scholar]
- 40.Javanbakht A, King AP, Evans GW, Swain JE, Angstadt M, Phan KL, Liberzon I. Childhood Poverty Predicts Adult Amygdala and Frontal Activity and Connectivity in Response to Emotional Faces. Front Behav Neurosci. 2015;9:154. doi: 10.3389/fnbeh.2015.00154. [DOI] [PMC free article] [PubMed] [Google Scholar]
- 41.McLoyd VC. Socioeconomic disadvantage and child development. Am Psychol. 1998;53:185–204. doi: 10.1037//0003-066x.53.2.185. [DOI] [PubMed] [Google Scholar]
- 42.Egger H, Ascher B, Angold A. Preschool Age Psychiatric Assessment (PAPA): Version 1.1. Durham, NC: Center for Developmental Epidemiology, Duke University Medical Center; 1999. [Google Scholar]
- 43.Luby JL, Si X, Belden AC, Tandon M, Spitznagel E. Preschool depression: homotypic continuity and course over 24 months. Archives of General Psychiatry. 2009;66:897–905. doi: 10.1001/archgenpsychiatry.2009.97. [DOI] [PMC free article] [PubMed] [Google Scholar]
- 44.Buckner RL, Head D, Parker J, Fotenos AF, Marcus D, Morris JC, Snyder AZ. A unified approach for morphometric and functional data analysis in young, old, and demented adults using automated atlas-based head size normalization: reliability and validation against manual measurement of total intracranial volume. Neuroimage. 2004;23:724–738. doi: 10.1016/j.neuroimage.2004.06.018. [DOI] [PubMed] [Google Scholar]
- 45.Ojemann J, Akbudak E, Snyder A, McKinstry R, Raichle M, Conturo T. Anatomic localization and quantitative analysis of gradient refocused echo-planar fMRI susceptibility artifacts. Neuroimage. 1997;6:156–167. doi: 10.1006/nimg.1997.0289. [DOI] [PubMed] [Google Scholar]
- 46.Fischl B, Salat DH, Busa E, Albert M, Dieterich M, Haselgrove C, van der Kouwe A, Killiany R, Kennedy D, Klaveness S, Montillo A, Makris N, Rosen B, Dale AM. Whole brain segmentation: automated labeling of neuroanatomical structures in the human brain. Neuron. 2002;33:341–355. doi: 10.1016/s0896-6273(02)00569-x. [DOI] [PubMed] [Google Scholar]
- 47.Fischl B, van der Kouwe A, Destrieux C, Halgren E, Segonne F, Salat DH, Busa E, Seidman LJ, Goldstein J, Kennedy D, Caviness V, Makris N, Rosen B, Dale AM. Automatically parcellating the human cerebral cortex. Cerebral Cortex. 2004;14:11–22. doi: 10.1093/cercor/bhg087. [DOI] [PubMed] [Google Scholar]
- 48.Ollinger JM, Corbetta M, Shulman GL. Separating processes within a trial in event-related functional MRI. Neuroimage. 2001;13:218–229. doi: 10.1006/nimg.2000.0711. [DOI] [PubMed] [Google Scholar]
- 49.Pagliaccio D, Luby JL, Bogdan R, Agrawal A, Gaffrey MS, Belden AC, Botteron KN, Harms MP, Barch DM. Amygdala functional connectivity, HPA axis genetic variation and life stress in children and relations to o and emotion regulation. Journal of Abnormal Psychology. doi: 10.1037/abn0000094. [DOI] [PMC free article] [PubMed] [Google Scholar]
- 50.Preacher KJ, Hayes AF. Asymptotic and resampling strategies for assessing and comparing indirect effects in multiple mediator models. Behavior Research Methods. 2008;40:879–891. doi: 10.3758/brm.40.3.879. [DOI] [PubMed] [Google Scholar]
- 51.Hayes AF. Introduction to mediation, moderation, and conditional process analysis: A regression-based approach. New York, NY: The Guildford Press; 2013. [Google Scholar]
- 52.Noble KG, Houston SM, Brito NH, Bartsch H, Kan E, Kuperman JM, Akshoomoff N, Amaral DG, Bloss CS, Libiger O, Schork NJ, Murray SS, Casey BJ, Chang L, Ernst TM, Frazier JA, Gruen JR, Kennedy DN, Van Zijl P, Mostofsky S, Kaufmann WE, Kenet T, Dale AM, Jernigan TL, Sowell ER. Family income, parental education and brain structure in children and adolescents. Nat Neurosci. 2015;18:773–778. doi: 10.1038/nn.3983. [DOI] [PMC free article] [PubMed] [Google Scholar]
- 53.Pagliaccio D, Luby JL, Bogdan R, Agrawal A, Gaffrey MS, Belden AC, Botteron KN, Harms MP, Barch DM. Stress-system genes and life stress predict cortisol levels and amygdala and hippocampal volumes in children. Neuropsychopharmacology. 2014;39:1245–1253. doi: 10.1038/npp.2013.327. [DOI] [PMC free article] [PubMed] [Google Scholar]
- 54.Berge D, Carmona S, Salgado P, Rovira M, Bulbena A, Vilarroya O. Limbic activity in antipsychotic naive first-episode psychotic subjects during facial emotion discrimination. Eur Arch Psychiatry Clin Neurosci. 2014;264:271–283. doi: 10.1007/s00406-013-0465-5. [DOI] [PubMed] [Google Scholar]
- 55.Cerullo MA, Eliassen JC, Smith CT, Fleck DE, Nelson EB, Strawn JR, Lamy M, DelBello MP, Adler CM, Strakowski SM. Bipolar I disorder and major depressive disorder show similar brain activation during depression. Bipolar Disord. 2014;16:703–712. doi: 10.1111/bdi.12225. [DOI] [PMC free article] [PubMed] [Google Scholar]
- 56.Kim GW, Yang JC, Jeong GW. Emotional effect on cognitive control in implicit memory tasks in patients with schizophrenia. Neuroreport. 2015;26:647–655. doi: 10.1097/WNR.0000000000000405. [DOI] [PubMed] [Google Scholar]
- 57.Kong F, Hu S, Wang X, Song Y, Liu J. Neural correlates of the happy life: the amplitude of spontaneous low frequency fluctuations predicts subjective well-being. Neuroimage. 2015;107:136–145. doi: 10.1016/j.neuroimage.2014.11.033. [DOI] [PubMed] [Google Scholar]
- 58.Costello EJ, Compton SN, Keeler G, Angold A. Relationships between poverty and psychopathology: a natural experiment. JAMA. 2003;290:2023–2029. doi: 10.1001/jama.290.15.2023. [DOI] [PubMed] [Google Scholar]
- 59.Ozer EJ, Fernald LC, Manley JG, Gertler PJ. Effects of a conditional cash transfer program on children’s behavior problems. Pediatrics. 2009;123:e630–637. doi: 10.1542/peds.2008-2882. [DOI] [PubMed] [Google Scholar]
- 60.Galea S, Ahern J, Nandi A, Tracy M, Beard J, Vlahov D. Urban neighborhood poverty and the incidence of depression in a population-based cohort study. Annals of epidemiology. 2007;17:171–179. doi: 10.1016/j.annepidem.2006.07.008. [DOI] [PMC free article] [PubMed] [Google Scholar]
- 61.Mehta K, Kramer H, Durazo-Arvizu R, Cao G, Tong L, Rao M. Depression in the US population during the time periods surrounding the great recession. J Clin Psychiatry. 2015;76:e499–504. doi: 10.4088/JCP.14m09637. [DOI] [PubMed] [Google Scholar]
- 62.Ozer EJ, Fernald LC, Weber A, Flynn EP, VanderWeele TJ. Does alleviating poverty affect mothers’ depressive symptoms? A quasi-experimental investigation of Mexico’s Oportunidades programme. Int J Epidemiol. 2011;40:1565–1576. doi: 10.1093/ije/dyr103. [DOI] [PMC free article] [PubMed] [Google Scholar]
- 63.Simmons LA, Braun B, Charnigo R, Havens JR, Wright DW. Depression and poverty among rural women: a relationship of social causation or social selection? The Journal of rural health: official journal of the American Rural Health Association and the National Rural Health Care Association. 2008;24:292–298. doi: 10.1111/j.1748-0361.2008.00171.x. [DOI] [PubMed] [Google Scholar]
Associated Data
This section collects any data citations, data availability statements, or supplementary materials included in this article.