The crystallization, data collection and experimental phasing using the multiwavelength anomalous dispersion technique of A. thaliana FUT1 is described.
Keywords: plant cell walls, fucosyltransferase, xyloglucan, MAD, tantalum bromide, Arabidopsis thaliana
Abstract
The plant cell wall is a complex network of polysaccharides made up of cellulose, hemicelluloses and pectins. Xyloglucan (XyG), which is the main hemicellulosic component of dicotyledonous plants, has attracted much attention for its role in plant development and for its many industrial applications. The XyG-specific fucosyltransferase (FUT1) adds a fucose residue from GDP-fucose to the 2-O position of the terminal galactosyl residues on XyG side chains. Recombinant FUT1 from Arabidopsis thaliana was crystallized in two different crystal forms, with the best diffracting crystals (up to 1.95 Å resolution) belonging to the monoclinic space group P21, with unit-cell parameters a = 87.6, b = 84.5, c = 150.3 Å, β = 96.3°. Ab initio phases were determined using a two-wavelength anomalous dispersion experiment on a tantalum bromide-derivatized crystal with data collected at the rising and descending inflection points of the Ta white line. An interpretable electron-density map was obtained after elaborate density modification. Model completion and structural analysis are currently under way.
1. Introduction
The cell wall of flowering plants such as Arabidopsis thaliana is a dynamic structure that provides a strong rigid body that is resistant to high osmotic pressure from the protoplast but is also sufficiently plastic to permit expansion of the plant cell. Nowadays, it is also considered for human uses as a carbon-neutral and renewable resource for many applications, from the food industry to second-generation biofuels (Burton & Fincher, 2014 ▸). The current view of the plant cell wall describes a structural network mainly composed of associated complex polysaccharides such as cellulose and hemicelluloses, embedded in a pectin matrix, which physically interact and are mostly responsible for cell–cell adhesion (Park & Cosgrove, 2015 ▸). In Arabidopsis, xyloglucan appears to be a key hemicellulosic polymer owing its ability to interact with cellulose microfibrils. Moreover, it can be modified by a large set of cell wall modifying proteins, such as β-1,4-endoglucanase or expansins, permitting controlled cell growth. The xyloglucan from Arabidopsis is composed of a tetra-β-1,4-linked glucan backbone minimal unit, in which the first three glucose residues are substituted with α-1,6-xylose. The xylosyl residues can then be further decorated by a β-1,2-galactosyl moiety and ultimately fucosylated to form a fuco-galacto-xyloglucan polymer (Cocuron et al., 2007 ▸; Cavalier & Keegstra, 2006 ▸; Vanzin et al., 2002 ▸). Perrin et al. (1999 ▸) described the characterization of FUT1, a xyloglucan α-1,2-fucosyltransferase from Arabidopsis that catalyses the last step of xyloglucan side-chain decoration, in which a fucose residue is added onto the galactose moiety. Other xyloglucan-synthesizing enzymes have subsequently been characterized, providing a reasonable picture of xyloglucan biosynthesis, although the organization of these enzymes in the Golgi apparatus still remains elusive (Zabotina, 2012 ▸; Oikawa et al., 2013 ▸). Structural characterization of the glycosyltransferases responsible for xyloglucan biosynthesis, such as FUT1, would allow the interaction of these enzymes with their substrates, inhibitors or protein partners during xyloglucan-biosynthetic events to be understood (Chou et al., 2015 ▸; Dumont et al., 2015 ▸). Recently, a recombinant form of FUT1 was produced and purified to homogeneity using a eukaryotic expression system (Cicéron et al., unpublished work). Here, we report the crystallization, X-ray diffraction analysis and structure determination by anomalous dispersion of the Arabidopsis plant cell wall fucosyltransferase FUT1.
2. Materials and methods
2.1. Macromolecule production
The recombinant A. thaliana FUT1 protein was cloned, expressed and purified (Cicéron et al., unpublished work). Briefly, the pVT-Bac-His1-FUT1Δ68 plasmid harbouring the fut1 gene, deprived of the first 68 N-terminal residues (comprising the Golgi anchoring transmembrane helix) and preceded by noncleavable histidine and X-press tags, was used to co-transfect Sf9 insect cells (Baculovirus Expression Vector System, Pharmingen) with BaculoGold AcNPV DNA. Cells were incubated for 72 h at 300 K for effective virus amplification. The high-titre virus stock solution was further used for the infection of Hi5 (High Five) cells (Invitrogen). The Hi5 cells were grown for 4 d in serum-free EXCELL405 medium (Sigma–Aldrich) at 300 K in a shaking incubator at 120 rev min−1. The cells and impurities were removed by centrifugation at 13 000g for 30 min and the supernatant fraction containing secreted FUT1 was loaded onto a histidine-tag purification column (cOmplete His-Tag, Roche) previously equilibrated with 25 mM HEPES buffer pH 7.4, 500 mM NaCl. Protein was eluted using an imidazole gradient to 500 mM, concentrated and further purified by size-exclusion chromatography using a Superdex 200 10/300 GL column (GE Healthcare) equilibrated with 25 mM HEPES buffer pH 7.4, 150 mM NaCl. The quality of the eluted fractions was evaluated by SDS–PAGE and dynamic light scattering (DLS), and the samples were pooled accordingly. The protein was concentrated and stored at 253 K until further use.
2.2. Crystallization
Initial crystallization screening using Structure Screen 2 (Molecular Dimensions) was performed at 292 K in vapour-diffusion hanging drops of 2 µl volume (1:1 protein:precipitant ratio). Numerous conditions produced phase separation or encouraging precipitate and were used to design a customized screen of PEGs, salts and different buffers, from which initial crystals could be obtained. The best crystals with respect to size, shape and X-ray diffraction capability were obtained in 100 mM HEPES buffer pH 7.5 with (i) 500 mM NaCl, 18%(w/v) PEG 8K or (ii) 500 mM sodium acetate, 20%(w/v) PEG 4K after one week at 292 K. Crystals were cryoprotected in their mother liquor supplemented with 15%(v/v) ethylene glycol and flash-cooled in liquid nitrogen. Crystal derivatization with several heavy atoms at different concentrations resulted in marginal or nonspecific incorporation, as shown by anomalous indicators in XDS (Kabsch, 2010 ▸) and AIMLESS (Evans & Murshudov, 2013 ▸; CCanom, SigAno and Mid-Slope anomalous probability). Successful incorporation was obtained by soaking FUT1 crystals (from the two crystallization conditions) with 1 mM tantalum bromide cluster (Ta6Br12) solution for 20–24 h. Crystals were back-soaked in cryoprotectant solution to remove clusters that were present in solvent channels or were not specifically bound.
2.3. Data collection and processing
Native and derivative X-ray diffraction data were measured using a Pilatus 6M-F detector on the ID29 beamline at ESRF (de Sanctis et al., 2012 ▸; Table 1 ▸). Anomalous dispersion data were collected at two different positions from a Ta6Br12-derivatized crystal at the rising (IpR; 9.880 keV) and descending (IpD; 9.887 keV) inflection-point energies of the tantalum white-line L III edge, as judged from the energy scan. X-ray diffraction images were integrated with XDS (Kabsch, 2010 ▸), combined in POINTLESS (Evans, 2011 ▸) and further scaled internally and relative to each other with AIMLESS (Evans & Murshudov, 2013 ▸). The data quality was further assessed with phenix.xtriage (Afonine et al., 2012 ▸). Anomalous signal content was estimated with SHELXC, which was also used to prepare the input file for a heavy-atom search in SHELXD (Sheldrick, 2008 ▸), considering the Ta6Br12 cluster as a single superatom. Experimental phases were calculated and refined with SHARP (de la Fortelle & Bricogne, 1997 ▸) using a two-wavelength MAD phasing protocol. Noncrystallographic symmetry matrices were determined using the phenix.find_ncs_from_density tool from the PHENIX package (Adams et al., 2010 ▸).
Table 1. Collection and processing of data sets from derivatized and native FUT1 crystals.
Values in parentheses are for the outer shell.
| Ta6Br12 derivative | Native | |||
|---|---|---|---|---|
| IpD | IpR | Form A | Form B | |
| Diffraction source | ID29, ESRF | ID29, ESRF | ID29, ESRF | ID29, ESRF |
| Wavelength (Å) | 1.2540 | 1.2549 | 0.9762 | 1.2398 |
| Temperature (K) | 100 | 100 | 100 | 100 |
| Detector | Pilatus 6M-F | Pilatus 6M-F | Pilatus 6M-F | Pilatus 6M-F |
| Crystal-to-detector distance (mm) | 464.5 | 464.1 | 328.2 | 439.3 |
| Rotation range per image (°) | 0.05 | 0.05 | 0.1 | 0.1 |
| Total rotation range (°) | 360 | 360 | 224 | 360 |
| Exposure time per image (s) | 0.02 | 0.02 | 0.02 | 0.02 |
| Space group | P21 | P21 | P21 | P21 |
| a, b, c (Å) | 87.6, 84.5, 150.3 | 87.6, 84.6, 150.4 | 87.7, 85.3, 150.3 | 82.1, 79.5, 87.1 |
| β (°) | 96.3 | 96.2 | 96.3 | 115.4 |
| Mosaicity (°) | 0.10 | 0.10 | 0.07 | 0.08 |
| Resolution range (Å) | 48.9–2.90 (3.00–2.90) | 49.8–2.90 (2.99–2.90) | 49.1–1.95 (1.98–1.95) | 45.1–2.75 (2.90–2.75) |
| Total No. of reflections | 332062 (30113) | 332544 (30694) | 684651 (33347) | 181645 (26982) |
| No. of unique reflections | 48440 (4386) | 48541 (4377) | 160187 (7884) | 25970 (3734) |
| Completeness (%) | 99.5 (98.6) | 99.4 (98.1) | 99.8 (99.8) | 98.0 (97.5) |
| Anomalous completeness (%) | 99.0 (97.5) | 98.9 (97.9) | — | — |
| Multiplicity | 6.9 (6.9) | 6.9 (7.0) | 4.3 (4.2) | 7.0 (7.2) |
| Anomalous multiplicity | 3.5 (3.5) | 3.5 (3.6) | — | — |
| 〈I/σ(I)〉 | 16.1 (5.1) | 20.6 (7.1) | 15.4 (2.4) | 12.8 (2.0) |
| R r.i.m. | 0.104 (0.423) | 0.073 (0.264) | 0.059 (0.610) | 0.113 (0.833) |
| Overall B factor from Wilson plot (Å2) | 36.6 | 37.5 | 30.7 | 46.8 |
| No. of sites | 4 | |||
| f′/f′′ (refined) | −24.0/14.9 | −9.1/12.8 | ||
| FOM (SHARP) | 0.17 | |||
| FOM (RESOLVE) | 0.66 | |||
The experimental phases were further improved by solvent flattening, averaged by noncrystallographic symmetry and extended to higher resolution in RESOLVE (Terwilliger, 2000 ▸). The model initially autobuilt by RESOLVE was inspected and manually edited in Coot (Emsley et al., 2010 ▸) and used for molecular replacement in Phaser (McCoy et al., 2007 ▸) with a native data set. Final model building and refinement with phenix.refine (Afonine et al., 2012 ▸) are currently under way.
3. Results and discussion
3.1. Crystal characterization and substructure determination
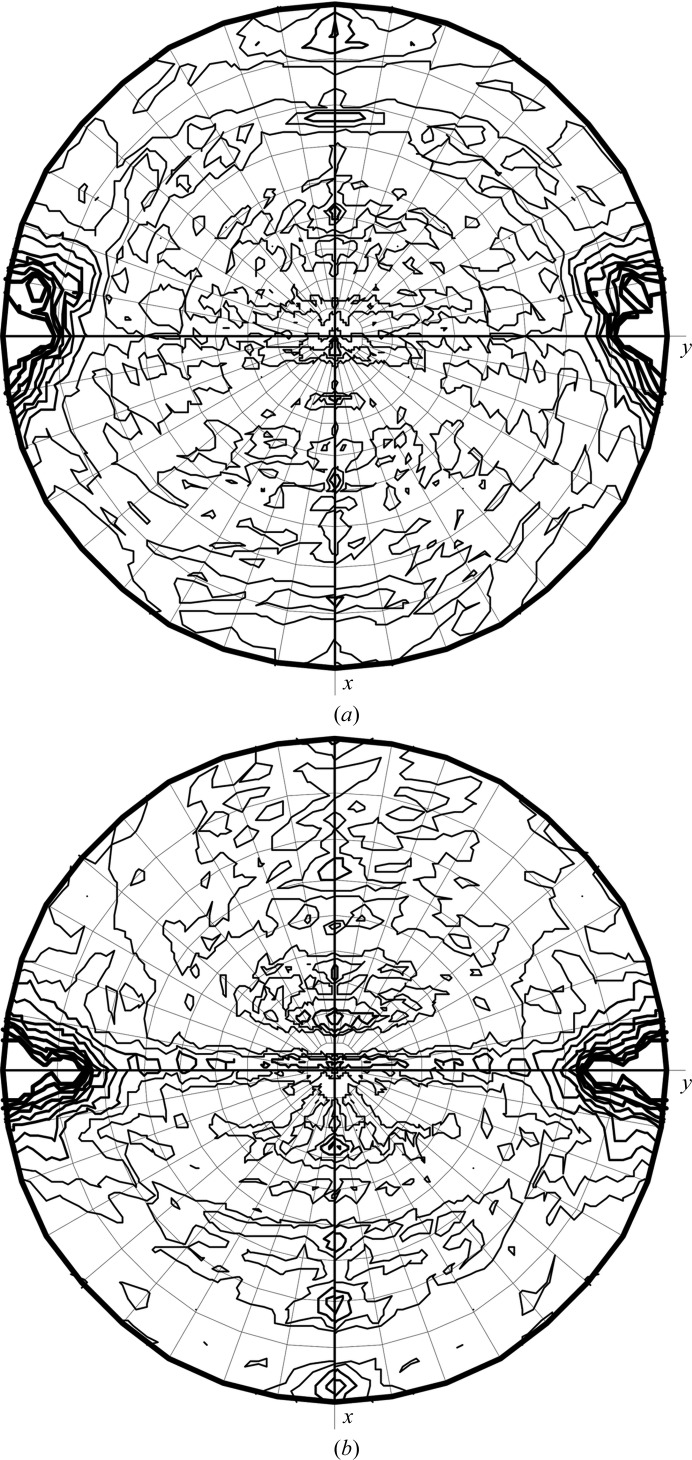
Recently, FUT1 was successfully expressed and purified to homogeneity using a two-step procedure, with a final concentration of 7 mg ml−1. The purity and quality of the enzyme preparation were assessed by dynamic light scattering (DLS), mass spectrometry and SDS–PAGE analysis. The recombinant FUT1 protein is a 521-amino-acid molecule that is organized as a dimer in solution (Cicéron et al., unpublished work). FUT1 crystals suitable for X-ray data collection at a synchrotron source were produced in two different conditions from a manually designed crystallization screen (§2.2). In both conditions, two crystal forms were obtained that were indistinguishable in shape and size. Crystal form A belonged to space group P21, with unit-cell parameters a = 87.8, b = 85.7, c = 150.5 Å, β = 96.2°, and contained four molecules in the asymmetric unit with a solvent content of 48.8%, as estimated from the Matthews coefficient (Matthews, 1968 ▸), whereas crystal form B also belonged to space group P21 but with unit-cell parameters a = 82.1, b = 79.5, c = 87.1 Å, β = 115.4°, with a solvent content of 42.5% and two molecules in the asymmetric unit. Analysis of the self-rotation stereograms confirmed the presence of two dimers in crystal form A and a single dimer in crystal form B (Fig. 1 ▸). The diffraction quality and merging statistics of the data collected from crystal form A were systematically better than those from form B (Table 1 ▸) and were selected for phasing experiments. None of the crystal forms presented any relevant off-origin peak in the Patterson map or twinning, as determined by phenix.xtriage (Afonine et al., 2012 ▸).
Figure 1.
Self-rotation stereograms calculated with MOLREP (Vagin & Teplyakov, 2010 ▸) at χ = 180° for crystal forms A and B. (a) Two peaks are found for crystal form A at θ = 84.0°, φ = 90.4° and θ = 84.9°, φ = −100.5°, indicating the presence of two dimers in the asymmetric unit. (b) The same calculation for crystal form B displays a unique noncrystallographic peak at θ = 79.4°, φ = 90.1°.
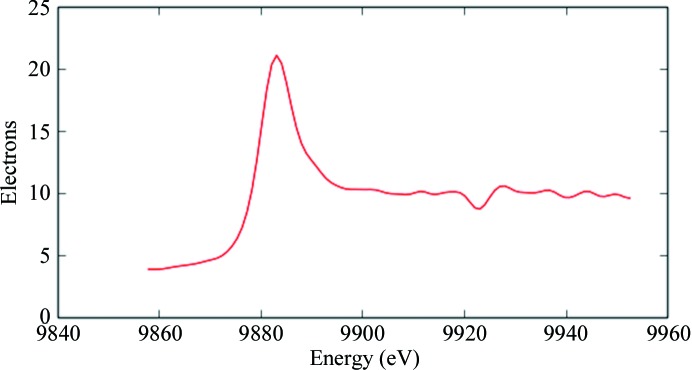
Anomalous dispersion data were collected at the IpR and IpD energies (§2.3; Fig. 2 ▸) to maximize both anomalous and dispersive differences. In both data sets strong anomalous signal was detected up to the maximum resolution of 5.0 Å, where CCanom and the correlation coefficient between anomalous differences fell below 30%, which was further confirmed by calculation of the Harker section of the anomalous difference Patterson map for the IpR data set (Fig. 3 ▸). Data up to 4.5 Å resolution were used in SHELXD to locate the positions of the clusters, treating them as single superatoms. Four sites were located at each attempt, with very high scores (CCall of 67.55 and CCweak of 57.59).
Figure 2.
The fluorescence energy scan recorded from the Ta6Br12-derivatized FUT1 crystal shows an enhanced white line. Inflection-point energies (IpR and IpD) were determined with PyMCA (Solé et al., 2007 ▸).
Figure 3.
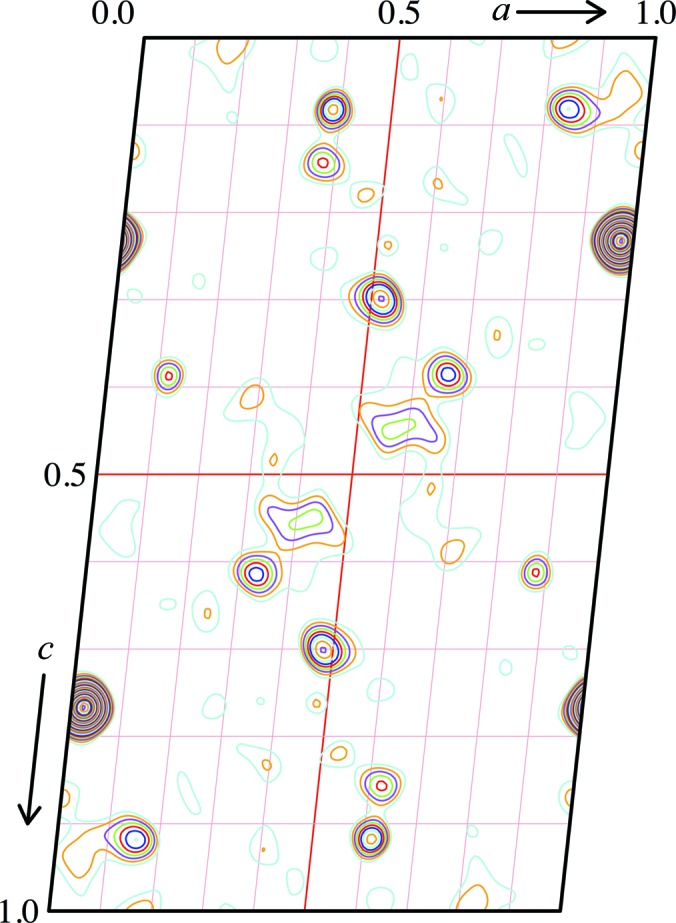
Harker section of the anomalous difference Patterson map calculated with XPREP (Sheldrick, 2001 ▸). Patterson peaks are contoured at 1σ.
3.2. Phasing
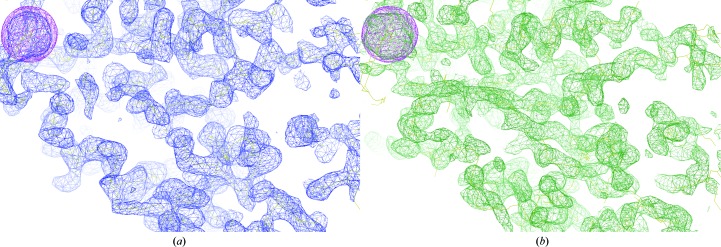
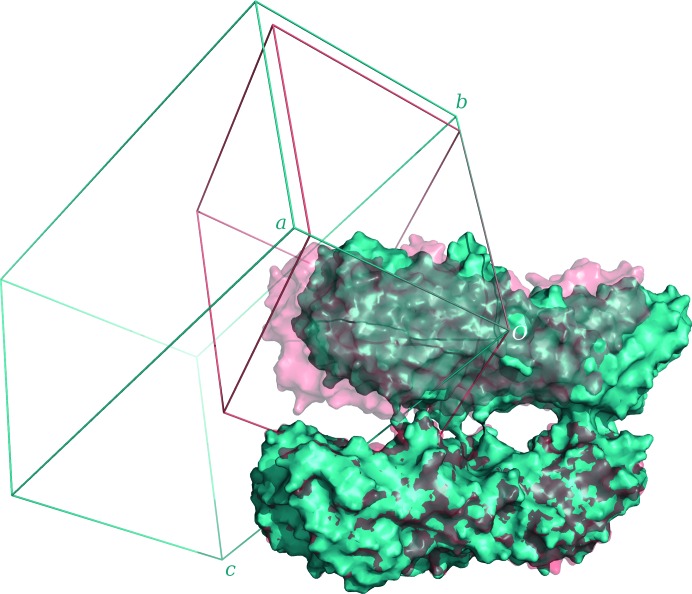
Experimental phases were calculated using a MAD phasing scenario in SHARP, refining heavy-atom coordinates, occupancies and B factors with the SPHCLUSTER option. Anomalous and dispersive scattering factors were derived from the Sasaki table (Sasaki, 1989 ▸) and were refined in the last cycle, where the anomalous phasing power falls below 1 at 5.27 Å resolution. Different combined SHARP/SOLOMON trials were performed, but no clear distinction between hands or interpretable electron-density maps could be obtained. This was achieved when phases were calculated to 4 Å resolution and were further improved with SOLOMON, using a gradually increasing radius from 5 to 4 Å. The inverted hand was identified as correct, with an optimized solvent content of 49.2%. Visual inspection of the electron-density map allowed the identification of clear protein–solvent boundaries and of some secondary-structure elements (Fig. 4 ▸ a). Determination of the noncrystallographic symmetry rotational operator was not possible from a single heavy atom per subunit, therefore phenix.find_ncs_from_density was used to calculate the rotational matrices directly from the density-modified map. The correctness of the position of the molecular centre of mass was validated by comparison with the known substructure. A new run of density modification with NCS averaging was performed with RESOLVE, using the SHARP-calculated centroid phases and iteratively extending them to the final resolution of 2.9 Å (Fig. 4 ▸ b). The final overall figure of merit was 0.66 and the program built about 50% of the total asymmetric unit content as polyalanine. The output model was inspected, edited and rebuilt until a single globular domain of about 220 residues, split into 17 chains, was identified and used as a template for molecular replacement against native data sets (Table 1 ▸). Phaser succeeded in placing four molecules with Z-scores of 5.4, 20.7, 16.7 and 15.1 and two molecules with Z-scores of 9.1 and 11.3 in crystal forms A and B, respectively. Comparison of the MR results from the two crystal forms revealed similar molecular packing but a different lattice (Fig. 5 ▸). The calculated rotation matrix between the two dimers in form A is (−1 0 0; 0 1 −0.22; 0 −0.22 −1), which closely resembles the P2s symmetry operator (−1 0 0; 0 1 0; 0 0 −1), suggesting that crystal form B may be obtained upon rearrangement of the crystal lattice. Model completion and iterative structure refinement of both forms are now under way.
Figure 4.
Comparison of the experimental electron-density maps from SOLOMON (a) and RESOLVE (b) contoured at 1σ. The SOLOMON solvent-flattened electron-density map was calculated at 4 Å resolution and allowed the identification of clear protein and solvent boundaries. Secondary-structure elements are readily interpretable in the 2.9 Å resolution RESOLVE solvent-flattened and NCS-averaged map. The map skeleton is shown (in yellow) to highlight map connectivity in both figures. The anomalous substructure map in magenta (contoured at 3σ) indicates the location of Ta6Br12 clusters.
Figure 5.
Comparison of the molecular packing in crystal forms A (cyan) and B (red and light red) with the corresponding unit cells. The packing is similar in both and the orientations of the a and b unit-cell axes are conserved, while the β angle changes from 96° (A) to 115° (B) and the c axis is shorter, resulting in a different monoclinic lattice.
Acknowledgments
This work was supported by CNRS and Université Grenoble Alpes (UGA). FC received a PhD fellowship from UGA. Access to the ESRF Structural Biology beamlines is gratefully acknowledged.
References
- Adams, P. D. et al. (2010). Acta Cryst. D66, 213–221.
- Afonine, P. V., Grosse-Kunstleve, R. W., Echols, N., Headd, J. J., Moriarty, N. W., Mustyakimov, M., Terwilliger, T. C., Urzhumtsev, A., Zwart, P. H. & Adams, P. D. (2012). Acta Cryst. D68, 352–367. [DOI] [PMC free article] [PubMed]
- Burton, R. A. & Fincher, G. B. (2014). Curr. Opin. Biotechnol. 26, 79–84. [DOI] [PubMed]
- Cavalier, D. M. & Keegstra, K. (2006). J. Biol. Chem. 281, 34197–34207. [DOI] [PubMed]
- Chou, Y.-H., Pogorelko, G., Young, Z. T. & Zabotina, O. A. (2015). Plant Cell Physiol. 56, 255–267. [DOI] [PubMed]
- Cocuron, J.-C., Lerouxel, O., Drakakaki, G., Alonso, A. P., Liepman, A. H., Keegstra, K., Raikhel, N. & Wilkerson, C. G. (2007). Proc. Natl Acad. Sci. USA, 104, 8550–8555. [DOI] [PMC free article] [PubMed]
- Dumont, M., Lehner, A., Bardor, M., Burel, C., Vauzeilles, B., Lerouxel, O., Anderson, C. T., Mollet, J.-C. & Lerouge, P. (2015). Plant J. 84, 1137–1151. [DOI] [PubMed]
- Emsley, P., Lohkamp, B., Scott, W. G. & Cowtan, K. (2010). Acta Cryst. D66, 486–501. [DOI] [PMC free article] [PubMed]
- Evans, P. R. (2011). Acta Cryst. D67, 282–292. [DOI] [PMC free article] [PubMed]
- Evans, P. R. & Murshudov, G. N. (2013). Acta Cryst. D69, 1204–1214. [DOI] [PMC free article] [PubMed]
- Kabsch, W. (2010). Acta Cryst. D66, 125–132. [DOI] [PMC free article] [PubMed]
- La Fortelle, E. de & Bricogne, G. (1997). Methods Enzymol. 276, 472–494. [DOI] [PubMed]
- Matthews, B. W. (1968). J. Mol. Biol. 33, 491–497. [DOI] [PubMed]
- McCoy, A. J., Grosse-Kunstleve, R. W., Adams, P. D., Winn, M. D., Storoni, L. C. & Read, R. J. (2007). J. Appl. Cryst. 40, 658–674. [DOI] [PMC free article] [PubMed]
- Oikawa, A., Lund, C. H., Sakuragi, Y. & Scheller, H. V. (2013). Trends Plant Sci. 18, 49–58. [DOI] [PubMed]
- Park, Y. B. & Cosgrove, D. J. (2015). Plant Cell Physiol. 56, 180–194. [DOI] [PubMed]
- Perrin, R. M., DeRocher, A. E., Bar-Peled, M., Zeng, W., Norambuena, L., Orellana, A., Raikhel, N. V. & Keegstra, K. (1999). Science, 284, 1976–1979. [DOI] [PubMed]
- Sanctis, D. de et al. (2012). J. Synchrotron Rad. 19, 455–461.
- Sasaki, S. (1989). KEK Report 88-14. Ibaraki: National Laboratory for High Energy Physics.
- Sheldrick, G. M. (2001). XPREP. Bruker AXS Inc., Madison, Wisconsin, USA.
- Sheldrick, G. M. (2008). Acta Cryst. A64, 112–122. [DOI] [PubMed]
- Solé, V. A., Papillon, E., Cotte, M., Walter, P. & Susini, J. (2007). At. Spectrosc. 62, 63–68.
- Terwilliger, T. C. (2000). Acta Cryst. D56, 965–972. [DOI] [PMC free article] [PubMed]
- Vagin, A. & Teplyakov, A. (2010). Acta Cryst. D66, 22–25. [DOI] [PubMed]
- Vanzin, G. F., Madson, M., Carpita, N. C., Raikhel, N. V., Keegstra, K. & Reiter, W.-D. (2002). Proc. Natl Acad. Sci. USA, 99, 3340–3345. [DOI] [PMC free article] [PubMed]
- Zabotina, O. A. (2012). Front. Plant Sci. 3, 134. [DOI] [PMC free article] [PubMed]


