

Abstract
Key points
Skeletal muscle capillary density and vasoreactivity are reduced in obesity, due to reduced nitric oxide bioavailability.
Sprint interval training (SIT) has been proposed as a time efficient alternative to moderate‐intensity continuous training (MICT), but its effect on the skeletal muscle microvasculature has not been studied in obese individuals.
We observed that SIT and MICT led to equal increases in capillarisation and endothelial eNOS content, while reducing endothelial NOX2 content in microvessels of young obese men.
We conclude that SIT is equally effective at improving skeletal muscle capillarisation and endothelial enzyme balance, while being a time efficient alternative to traditional MICT.
Abstract
Sprint interval training (SIT) has been proposed as a time efficient alternative to moderate‐intensity continuous training (MICT), leading to similar improvements in skeletal muscle capillary density and microvascular function in young healthy humans. In this study we made the first comparisons of the muscle microvascular response to SIT and MICT in an obese population. Sixteen young obese men (age 25 ± 1 years, BMI 34.8 ± 0.9 kg m−2) were randomly assigned to 4 weeks of MICT (40–60 min cycling at ∼65% 5 times per week) or constant load SIT (4–7 constant workload intervals of 200% W max 3 times per week). Muscle biopsies were taken before and after training from the m. vastus lateralis to measure muscle microvascular endothelial eNOS content, eNOS serine1177 phosphorylation, NOX2 content and capillarisation using quantitative immunofluorescence microscopy. Maximal aerobic capacity (), whole body insulin sensitivity and arterial stiffness were also assessed. SIT and MICT increased skeletal muscle microvascular eNOS content and eNOS ser1177 phosphorylation in terminal arterioles and capillaries (P < 0.05), but the latter effect was eliminated when normalised to eNOS content (P = 0.217). SIT and MICT also reduced microvascular endothelial NOX2 content (P < 0.05) and both increased capillary density and capillary–fibre perimeter exchange index (P < 0.05). In parallel, SIT and MICT increased (P < 0.05) and whole body insulin sensitivity (P < 0.05), and reduced central artery stiffness (P < 0.05). As no significant differences were observed between SIT and MICT it is concluded that SIT is a time efficient alternative to MICT to improve aerobic capacity, insulin sensitivity and muscle capillarisation and endothelial eNOS/NAD(P)Hoxidase protein ratio in young obese men.
Key points
Skeletal muscle capillary density and vasoreactivity are reduced in obesity, due to reduced nitric oxide bioavailability.
Sprint interval training (SIT) has been proposed as a time efficient alternative to moderate‐intensity continuous training (MICT), but its effect on the skeletal muscle microvasculature has not been studied in obese individuals.
We observed that SIT and MICT led to equal increases in capillarisation and endothelial eNOS content, while reducing endothelial NOX2 content in microvessels of young obese men.
We conclude that SIT is equally effective at improving skeletal muscle capillarisation and endothelial enzyme balance, while being a time efficient alternative to traditional MICT.
Abbreviations
- AIx
augmentation index
- AIx@75bpm
augmentation index normalised to 75 beats min–1
- AUC
area under the curve
- BMI
body mass index
- CC
capillary contacts
- CD
capillary density
- C/FI
capillary‐to‐fibre ratio on an individual‐fibre basis
- CFPE
capillary–fibre perimeter exchange index
- cPWV
central pulse wave velocity
- DXA
dual‐energy X‐ray absorptiometry
- FA
fibre cross‐sectional area
- HIT
high intensity interval training
- Kf
filtration capacity
- MICT
moderate‐intensity continuous training
- NAD(P)Hox
NAD(P)Hoxidase
- NO
nitric oxide
- NOX2
subunit of the NAD(P)Hox complex
- O2−
superoxide anion
- OGTT
oral glucose tolerance test
peak oxygen consumption
- pPWV
peripheral pulse wave velocity
- PWV
pulse wave velocity
- SIT
sprint interval training
- SMA
smooth muscle actin
- ser1177
serine1177 (main phosphorylation site of eNOS)
- UEA‐I FITC
Ulex europaeus‐FITC conjugated
- VEGF
vascular endothelial growth factor
- WGA‐350
wheat germ agglutinin‐350
- Wmax
maximal power output on incremental exercise test
Introduction
Obesity has become a global epidemic with 200 million men and 300 million women over 20 years of age classified as obese worldwide (Kelly et al. 2008; WHO 2009; body mass index (BMI)>30 kg m−2). The rapid increase in obesity is regarded as instrumental in the increased prevalence of cardiovascular and metabolic disease seen worldwide (WHO, 2009). Therefore, the obesity epidemic is regarded as a major economic, social and health burden.
A growing body of literature suggests that reductions in muscle capillary density (Gavin et al. 2005) and impairments in the vasodilatory responsiveness of the muscle microvasculature to physiological stimuli (insulin, increased blood shear stress during physical activity and increases in interstitial VEGF after exercise) are instrumental to the development of functional impairments, and in the longer term chronic disease in obesity (Clerk et al. 2006; Wagenmakers et al. 2006; de Jongh et al. 2008; Bakker et al. 2009; Barrett et al. 2009, 2011; Doupis et al. 2011; Hoier & Hellsten, 2014). It is well established that skeletal muscle microvascular nitric oxide (NO) bioavailability plays a key role in many of these processes (McAllister & Laughlin, 2006; Frisbee, 2007). NO bioavailability is determined by the balance between NO production and scavenging of NO by superoxide anions (O2 −) and related reactive oxygen species. Experiments in isolated arteries and cultured endothelial cells have shown that the rate limiting enzyme for endothelial NO synthesis is endothelial nitric oxide synthase (eNOS). The protein content and serine1177 phosphorylation state together determine total eNOS activity and endothelial NO production (Mount et al. 2007). A major source of superoxide anion production and NO scavenging in the vascular wall is NAD(P)Hoxidase (NAD(P)Hox; Brandes & Kreuzer, 2005; Silver et al. 2007), and substantial expression of this enzyme is reported to occur in obesity (Brandes & Kreuzer, 2005; Silver et al. 2007).
Strong evidence exists that moderate‐intensity continuous training (MICT) delays or prevents the onset of obesity related chronic diseases (Barrett & Liu, 2013). However, the majority of the adult population does not meet the current recommendations to perform a minimum of 150 minutes of moderate intensity endurance exercise per week. (Haskell et al. 2007). ‘Lack of time' is cited as the major reason for the widespread failure to adhere to this exercise recommendation (Trost et al. 2002). In a recent study, Cocks et al. (2013) showed that 6 weeks of sprint interval training (SIT) was more effective in increasing muscle microvascular eNOS content and equally effective at increasing microvascular density compared to traditional MICT in young sedentary males, despite the maximum weekly time commitment of SIT being 1.5 h compared to 5 h in the MICT group. However, at present there is no information on whether SIT might represent a time efficient alternative to improve microvascular enzyme expression and capillary density in obese individuals, and whether this leads to parallel metabolic and functional adaptations.
Many previous studies (Burgomaster et al. 2008; Rakobowchuk et al. 2008; Cocks et al. 2013) investigating SIT have used ‘all out’ cycling, in the form of repeated 30 s Wingate tests. However, this method of training is very demanding, requires high levels of motivation and specialised cycle ergometers, and is therefore not a practical method of training for the majority of the obese population. These criticisms have led to the development of high intensity interval training (HIT) protocols which use constant loads (Little et al. 2011). Constant load HIT protocols differ from ‘all out’ SIT as the workload completed throughout each interval and between intervals is the same, unlike ‘all out’ SIT where the workload will vary within each interval and between intervals depending on the gradual development of fatigue. As such, in the present study we developed a SIT protocol designed to maintain the anaerobic nature of ‘all out’ SIT whilst utilising the benefits of constant workload HIT. Although not SIT in the traditional sense (‘all out’ exercise) we have decided to call the developed protocol constant workload SIT, following the guidelines suggested by Weston et al. (2013) that interval training at an intensity above 100% should be referred to as SIT.
The main aims of the current study were twofold. First, we sought to determine the effects of 4 weeks constant workload SIT and MICT on skeletal muscle microvascular density and microvascular filtration capacity in previously sedentary obese young men. Secondly, we aimed to investigate the effects of constant workload SIT and MICT on skeletal muscle microvascular enzymes responsible for NO bioavailability (eNOS content and ser1177 phosphorylation and NOX2 content (NAD(P)Hox subunit)). We employed quantitative immunofluorescence microscopy, a recently developed technique to assess protein content and phosphorylation of the indicated enzymes specifically within the endothelial layer of the skeletal muscle microvasculature. Finally, the effects of constant workload SIT and MICT on arterial stiffness and blood pressure were investigated. We hypothesised that microvascular density would increase in response to both modes of training, and that eNOS protein content would be increased and NOX2 protein content would be reduced in the endothelial cell layer of terminal arterioles and capillaries of skeletal muscle.
Methods
Participants and ethical approval
Sixteen young sedentary obese men, with a BMI ≥ 30 kg m−2 and currently participating in less than 1 h structured physical activity per week, completed the study (Table 1). Participants were randomly assigned to either SIT or MICT groups, in a matched fashion based on age, BMI and (n = 8). Participants were free of diagnosed cardiovascular and metabolic disease and other contraindications to participating in exercise training interventions, ascertained through a medical screening process. Two participants had impaired fasting glucose (fasting plasma glucose ≥ 6.1 mmol l−1; n = 1 SIT, n = 1 MICT), and four participants had a combination of impaired fasting glucose and impaired glucose tolerance (2 h oral glucose tolerance glucose value between 7.8 and 11.1 mmol l−1; n = 2 SIT, n = 2 MICT). All participants gave written informed consent to a protocol adhering to the Declaration of Helsinki and approved by the Black Country NHS Research Ethics Committee.
Table 1.
Subject characteristics, insulin sensitivity, haemodynamic and peak oxygen uptake pre‐ and post 4 weeks of training
| MICT | Sprint interval | |||
|---|---|---|---|---|
| Variable | Pre‐training | Post‐training | Pre‐training | Post‐training |
| Age (years) | 26 ± 2 | — | 24 ± 2 | — |
| Height (cm) | 1.84 ± 0.03 | — | 1.75 ± 0.03 | — |
| Weight (kg) | 113 ± 6 | 111 ± 6 | 110 ± 5 | 109 ± 5 |
| BMI (kg m−2) | 33.7 ± 1.5 | 33.1 ± 1.6 | 35.8 ± 0.8 | 35.7 ± 0.8 |
| Body fat (%) | 30.9 ± 1.8 | 29.6 ± 1.7# | 32.2 ± 2.1 | 31.8 ± 2.3 |
| (ml kg−1 min−1) | 35.1 ± 1.5 | 39.8 ± 2.7* | 33.9 ± 1.2 | 36.3 ± 1.6* |
| W max (W) | 249 ± 16 | 276 ± 16* | 214 ± 14 | 245 ± 15* |
| ISI Matsuda | 1.7 ± 0.1 | 2.1 ± 0.2* | 1.8 ± 0.1 | 2.0 ± 0.2* |
| Glucose AUC (mmol l−1 (120 min)−1) | 998 ± 70 | 880 ± 63* | 971 ± 49 | 915 ± 46* |
| Insulin AUC (mmol l−1 (120 min)−1) | 16559 ± 804 | 13597 ± 1339* | 14492 ± 1140 | 12607 ± 1264* |
| Resting heart rate (beats min−1) | 60 ± 2 | 53 ± 2* | 65 ± 3 | 60 ± 2* |
| Mean arterial pressure (mmHg) | 87 ± 3 | 84 ± 4 | 85 ± 1 | 85 ± 2 |
| Systolic blood pressure (mmHg) | 127 ± 3 | 121 ± 5 | 126 ± 3 | 125 ± 5 |
| Diastolic blood pressure (mmHg) | 67 ± 3 | 65 ± 3 | 64 ± 2 | 65 ± 2 |
Values are means ± SEM, n = 8 per group. *P < 0.05, main effect of training. # P < 0.05 from pre‐training.
Pre‐training testing protocol
Participants first completed an incremental exercise test to exhaustion on an electromagnetically braked cycle ergometer to determine maximal aerobic power (Wattmax (W max)) and (Cocks et al. 2013). Following sufficient rest participants in the SIT group were familiarised to the SIT protocol by performing two SIT repetitions.
Three to 7 days after the incremental exercise test participants attended the laboratory for the pre‐training testing protocol. Following a 24 h standardised diet (Cocks et al. 2013) and after an overnight fast, vascular function was assessed (blood pressure, arterial stiffness and microvascular filtration capacity), this was followed by a resting muscle biopsy, oral glucose tolerance test (OGTT) and finally body composition assessment using dual‐energy X‐ray absorptiometry (DXA, Hologic Discovery W with Hologic QDR software for windows XP version 12.4.2).
Post‐training procedures
The post‐training testing was performed the day before the final training session. A minimum of 48 h after the final training session the post‐training testing protocol was conducted with procedures, methods and timings identical in all respects to the pre‐training testing protocol.
Arterial stiffness
Supine blood pressure was measured using an automated sphygmomanometer (Omron 7051T, Omron Corporation, Kyoto, Japan) following 15 min of supine rest. Systemic wave reflection was then investigated using pulse wave analysis conducted using a semi‐automated device and software (SphygmoCor, AtCor Medical, Sydney, Australia). Using this augmentation index (AIx) was calculated (Cocks et al. 2013). Central (carotid–femoral, cPWV) and peripheral (carotid–radial, pPWV) artery stiffness were investigated by pulse wave velocity, assessed using a semi‐automated device and software (SphygmoCor; Cocks et al. 2013). All measurements were made in triplicate.
Venous occlusion plethysmography
Microvascular filtration capacity (K f) was measured through venous occlusion plethysmography, using the principles described by Gamble et al. (1993) and the methods described by Cocks et al. (2014). However, the method was adapted to use a mercury‐in‐silastic strain gauge and semi‐automated inflation pump (Hokanson, Inc.). Strain gauge and pressure cuff signal were sampled at 1000 Hz and stored for offline assessment of K f.
Muscle biopsy
A resting muscle biopsy was taken from the lateral portion of the m. vastus lateralis using the percutaneous needle biopsy technique under local anaesthetic (1% lidocaine), as recently described (Tarnopolsky et al. 2011). Samples were embedded in Tissue‐Tek OCT Compound (Sakura Finetek Europe, Zoeterwoude, Netherlands) and immediately frozen in liquid nitrogen‐cooled isopentane (Sigma‐Aldrich, Dorset, UK). Samples were then stored at –80°C until analysis.
Oral glucose tolerance test and Matsuda insulin sensitivity index
Following the insertion of a cannula into an antecubital vein, a resting 25 ml blood sample was taken; participants then completed a 2 h oral glucose tolerance test. Area under the curve (AUC) for insulin and glucose during the oral glucose tolerance test and Matsuda insulin sensitivity index were calculated as described by Cocks et al. (2013).
Training
Training was initiated ∼48 h after the pre‐training testing protocol. Training for the MICT group consisted of 40–60 min continuous cycling on an electromagnetically braked cycle ergometer at an intensity eliciting ∼ 65% Participants trained 5 times per week. Following 2 weeks of training a second incremental exercise test was conducted and workload was adjusted accordingly. The duration of the sessions was increased from 40 min during the first 7 sessions, to 50 min for sessions 8–14 and 60 min for sessions 15–20. The SIT group performed a 2 min warm up at 50 W followed by repeated 30 s high intensity cycling bouts at a workload corresponding to 200% W max. High intensity bouts were interspersed with 120 s of cycling at 30 W for recovery. Participants completed 4 intervals for the first 3 sessions; this was increased by 1 repetition every 3 sessions; participants did 12 sessions in total, completing 7 intervals during the final training session.
A workload corresponding to 200% W max was chosen because previous unpublished work from the authors showed that Wingate based SIT elicited a mean power output equivalent to approximately 200% W max, as determined by progressive exercise test to exhaustion. Thus, to closely match the mean workload of Wingate based SIT 200% W max was used.
Quantitative immunofluorescence
NOX2 content in the skeletal muscle microvascular endothelium and sarcolemma was assessed using the previously developed immunofluorescence staining protocol and quantification technique (Cocks et al. 2012, 2013). However, the immunofluorescence staining protocol and quantification technique used for eNOS content and eNOS ser1177 phosphorylation (Cocks et al. 2012) has been adapted to allow for differentiation between skeletal muscle capillaries and terminal arterioles. This adapted technique is described below.
Sections were fixed in acetone and ethanol (3:1). Sections were then incubated with antibodies against either eNOS (Transduction Laboratories, Lexington, KY, USA) or p‐eNOS ser1177 (Cell Signalling Technology, Beverly, MA, USA) in combination with anti‐α smooth muscle actin (SMA; Abcam, Cambridge, UK) as a marker to differentiate between terminal arterioles and capillaries. Sections were then incubated with appropriately labelled secondary antibodies (Invitrogen, Paisley, UK), in combination with Ulex europaeus‐FITC conjugated (UEA‐I‐FITC; Sigma‐Aldrich, UK) as a marker of the endothelium. Coverslips were then applied using a glycerol and Mowiol 4‐88 solution.
Images were acquired with an inverted confocal microscope (Zeiss LSM‐710, Carl Zeiss, Germany) with a ×40 oil immersion objective. FITC fluorescence was excited with a 488 nm line of the argon laser and detected with 493–559 nm emission. Alexa Fluor 546 and 633 fluorophore were excited with 543 nm and 633 nm lines of the helium–neon laser and 548–623 nm and 638–747 nm emission, respectively. Identical settings were used for all image capture within each participant.
Image analysis was performed using Image Pro Plus 5.1 software. Blood vessels were divided into either capillaries or arterioles using the αSMA image. The endothelial (UEA‐I‐FITC) outline was then overlaid onto the corresponding eNOS or p‐eNOS ser1177 image. Fluorescence intensity of the eNOS or p‐eNOS ser1177 signal was quantified within the endothelial specific area. Diameter of the terminal arterioles was also determined on calibrated images using Image Pro Plus 5.1 software (Media Cybernetics Inc, Bethesda, MD, USA), vessels larger than 20 μm in diameter were excluded to remove 3rd and 4th order arterioles (Wu et al. 2011) from the analysis, which rarely appear in muscle cross‐sections.
Capillarisation
Muscle sections were incubated with anti‐myosin type I (developed by Dr Blau DSHB) followed by goat anti‐mouse IgM 594 (Invitrogen) to identify type I muscle fibres. This was performed in combination with UEA‐I‐FITC (Sigma‐Aldrich) and wheat germ agglutinin‐350 (WGA‐350; Invitrogen) as markers of the endothelium and plasma membrane, respectively.
For analysis, slides were viewed using a Nikon E600 microscope using a 40 × 0.75 numerical aperture objective. Images were captured using a SPOT RT KE colour three shot camera (Diagnostic Instruments Inc., MI, USA).
Capillaries were quantified in a fibre type specific manner manually, using the UEA‐I, WGA‐350 and myosin heavy chain images. The following indexes were measured (Hepple et al. 1997): (1) number of capillaries around a fibre (capillary contacts (CC)), (2) capillary‐to‐fibre ratio on an individual‐fibre basis (C/F I), (3) capillary density (CD) and (4) capillary–fibre perimeter exchange (CFPE) index. Fibre cross‐sectional area and perimeter were measured using ImagePro Plus 5.1 software.
Statistics
Capillary contacts, capillary‐to‐fibre ratio on an individual‐fibre basis, capillary–fibre perimeter exchange, fibre cross‐sectional area and perimeter were analysed using a three‐way mixed ANOVA, with the between‐group factor being ‘group’ (SIT versus MICT) and within‐group factors being ‘training status’ (pre‐versus post‐training) and ‘fibre type’ (type I versus type II). eNOS content and eNOS ser1177 phosphorylation in capillaries and arterioles were also analysed using a three‐way mixed ANOVA, with the between‐group factor being ‘group’ (SIT versus MICT) and within‐group factors being ‘training status’ (pre‐ versus post‐training) and ‘vessel type’ (capillary versus terminal arteriole). All other variables were analysed using a two‐way mixed ANOVA, with the between‐group factor being ‘group’ (SIT versus MICT) and repeated factor being ‘training status’ (pre‐ versus post‐training). All analyses were performed using statistical analysis software (SPSS for windows version 16.0 (SPSS, Chicago, IL, USA). Significance was set at P ≤ 0.05. Data are presented as means ± SEM. Due to unsuccessful UEA‐I FITC staining in one participant, eNOS, p‐eNOS ser1177 and NOX2 within the endothelium are presented for 15 participants. The primary aim of the study was to compare the effects of SIT and MICT on muscle microvascular eNOS content and microvascular density. The study was powered to detect between‐group (SIT versus MICT) differences in these variables in response to training. G*Power 3.1 software (G*Power Software Inc., Kiel, Germany) was used to calculate the required sample size. The study was designed to detect a between‐group effect of f = 0.30, representative of a medium‐sized effect (Cohen, 1992), adopting an alpha of 0.05 and power of 0.80. An f of 0.30 was deemed to be a physiologically relevant difference, as the authors have previously observed an effect of this size following 6 weeks of SIT and MICT in sedentary individuals (Cocks et al. 2013).
Results
Training effect
Training increased (MICT 10%, SIT 13%) and W max (MICT 12%, SIT 11%) with a main effect of training (P < 0.05; Table 1), but no difference between groups. BMI was unchanged by training (P = 0.093), however, a main effect of training and a significant interaction between training and group were observed for percentage body fat (P < 0.05). When within‐group differences were examined percentage body fat was reduced only by MICT (MICT P < 0.05, SIT P = 0.235), but there were no significant differences between training modes (pre P = 0.644, post P = 0.453; Table 1). Resting heart rate was reduced following training in both SIT and MICT groups (main effect of training, P < 0.05; Table 1). MICT and SIT did not change mean (P = 0.282), systolic (P = 0.135) and diastolic (P = 0.580) blood pressure (Table 1).
Insulin sensitivity
The Matsuda insulin sensitivity index was significantly increased by MICT (24%) and SIT (11%), with no difference between training modes (main effect of training, P < 0.05; Table 1). Both glucose and insulin AUC were also reduced by training (main effect of training, P < 0.05; Table 1).
eNOS content and phosphorylation
Four weeks of either MICT or SIT significantly increased eNOS content in terminal arterioles (MICT 7%, SIT 10%) and capillaries (MICT 8%, SIT 19%), resulting in a significant main effect of training on skeletal muscle microvascular eNOS content (P < 0.05; Fig. 1). eNOS content was significantly higher in terminal arterioles than capillaries in both groups pre‐ and post‐training (main effect of vessel type, P < 0.05). eNOS ser1177 phosphorylation, measured in the basal state, was increased by both MICT and SIT in arterioles (MICT 9%, SIT 6%) and capillaries (MICT 6%, SIT 7%), resulting in a significant main effect of training on eNOS ser1177 phosphorylation (P < 0.05; Fig. 2). Skeletal muscle eNOS ser1177 phosphorylation was significantly higher in terminal arterioles than capillaries in both groups pre‐ and post‐training (main effect of vessel type, P < 0.05). However, when eNOS ser1177 phosphorylation was normalised to eNOS content both the effect of training and vessel type were no longer apparent (training effect P = 0.217, vessel type P = 0.269; Fig. 2). Mean diameter of the arterioles assessed for eNOS and eNOS ser1177 phosphorylation pre‐ and post‐training was 9.8 ± 0.2 μm, consistent with the interpretation that only terminal or 5th order arterioles were analysed (Wu et al. 2011).
Figure 1.
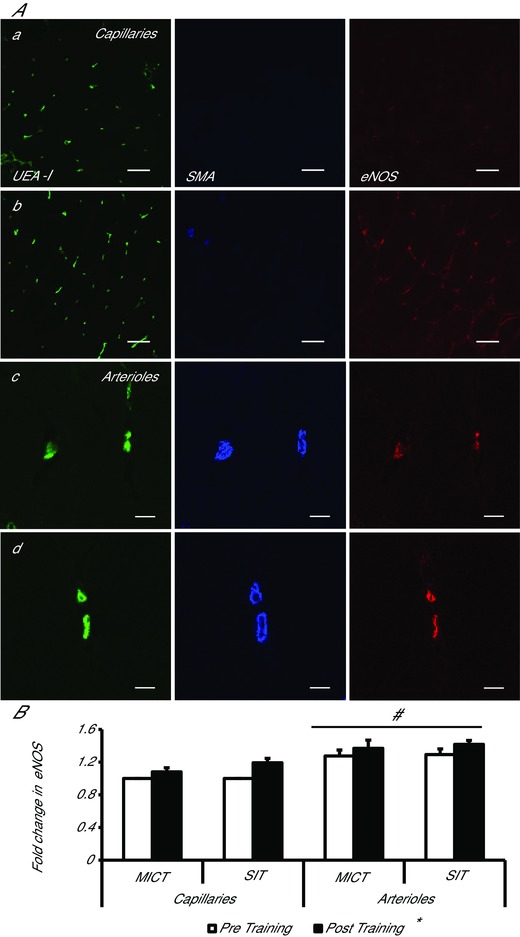
Effects of moderate‐intensity continuous training (MICT), and sprint interval training (SIT) on eNOS content in capillaries and terminal arterioles
A, representative confocal microscopy images of skeletal muscle from pre‐ (a, c) and post‐training (b, d), in capillaries (a, b) and arterioles (c, d). The skeletal muscle microvascular endothelium was revealed using Ulex europaeus‐FITC conjugated lectin (green). Arterioles and capillaries were differentiated using anti‐α smooth muscle actin in combination with Alexa Fluor 633 conjugated secondary antibody (blue). Skeletal muscle eNOS expression was revealed using Alexa Fluor 546 conjugated secondary antibody (red). Bar represents 50 μm in a and b and 10 μm in c and d. B, mean fluorescence intensity of eNOS is summarised. The mean level of eNOS in capillaries pre‐training was assigned a value of 1, and the relative intensity of eNOS post‐training was calculated (MICT n = 7, HIT n = 8). *P < 0.05, main effect of training. # P < 0.05, main effect of vessel type.
Figure 2.
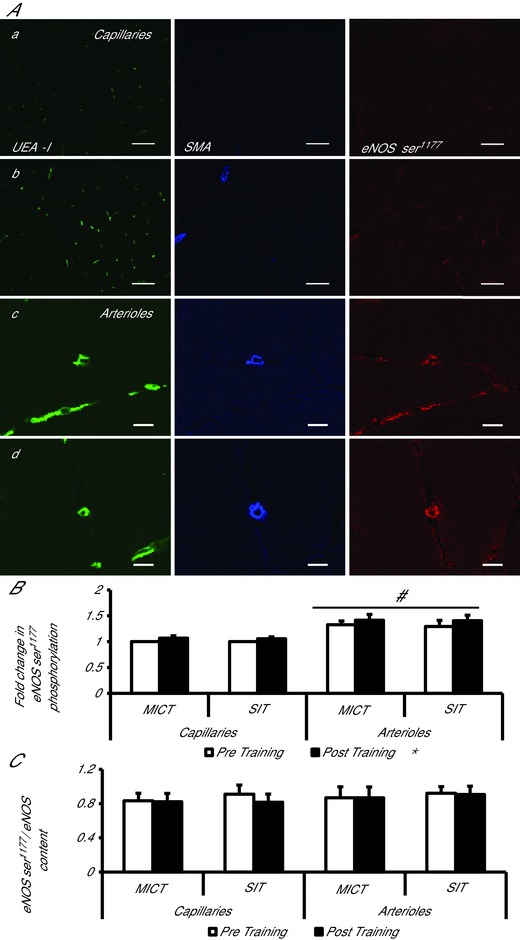
Effects of moderate‐intensity continuous training (MICT), and sprint interval training (SIT) on eNOS serine1177 phosphorylation in capillaries and terminal arterioles
A, representative confocal microscopy images of skeletal muscle from pre‐ (a, c) and post‐training (b, d), in capillaries (a, b) and arterioles (c, d). The skeletal muscle microvascular endothelium was revealed using Ulex europaeus‐FITC conjugated lectin (green). Arterioles and capillaries were differentiated using anti smooth muscle actin in combination with Alexa Fluor 633 conjugated secondary antibody (blue). Skeletal muscle eNOS ser1177 phosphorylation was revealed using Alexa Fluor 546 conjugated secondary antibody (red). Bar represents 50 μm in a and b and 10 μm in c and d. B, mean fluorescence intensity of eNOS ser1177 is summarised (MICT n = 7, HIT n = 8). The mean level of eNOS ser1177 pre‐training was assigned a value of 1, and the relative intensity of eNOS ser1177 post‐training was calculated. C, eNOS ser1177phosphorylation normalised to eNOS content (eNOS content/eNOS ser1177 phosphorylation) (MICT n = 7, HIT n = 8). *P < 0.05, main effect of training. # P < 0.05, main effect of vessel type.
NOX2
Skeletal muscle mixed microvascular (capillaries and terminal arterioles and collecting venules) endothelial NOX2 content was significantly reduced by MICT (13%) and SIT (16%), with no difference between training modes (main effect of training P < 0.05; Fig. 3). However, sarcolemma‐associated NOX2 expression was unaltered by training, with no difference between groups (P = 0.517; Fig. 3).
Figure 3.
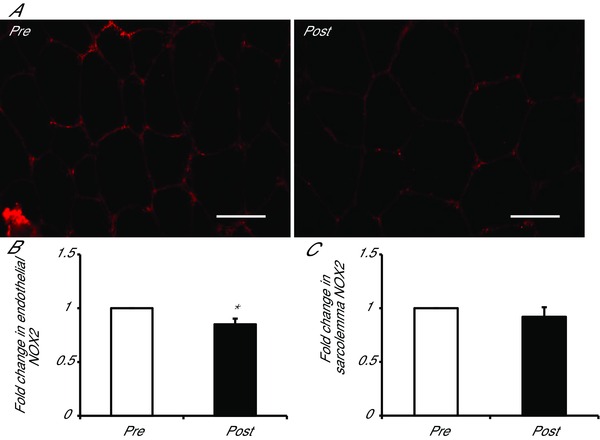
Effects of moderate‐intensity continuous training (MICT), and sprint interval training (SIT) on NOX2 content
A, representative widefield microscopy images of skeletal muscle pre‐ (left) and post‐training (right). Skeletal muscle NOX2 content was revealed using Alexa Fluor 594 conjugated secondary antibody (red). Bar = 50 μm. B, mean fluorescence intensity of NOX2 within the endothelium is summarised (MICT n = 7, HIT n = 8). C, mean fluorescence intensity of NOX2 within the sarcolemma is summarised (MICT n = 7, HIT n = 8). The mean level of NOX2 pre‐training was assigned a value of 1, and the relative intensity of NOX2 post‐training was calculated.
Microvascular filtration capacity and capillarisation
Training increased microvascular K f (SIT pre 3.36 ± 0.46 ml min−1 (100 ml)−1 × mmHg−1 × 10⁻³ versus post 3.89 ± 0.32 ml min−1 100 ml−1 x mmHg−1 × 10⁻³, MICT pre 4.66 ± 0.56 ml min−1 (100 ml)−1 mmHg−1× 10⁻³ versus post 5.94 ± 0.90 ml min−1 (100 ml)−1 mmHg−1 × 10⁻³), with a main effect of training (P < 0.05), but no difference between groups.
Type II fibres had a significantly larger fibre perimeter and fibre cross‐sectional area than type I fibres (perimeter, main effect of fibre type P < 0.05, FA, main effect of fibre type P < 0.05), but neither perimeter nor FA was affected by training (perimeter P = 0.8, FA P = 0.968). Capillary density was increased 19% in the MICT group and 6% in the SIT group, with no difference between groups (main effect of training, P < 0.05). Capillary–fibre perimeter exchange index, capillary contacts and capillary‐to‐fibre ratio were all higher in type I fibres than type II fibres irrespective of training status (main effect of fibre type P < 0.05). Capillary–fibre perimeter exchange index was increased by both MICT and SIT by 12% and 10%, respectively, with no difference between groups or within fibre types (main effect of training, P < 0.05). Capillary contacts increased by 8% and 16% in the MICT and SIT groups, respectively, with no difference between groups or within fibre types (main effect of training, P < 0.05). Capillary–fibre perimeter exchange index was unchanged by training (P = 0.099). Data are presented in Table 2 and a representative image is presented in Fig. 4.
Table 2.
Capillarisation pre‐ and post‐training
| MICT | Sprint interval | |||
|---|---|---|---|---|
| Variable | Pre‐training | Post‐training | Pre‐training | Post‐training |
| Overall FA (mm2) | 4626 ± 325 | 4074 ± 271 | 3806 ± 283 | 4487 ± 497 |
| Type I FA (mm2) | 4296 ± 368 | 2822 ± 323 | 3551 ± 288 | 4294 ± 449 |
| Type II FA (mm2) | 4968 ± 332 | 4313 ± 295 | 4081 ± 358 | 4852 ± 737 |
| Overall perimeter (mm2) | 281.1 ± 10.2 | 267.7 ± 9.2 | 265.8 ± 17.1 | 276.0 ± 13.6 |
| Type I perimeter (mm2) | 269.0 ± 12.0 | 258.6 ± 10.3 | 245.6 ± 10.5 | 269.1 ± 13.5 |
| Type II perimeter (mm2) | 292.7 ± 9.7 | 276.9 ± 10.7 | 287.0 ± 29.3 | 287.3 ± 18.3 |
| Overall CC | 4.39 ± 0.31 | 4.74 ± 0.38* | 4.84 ± 0.40 | 5.62 ± 0.21* |
| Type I CC | 4.61 ± 0.34 | 4.91 ± 0.36* | 5.07 ± 0.48 | 5.87 ± 0.24* |
| Type II CC | 4.20 ± 0.25 | 4.70 ± 0.43* | 4.72 ± 0.37 | 5.43 ± 0.20* |
| Overall C/F I | 1.69 ± 0.13 | 1.80 ± 0.15 | 1.84 ± 0.18 | 2.15 ± 0.09 |
| Type I C/F I | 1.81 ± 0.14 | 1.90 ± 0.14 | 1.98 ± 0.22 | 2.26 ± 0.11 |
| Type II C/F I | 1.58 ± 0.11 | 1.76 ± 0.17 | 1.80 ± 0.17 | 2.07 ± 0.09 |
| Overall CFPE | 5.97 ± 0.27 | 6.68 ± 0.36* | 7.20 ± 0.58 | 7.93 ± 0.36* |
| Type I CFPE | 6.69 ± 0.23 | 7.31 ± 0.25* | 7.79 ± 0.66 | 8.54 ± 0.38* |
| Type II CFPE | 5.33 ± 0.26 | 6.22 ± 0.45* | 6.81 ± 0.56 | 7.30 ± 0.34* |
| CD (caps mm–2) | 636.1 ± 25.1 | 756.5 ± 32.5* | 813.3 ± 62.7 | 859.3 ± 52.9* |
Values are means ± SEM *P < 0.05, main effect of training. FA, fibre cross‐sectional area, CD, capillary density, CC, capillary contacts, C/F I, capillary‐to‐fibre ratio on an individual‐fibre basis, CFPE, capillary–fibre perimeter exchange.
Figure 4.
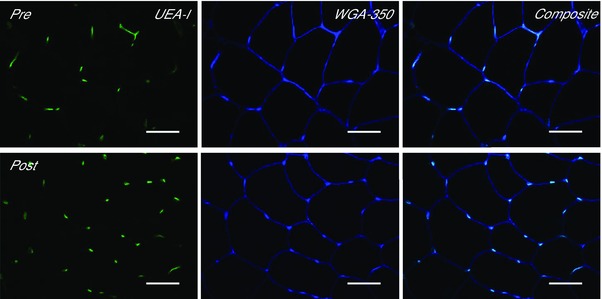
Effect of training on skeletal muscle capillarisation
Representative widefield microscopy images of skeletal muscle pre‐ (left) and post‐training (right). Skeletal muscle capillarisation was revealed using Ulex europaeus‐FITC conjugated lectin (UEA‐I, green), the skeletal muscle membrane was revealed using wheat germ agglutinin‐350 (WGA‐350, blue). Fibre type was revealed using anti‐myosin type I (image not shown). Composite image shows a combination of the UEA‐I and WGA‐350 images. Bar = 50 μm.
Arterial stiffness
AIx@75bpm was significantly decreased following training, with no difference observed between training methods (main effect of training, P < 0.05; Fig. 5 A). cPWV was decreased following MICT and SIT (main effect of training, P < 0.05; Fig. 5 B). Although pPWV was not significantly altered following either training mode, there was a trend towards a reduction (P = 0.064; Fig. 5 C).
Figure 5.
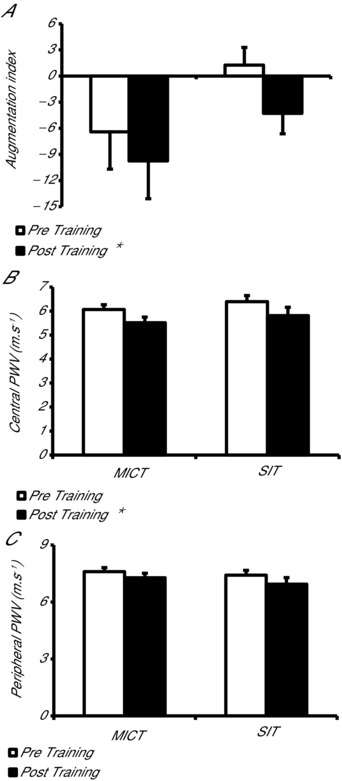
Effect of moderate‐intensity continuous training (MICT) and sprint interval training (SIT) on systemic wave reflections and central and peripheral artery stiffness
A, systemic wave reflections measured using augmentation index normalised to 75 beats min−1 (AIx@75bpm) following MICT and SIT. B, central artery (aortic) stiffness measured using pulse wave velocity (PWV) following MICT and HIT. C, peripheral artery (brachial artery) stiffness measured using pulse wave velocity following MICT and SIT. *P < 0.05, main effect of training.
Discussion
The most important novel findings of the present study are that 4 weeks of constant workload SIT and traditional MICT in young previously sedentary obese males: (1) increased skeletal muscle capillarisation and microvascular K f, a measure of the capillary surface area available for transendothelial transport of insulin and glucose, to a similar extent, (2) increased the endothelial eNOS content both in terminal arterioles and capillaries of skeletal muscle, (3) did not affect eNOS ser1177 phosphorylation when normalised to the increase in eNOS content, and (4) similarly reduced the endothelial NOX2 content in a mixed analysis of capillaries and terminal arterioles. Importantly these microvascular adaptations were paralleled by improvements in maximum aerobic capacity and whole body insulin sensitivity. Finally, our results also show that constant workload SIT and MICT are effective interventions to reduce arterial stiffness in an obese population. These results suggest that constant workload SIT is a tolerable, effective and time efficient training mode for changing many of the measured variables in a direction consistent with health benefits in young obese males.
Time efficient training stimulus
Our group and others have shown that ‘all out’ SIT based on repeated Wingate tests is an effective means of improving a number of variables related to health, including aerobic capacity and insulin sensitivity, in previously sedentary lean individuals (Burgomaster et al. 2008; Babraj et al. 2009; Cocks et al. 2013). However, such ‘all out sprint’ protocols have been criticised for the demanding nature and high levels of motivation required to complete the interventions. In addition, the specialised equipment required to perform Wingate tests prevents ‘all out’ SIT from being implemented in community interventions (Gibala & McGee, 2008). These criticisms have led to the suggestion that SIT may not be a suitable method of training in obese individuals and other groups with exercise limitations, such as the elderly and individuals with metabolic syndrome, type 2 diabetes and cardiovascular disease (Coyle, 2005). We therefore developed an alternative SIT protocol, which would maintain the anaerobic nature of ‘all out’ SIT, but would be within the physical abilities of the obese volunteers participating in our study. All the obese volunteers were able to complete the 4 week ‘constant workload' protocol and increase the number of repeated bouts from 4 in week 1 to 7 in week 4. The current study has shown that 4 weeks of this new ‘constant workload' SIT protocol was as effective at increasing as traditional MICT in this young previously sedentary obese group. Constant workload SIT also induced similar improvements in in the present study to those observed following 6 weeks ‘all out’ SIT in lean sedentary individuals (9% current study versus 8% lean sedentary; Cocks et al. 2013). As aerobic capacity has been shown to be a more powerful predictor of mortality than established clinical risk factors such as hypertension and type II diabetes (Myers et al. 2002), the improvement in following constant load SIT and MICT may have long‐term health benefits if maintained over the lifespan. Constant workload SIT was also as effective as MICT at increasing insulin sensitivity in the obese group studied. As insulin resistance in obesity is strongly associated with the development of type II diabetes (Guilherme et al. 2008), the improvement in insulin sensitivity may ultimately result in reduced progression to type II diabetes.
Skeletal muscle endothelial enzymes regulating NO bioavailability
The technique used in the current study to investigate eNOS content and ser1177 phosphorylation is modified from the previous technique outlined by Cocks et al. (2012). The novelty of the modification is that it allows differentiation between arterioles and capillaries. Mean arteriole diameter was 9.8 ± 0.2 μm, suggesting that the data we report primarily concerns terminal arterioles (TA; also named 5th order arterioles; Frisbee et al. 2011), representing a significant improvement on the previously described method (Cocks et al. 2012). Terminal arterioles have been reported to control the recruitment of microvascular units (one terminal arteriole supplying blood to groups of approximately 20 capillaries) and therefore the perfusion of skeletal muscle capillaries (Delashaw & Duling, 1988; Segal & Bearden, 2012). Therefore, knowledge of the eNOS protein content and eNOS ser1177 phosphorylation specifically in the endothelial cell layer of terminal arterioles in skeletal muscle will help to provide mechanistic information on the control of capillary perfusion in response to exercise, insulin and VEGF, and on the blunting of these signals in sedentary and obese individuals and patients with insulin resistance, metabolic syndrome, type II diabetes and cardiovascular disease. As a result of this technical advance it was possible to observe a higher eNOS content in the endothelium of skeletal muscle arterioles compared to capillaries. This finding is consistent with previous work conducted in the coronary microcirculation of pigs where eNOS content was also higher in arterioles than capillaries (Laughlin et al. 2003).
The finding of an increased eNOS content following SIT and MICT in both terminal arterioles and capillaries is novel. However, it is in agreement with previous work from our laboratory in young sedentary males in which a mixture of skeletal muscle microvessels (arterioles, capillaries and venules) were analysed. The eNOS content in that study was increased following 6 weeks of both SIT and MICT (Cocks et al. 2013). Unlike the previous study, where a significantly larger increase in eNOS content occurred following SIT (36%) than MICT (16%), eNOS content was increased to a similar extent by both training modes in the current study in obese individuals.
eNOS ser1177 phosphorylation was increased in arterioles and capillaries following SIT and MICT; however, when this was normalised to eNOS protein content the difference was eliminated, suggesting that elevations in eNOS ser1177 were the result of the increased eNOS protein content and not an increase in the phosphorylation state following training. The findings do nonetheless suggest that eNOS ser1177 phosphorylation responds differently to training in obese and lean sedentary individuals, as 6 weeks of MICT or SIT resulted in a significant reduction in eNOS ser1177 phosphorylation (mixed skeletal muscle microvasculature) in sedentary young men (Cocks et al. 2013).
Skeletal muscle microvascular NOX2 content was reduced following both SIT and MICT in obese participants. The decrease in NOX2 following 4 weeks of either SIT or MICT is important as it will reduce NO quenching and increase NO bioavailability. The findings of the current study suggest that adaptations to skeletal muscle microvascular NOX2 content may differ between lean sedentary and obese sedentary men as skeletal muscle microvascular NOX2 content was not reduced after 6 weeks of SIT or MICT in sedentary males (Cocks et al. 2013).
The increase in eNOS content of terminal arterioles and reduction in mixed microvascular NOX2 content will improve the balance between NO production and NO quenching and will thus increase NO bioavailability in obese individuals. This mechanism may contribute to the improved insulin sensitivity observed following SIT and MICT (Table 1). Increases in skeletal muscle microvascular blood flow that are seen in response to insulin infusion or mixed‐meal ingestion are impaired in obesity (Clerk et al. 2006; Keske et al. 2009) and contribute to impaired glucose disposal in this population. It was assumed in these human studies that an impairment in the endothelial insulin signalling cascade prevented insulin‐induced eNOS activation, by means of ser1177 phosphorylation, in the terminal arterioles of skeletal muscle and therefore insulin‐mediated recruitment of microvasculature units and capillaries was impaired. In line with this suggestion Kubota et al. (2011) showed that administration of bera‐prost sodium, a stable prostaglandin I2 analogue, which can increase eNOS mRNA and protein expression in endothelial cells, completely reversed the reduction in capillary recruitment and insulin delivery to the muscle interstitium observed in high fat diet‐fed obese mice and also in mice with a genetic IRS‐2 deletion (ETIrs2KO). As such, the increased eNOS content observed following training in the current study is likely to have beneficial effects on insulin‐mediated vasodilatation in the obese volunteers, making a contribution to the observed improvement in insulin sensitivity. In addition to eNOS‐mediated production of NO, quenching of NO by .O2 − generated by NAD(P)Hox may further reduce NO bioavailability, further impairing insulin‐dependent increases in microvascular blood volume in obesity (Wagenmakers et al. 2006). Therefore, the reduced NAD(P)Hox subunit protein content is also likely to contribute to improved insulin‐mediated vasodilatation in obesity, and to the observed improvement in insulin sensitivity seen following training.
Microvascular density
This is the first study to measure capillary–fibre perimeter exchange (CPFE) index following SIT or MICT in an obese group. The 4 weeks SIT and MICT interventions both induced similar improvements in CFPE. CFPE index is regarded to be a valuable measure of microvascular density, as it may provide more information regarding the capacity for oxygen flux, and the transport of substances that rely on receptor or transporter‐mediated processes (i.e. glucose and insulin) than traditional measures such as CD (Hepple, 1997). Four weeks of SIT and MICT also increased capillary density (CD) and capillary contacts (CC), a finding that supports previous work following 3 months of aerobic training in obese women (Krotkiewski et al. 1983).
The current study was also the first to compare the effect of SIT and MICT on fibre type specific angiogenesis in humans. The data showed that capillarisation was increased independently of fibre type following both training modes. These results are in contrast to previous work in rats showing that interval training only increased capillary contacts in the white and mixed gastrocnemius, while low intensity continuous training increased capillary contacts in only the red and mixed portions of the gastrocnemius (Gute et al. 1994). Further confirmation of the increase in capillary density is provided by the increase in microvascular K f following SIT and MICT. Microvascular K f is a functional measure of capillary surface area available for diffusion of plasma water, known to correlate with capillary density (Charles et al. 2006).
The increase in capillarisation is likely to be a key adaptation contributing to the observed increase in following SIT and MICT, as increases in capillarisation are a well described adaptation contributing to the increases in aerobic exercise capacity following training (Saltin, 1988; Bassett & Howley, 2000; Saltin & Gollnick, 2011). A recent study by Akerstrom et al. (2014) has shown that increases in skeletal muscle capillary density directly contribute to increases in insulin sensitivity (using the α1‐adrenergic receptor agonist prazosin, which caused increases in skeletal muscle capillary density without concomitant improvements in skeletal muscle insulin signalling). As such the elevated capillarisation following SIT and MICT will also contribute to the improved delivery of nutrients and hormones to the muscle fibres, and therefore contribute to the improvements in insulin sensitivity in the current study. A concomitant increase in arteriolar density, as observed in rats following training (Laughlin et al. 2006), may combine with the increase in capillarisation to further improve the blood flow capacity of microvascular units.
Arterial stiffness
In the present study 4 weeks of constant workload SIT and MICT significantly reduced central artery stiffness and produced a strong trend for reduced peripheral artery stiffness in young healthy obese males. To the authors knowledge this is the first study to investigate arterial stiffness following SIT in an obese group, and only the second to study the effect of aerobic training on arterial stiffness, measured using PWV, in obesity. In line with the current study, Arena et al. (2005) showed that 10 weeks of aerobic training reduced aortic PWV in obese individuals. The reduced central artery stiffness observed is of clinical relevance as obesity is related to increased central artery stiffness even in young individuals (Zebekakis et al. 2005) and is associated with negative cardiovascular outcomes (Cecelja & Chowienczyk, 2009).
Previous studies using SIT (Cocks et al. 2013) or MICT (Hayashi et al. 2005) have shown no change in peripheral artery stiffness in sedentary lean young individuals. However, the influence of training on peripheral conduit artery stiffness (e.g. brachial artery) has not been investigated in an obese group, despite their known elevation in peripheral artery stiffness (Mitchell et al. 2004; Zebekakis et al. 2005). This elevation in peripheral artery stiffness observed in obesity may explain the strong trend for reduced peripheral artery stiffness following both SIT and MICT in the obese group studied.
The current study is also the first to investigate the effect of SIT on AIx in obesity, and the first to compare the effects of SIT and MICT in this population. The results suggest that SIT and MICT were equally effective in improving AIx, an assessment of systemic wave reflection. AIx has been shown to be of independent predictive value for all‐cause mortality (Laurent et al. 2006), and provides additional information compared to PWV alone, as AIx is determined by changes in small artery tone and structure as well as central artery stiffness (Kelly et al. 2001).
Conclusion
This study provides the novel information that 4 weeks of constant workload SIT is as effective as 4 weeks of traditional MICT in increasing eNOS content and reducing NOX2 (NAD(P)Hox subunit) protein expression in young obese males. The study also shows for the first time that SIT and MICT both lead to significant increases in skeletal muscle capillarisation in young obese males. In addition, it is shown that these changes in skeletal muscle microvascular structure and enzymes involved in NO bioavailability were paralleled by improvements in maximal aerobic capacity and insulin sensitivity, suggesting that microvascular adaptations may contribute to functional improvements in young obese males. The SIT intervention used in this study involved a maximum time commitment of 1 h per week, while the MICT intervention involved 5 h of exercise per week. Total work done in the SIT intervention was also only 8% of the MICT intervention. This leads to the conclusion that constant workload SIT is a time efficient alternative, requiring a fraction of the total workload, to achieve metabolic effects that are likely to lead to long‐term health benefits in young previously sedentary obese males. Finally, the study adds to the growing body of literature which suggests that constant workload SIT/HIT are effective and tolerable exercise modes in a number of at‐risk populations.
Additional information
Competing interests
The authors declare that there are no conflicting interests.
Author contributions
M.C., C.S.S. and A.J.M.W.: conception and design of the experiments, collection, analysis and interpretation of data, drafting and final revisions of the manuscript. S.O.S.: conception and design of the experiments, collection, analysis and interpretation of data. J.F.: design of the experiments, analysis and interpretation of data, revisions of manuscript. A.R. and T.B.: collection of data, revisions of manuscript. All authors have read and approved the final submission.
Funding
The study was supported by a grant awarded by the Insulin Dependent Diabetes Trust to C.S.S, J.P.F., and A.J.M.W.
Acknowledgements
The antibody against myosin (human slow twitch fibres, A4.840) used in the study was developed by Dr Blau, and obtained from the Developmental Studies Hybridoma Bank developed under the auspices of the NICHD and maintained by the University of Iowa, Department of Biological Sciences, Iowa City, IA 52242, USA.
References
- Akerstrom T, Laub L, Vedel K, Brand CL, Pedersen BK, Lindqvist AK, Wojtaszewski JF & Hellsten Y (2014). Increased skeletal muscle capillarization enhances insulin sensitivity. Am J Physiol Endocrinol Metab 307, E1105–E1116. [DOI] [PubMed] [Google Scholar]
- Arena R, Arrowood JA, Fei D‐Y, Shao X & Kraft KA (2005). Effect of aerobic exercise training on aortic wave velocity in obese subjects: a report of five cases. Case Rep Clin Pract Rev 6, 211–215. [Google Scholar]
- Babraj JA, Vollaard NB, Keast C, Guppy FM, Cottrell G & Timmons JA (2009). Extremely short duration high intensity interval training substantially improves insulin action in young healthy males. BMC Endocr Disord 9, 3. [DOI] [PMC free article] [PubMed] [Google Scholar]
- Bakker W, Eringa EC, Sipkema P & van Hinsbergh VWM (2009). Endothelial dysfunction and diabetes: roles of hyperglycemia, impaired insulin signaling and obesity. Cell Tiss Res 335, 165–189. [DOI] [PubMed] [Google Scholar]
- Barrett EJ, Eggleston EM, Inyard AC, Wang H, Li G, Chai W & Liu Z (2009). The vascular actions of insulin control its delivery to muscle and regulate the rate‐limiting step in skeletal muscle insulin action. Diabetologia 52, 752–764. [DOI] [PMC free article] [PubMed] [Google Scholar]
- Barrett EJ & Liu ZQ (2013). The endothelial cell: An "early responder" in the development of insulin resistance. Rev Endocr Metab Disord 14, 21–27. [DOI] [PMC free article] [PubMed] [Google Scholar]
- Barrett EJ, Wang H, Upchurch CT & Liu Z (2011). Insulin regulates its own delivery to skeletal muscle by feed‐forward actions on the vasculature. Am J Physiol Endocrinol Metab 301, E252–E263. [DOI] [PMC free article] [PubMed] [Google Scholar]
- Bassett DR & Howley ET (2000). Limiting factors for maximum oxygen uptake and determinants of endurance performance. Med Sci Sports Exerc 32, 70–84. [DOI] [PubMed] [Google Scholar]
- Brandes RP & Kreuzer J (2005). Vascular NADPH oxidases: molecular mechanisms of activation. Cardiovasc Res 65, 16–27. [DOI] [PubMed] [Google Scholar]
- Burgomaster KA, Howarth KR, Phillips SM, Rakobowchuk M, MacDonald MJ, McGee SL & Gibala MJ (2008). Similar metabolic adaptations during exercise after low volume sprint interval and traditional endurance training in humans. J Physiol 586, 151–160. [DOI] [PMC free article] [PubMed] [Google Scholar]
- Cecelja M & Chowienczyk P (2009). Dissociation of aortic pulse wave velocity with risk factors for cardiovascular disease other than hypertension a systematic review. Hypertension (Baltimore) 54, 1328. [DOI] [PubMed] [Google Scholar]
- Charles M, Charifi N, Verney J, Pichot V, Feasson L, Costes F & Denis C (2006). Effect of endurance training on muscle microvascular filtration capacity and vascular bed morphometry in the elderly. Acta Physiol 187, 399–406. [DOI] [PubMed] [Google Scholar]
- Clerk LH, Vincent MA, Jahn LA, Liu ZQ, Lindner JR & Barrett EJ (2006). Obesity blunts insulin‐mediated microvascular recruitment in human forearm muscle. Diabetes 55, 1436–1442. [DOI] [PubMed] [Google Scholar]
- Cocks M, Shaw CS, Shepherd SO, Fisher JP, Ranasinghe A, Barker TA, Tipton KD & Wagenmakers AJ (2014). Effect of resistance training on microvascular density and eNOS content in skeletal muscle of sedentary men. Microcirculation 21, 738–746. [DOI] [PubMed] [Google Scholar]
- Cocks M, Shaw CS, Shepherd SO, Fisher JP, Ranasinghe AM, Barker TA, Tipton KD & Wagenmakers AJM (2013). Sprint interval and endurance training are equally effective in increasing muscle microvascular density and eNOS content in sedentary males. J Physiol 591, 641–656. [DOI] [PMC free article] [PubMed] [Google Scholar]
- Cocks M, Shepherd SO, Shaw CS, Achten J, Costa ML & Wagenmakers AJM (2012). Immunofluorescence microscopy to assess enzymes controlling nitric oxide availability and microvascular blood flow in muscle. Microcirculation 19, 642–651. [DOI] [PubMed] [Google Scholar]
- Cohen J (1992). A power primer. Psychol Bull 112, 155–159. [DOI] [PubMed] [Google Scholar]
- Coyle EF (2005). Very intense exercise‐training is extremely potent and time efficient: a reminder. J Appl Physiol 98, 1983–1984. [DOI] [PubMed] [Google Scholar]
- de Jongh RT, Serne EH, Ijzerman RG, Jorstad HT & Stehouwer CDA (2008). Impaired local microvascular vasodilatory effects of insulin and reduced skin microvascular vasomotion in obese women. Microvasc Res 75, 256–262. [DOI] [PubMed] [Google Scholar]
- Delashaw JB & Duling BR (1988). A study of the functional elements regulating capillary perfusion in striated muscle. Microvasc Res 36, 162–171. [DOI] [PubMed] [Google Scholar]
- Doupis J, Rahangdale S, Gnardellis C, Pena SE, Malhotra A & Veves A (2011). Effects of diabetes and obesity on vascular reactivity, inflammatory cytokines, and growth factors. Obesity 19, 729–735. [DOI] [PMC free article] [PubMed] [Google Scholar]
- Frisbee JC (2007). Obesity, insulin resistance, and microvessel density. Microcirculation 14, 289–298. [DOI] [PubMed] [Google Scholar]
- Frisbee JC, Wu F, Goodwill AG, Butcher JT & Beard DA (2011). Spatial heterogeneity in skeletal muscle microvascular blood flow distribution is increased in the metabolic syndrome. Am J Physiol Regul Integr Comp Physiol 301, R975–R986. [DOI] [PMC free article] [PubMed] [Google Scholar]
- Gamble J, Gartside IB & Christ F (1993). A reassement of mercury in silastic strain‐gauge plethysmography for microvascular permeability assessment in man. J Physiol 464, 407–422. [DOI] [PMC free article] [PubMed] [Google Scholar]
- Gavin TP, Stallings HW, Zwetsloot KA, Westerkamp LM, Ryan NA, Moore RA, Pofahl WE & Hickner RC (2005). Lower capillary density but no difference in VEGF expression in obese vs. lean young skeletal muscle in humans. J Appl Physiol 98, 315–321. [DOI] [PubMed] [Google Scholar]
- Gibala MJ & McGee SL (2008). Metabolic adaptations to short‐term high‐intensity interval training: A little pain for a lot of gain? Exerc Sport Sci Rev 36, 58–63. [DOI] [PubMed] [Google Scholar]
- Guilherme A, Virbasius JV, Puri V & Czech MP (2008). Adipocyte dysfunctions linking obesity to insulin resistance and type 2 diabetes. Nat Rev Mol Cell Biol 9, 367–377. [DOI] [PMC free article] [PubMed] [Google Scholar]
- Gute D, Laughlin MH & Amann JF (1994). Regional changes in capillary supply in skeletal muscle of interval‐sprint and low‐intensity, endurance‐trained rats. Microcirculation 1, 183–193. [DOI] [PubMed] [Google Scholar]
- Haskell WL, Lee IM, Pate RR, Powell KE, Blair SN, Franklin BA, Macera CA, Heath GW, Thompson PD & Bauman A (2007). Physical activity and public health ‐ Updated recommendation for adults from the American college of sports medicine and the American heart association. Circulation 116, 1081–1093. [DOI] [PubMed] [Google Scholar]
- Hayashi K, Sugawara J, Komine H, Maeda S & Yokoi T (2005). Effects of aerobic exercise training on the stiffness of central and peripheral arteries in middle‐aged sedentary men. Jpn J Physiol 55, 235–239. [DOI] [PubMed] [Google Scholar]
- Hepple RT (1997). A new measurement of tissue capillarity: The capillary‐to‐fibre perimeter exchange index. Can J Appl Physiol 22, 11–22. [DOI] [PubMed] [Google Scholar]
- Hepple RT, Mackinnon SLM, Thomas SG, Goodman JM & Plyley MJ (1997). Quantitating the capillary supply and the response to resistance training in older men. Pflugers Archiv 433, 238–244. [DOI] [PubMed] [Google Scholar]
- Hoier B & Hellsten Y (2014). Exercise‐induced capillary growth in human skeletal muscle and the dynamics of VEGF. Microcirculation 21, 301–314. [DOI] [PubMed] [Google Scholar]
- Kelly RP, Millasseau SC, Ritter JM & Chowienczyk PJ (2001). Vasoactive drugs influence aortic augmentation index independently of pulse‐wave velocity in healthy men. Hypertension 37, 1429–1433. [DOI] [PubMed] [Google Scholar]
- Kelly T, Yang W, Chen CS, Reynolds K & He J (2008). Global burden of obesity in 2005 and projections to 2030. Int J Obes (Lond) 32, 1431–1437. [DOI] [PubMed] [Google Scholar]
- Keske MA, Clerk LH, Price WJ, Jahn LA & Barrett EJ (2009). Obesity blunts microvascular recruitment in human forearm muscle after a mixed meal. Diabetes Care 32, 1672–1677. [DOI] [PMC free article] [PubMed] [Google Scholar]
- Krotkiewski M, Bylund‐Fallenius AC, Holm J, Björntorp P, Grimby G & Mandroukas K (1983). Relationship between muscle morphology and metabolism in obese women: the effects of long‐term physical training. Eur J Clin Invest 13, 5–12. [DOI] [PubMed] [Google Scholar]
- Kubota T, Kubota N, Kumagai H, Yamaguchi S, Kozono H, Takahashi T, Inoue M, Itoh S, Takamoto I, Sasako T et al. (2011). Impaired insulin signaling in endothelial cells reduces insulin‐induced glucose uptake by skeletal muscle. Cell Metab 13, 294–307. [DOI] [PubMed] [Google Scholar]
- Laughlin MH, Cook JD, Tremble R, Ingram D, Colleran PN & Turk JR (2006). Exercise training produces nonuniform increases in arteriolar density of rat soleus and gastrocnemius muscle. Microcirculation 13, 175–186. [DOI] [PMC free article] [PubMed] [Google Scholar]
- Laughlin MH, Turk JR, Schrage WG, Woodman CR & Price EM (2003). Influence of coronary artery diameter on eNOS protein content. Am J Physiol Heart Circ Physiol 284, H1307–H1312. [DOI] [PubMed] [Google Scholar]
- Laurent S, Cockcroft J, Van Bortel L, Boutouyrie P, Giannattasio C, Hayoz D, Pannier B, Vlachopoulos C, Wilkinson I, Struijker‐Boudier H & European Network N‐i (2006). Expert consensus document on arterial stiffness: methodological issues and clinical applications. Eur Heart J 27, 2588–2605. [DOI] [PubMed] [Google Scholar]
- Little JP, Gillen JB, Percival ME, Safdar A, Tarnopolsky MA, Punthakee Z, Jung ME & Gibala MJ (2011). Low‐volume high‐intensity interval training reduces hyperglycemia and increases muscle mitochondrial capacity in patients with type 2 diabetes. J Appl Physiol 111, 1554–1560. [DOI] [PubMed] [Google Scholar]
- McAllister RM & Laughlin MH (2006). Vascular nitric oxide: effects of physical activity, importance for health. Essays Biochem 42, 119–131. [DOI] [PubMed] [Google Scholar]
- Mitchell GF, Parise H, Benjamin EJ, Larson MG, Keyes MJ, Vita JA, Vasan RS & Levy D (2004). Changes in arterial stiffness and wave reflection with advancing age in healthy men and women ‐ The Framingham Heart Study. Hypertension 43, 1239–1245. [DOI] [PubMed] [Google Scholar]
- Mount PF, Kemp BE & Power DA (2007). Regulation of endothelial and myocardial NO synthesis by multi‐site eNOS phosphorylation. J Mol Cell Cardiol 42, 271–279. [DOI] [PubMed] [Google Scholar]
- Myers J, Prakash M, Froelicher V, Do D, Partington S & Atwood JE (2002). Exercise capacity and mortality among men referred for exercise testing. N Eng J Med 346, 793–801. [DOI] [PubMed] [Google Scholar]
- Rakobowchuk M, Tanguay S, Burgomaster KA, Howarth KR, Gibala MJ & MacDonald MJ (2008). Sprint interval and traditional endurance training induce similar improvements in peripheral arterial stiffness and flow‐mediated dilation in healthy humans. Am J Physiol Regul Integr Comp Physiol 295, R236–R242. [DOI] [PMC free article] [PubMed] [Google Scholar]
- Saltin B (1988). Capacity of blood flow delivery to exercising skeletal muscle in humans. Am J Cardiol 62, 30E–35E. [DOI] [PubMed] [Google Scholar]
- Saltin B & Gollnick PD (2011). Skeletal muscle adaptability: significance for metabolism and performance. In Handbook of Physiology, section 10, Skeletal Muscle, pp. 555–631. American Physiological Society, Bethesda, MD, USA.
- Segal SS & Bearden SD (2012). Organisation and control of circulation to skeletal muscle In ACSM's Advanced Exercise Physiology, 2nd edn, eds Farrell PA, Joyner MJ. & Caiozzo VJ, pp. 332–347. Lippincott Williams & Wilkins. [Google Scholar]
- Silver AE, Beske SD, Christou DD, Donato AJ, Moreau KL, Eskurza I, Gates PE & Seals DR (2007). Overweight and obese humans demonstrate increased vascular endothelial NAD(P)H oxidase‐p47(phox) expression and evidence of endothelial oxidative stress. Circulation 115, 627–637. [DOI] [PubMed] [Google Scholar]
- Tarnopolsky MA, Pearce E, Smith K & Lach B (2011). Suction‐modified Bergstrom muscle biopsy technique: Experience with 13500 procedures. Muscle Nerve 43, 717–725. [DOI] [PubMed] [Google Scholar]
- Trost SG, Owen N, Bauman AE, Sallis JF & Brown W (2002). Correlates of adults' participation in physical activity: review and update. Med Sci Sports Exerc 34, 1996–2001. [DOI] [PubMed] [Google Scholar]
- Wagenmakers AJM, van Riel NAW, Frenneaux MP & Stewart PM (2006). Integration of the metabolic and cardiovascular effects of exercise. Essays Biochem 42, 193–210. [DOI] [PubMed] [Google Scholar]
- Weston KS, Wisløff U & Coombes JS (2013). High‐intensity interval training in patients with lifestyle‐induced cardiometabolic disease: a systematic review and meta‐analysis. Br J Sports Med 48, 1227–1234. [DOI] [PubMed] [Google Scholar]
- WHO (2009). World Health Organisation. Obesity.
- Wu F, Beard DA & Frisbee JC (2011). Computational analyses of intravascular tracer washout reveal altered capillary‐level flow distributions in obese Zucker rats. J Physiol 589, 4527–4543. [DOI] [PMC free article] [PubMed] [Google Scholar]
- Zebekakis PE, Nawrot T, Thijs L, Balkestein EJ, van der Heijden‐Spek J, Van Bortel LM, Struijker‐Boudier HA, Safar ME & Staessen JA (2005). Obesity is associated with increased arterial stiffness from adolescence until old age. J Hypertens 23, 1839–1846. [DOI] [PubMed] [Google Scholar]