

Abstract
The truncated non-signaling ghrelin receptor growth hormone secretagogue R1b (GHS-R1b) has been suggested to simply exert a dominant negative role in the trafficking and signaling of the full and functional ghrelin receptor GHS-R1a. Here we reveal a more complex modulatory role of GHS-R1b. Differential co-expression of GHS-R1a and GHS-R1b, both in HEK-293T cells and in striatal and hippocampal neurons in culture, demonstrates that GHS-R1b acts as a dual modulator of GHS-R1a function: low relative GHS-R1b expression potentiates and high relative GHS-R1b expression inhibits GHS-R1a function by facilitating GHS-R1a trafficking to the plasma membrane and by exerting a negative allosteric effect on GHS-R1a signaling, respectively. We found a preferential Gi/o coupling of the GHS-R1a-GHS-R1b complex in HEK-293T cells and, unexpectedly, a preferential Gs/olf coupling in both striatal and hippocampal neurons in culture. A dopamine D1 receptor (D1R) antagonist blocked ghrelin-induced cAMP accumulation in striatal but not hippocampal neurons, indicating the involvement of D1R in the striatal GHS-R1a-Gs/olf coupling. Experiments in HEK-293T cells demonstrated that D1R co-expression promotes a switch in GHS-R1a-G protein coupling from Gi/o to Gs/olf, but only upon co-expression of GHS-R1b. Furthermore, resonance energy transfer experiments showed that D1R interacts with GHS-R1a, but only in the presence of GHS-R1b. Therefore, GHS-R1b not only determines the efficacy of ghrelin-induced GHS-R1a-mediated signaling but also determines the ability of GHS-R1a to form oligomeric complexes with other receptors, promoting profound qualitative changes in ghrelin-induced signaling.
Keywords: cAMP, dopamine receptor, neuron, oligomerization, trafficking, HEK-293T cells, ghrelin, ghrelin receptor
Introduction
Ghrelin is an orexigenic hormone, an internal signal for the animal to engage in food-directed behavior (1, 2). It is produced by stomach oxyntic cells, which provide plasma levels that fluctuate diurnally with a peak in the day and trough at night. Notably, oxyntic cells qualify as food-entrained oscillators, and ghrelin plasma levels increase during anticipated mealtimes and decrease after meals (1). These and other less well characterized central neuronal functions of ghrelin depend on its ability to cross the blood-brain barrier by still unclear mechanisms and reaching ghrelin receptors localized in specific brain areas, such as the hypothalamus, hippocampus, amygdala, mesencephalic dopaminergic regions, and striatum (2–4).
Ghrelin acts on the class A G protein-coupled receptor known as growth hormone secretagogue (GHS)5 receptor or GHS-R1a. Cells expressing GHS-R1a also express GHS-R1b, a truncated variant of GHS-R1a lacking transmembrane domains 6 and 7. Ghrelin does not bind and therefore does not signal through GHS-R1b (5), and the role of this truncated “receptor” on ghrelin-mediated signaling is just beginning to be understood. Evidence has been provided for the ability of GHS-R1a to homodimerize and heterodimerize with GHS-R1b, which might allow GHS-R1b to produce a dominant negative effect on GHS-R1a signaling. Two different mechanisms have been invoked for the dominant negative function of GHS-R1b: intracellular retention by an inability of GHS-R1b to traffic to the plasma membrane (6, 7) and an allosteric mechanism that produces a conformational block of GHS-R1a in a non-signaling conformation (5). Those results were obtained from in vitro experiments in transfected cells and in reconstituted lipid vesicles, and, therefore, either mechanism could be involved in a physiological cellular environment. However, although both mechanisms do not seem exclusive, the intracellular retention of the GHS-R1a-GHS-R1b heteromer would render the reported complete blockade of G protein activation and β-arrestin recruitment (5) a fortuitous useless mechanism because both signaling pathways originate in the plasma membrane. The initial aim of this study was elucidating the mechanisms of GHS-R1b-mediated modulation of GHS-R1a in a neuronal environment and includes signaling experiments performed in a mammalian cell line and primary neurons in culture, with particular emphasis on the changes produced by manipulation of the relative expression of GHS-R1a and GHS-R1b in the plasma membrane. The study reveals a significant and complex modulatory role of GHS-R1b in the trafficking and signaling of GHS-R1a that depends on the relative expression of both proteins. An unexpected additional finding in striatal and hippocampal neurons in culture was a predominant Gs/olf protein-dependent signaling of ghrelin that, in striatal neurons, depended on dopamine D1 receptor (D1R)-GHS-R1a-GHS-R1b heteromerization.
Experimental Procedures
Cell Lines and Neuronal Primary Cultures
HEK-293T cells were grown in DMEM (Gibco) supplemented with 2 mm l-glutamine, 100 μg/ml sodium pyruvate, 100 units/ml penicillin/streptomycin, minimum Eagle's medium non-essential amino acid solution (1/100) and 5% (v/v) heat-inactivated FBS (all supplements were from Invitrogen). Primary cultures of striatal, hippocampal, and cortical neurons were obtained from fetal Sprague-Dawley rats (embryonic day 19). Cells were isolated as described in Ref. 8 and plated at a confluence of 40,000 cells/0.32 cm2 in 96-well plates for MAPK experiments and in 6-well plates for the other assays. Cells were maintained in Neurobasal medium supplemented with 2 mm l-glutamine, 100 units/ml penicillin/streptomycin, and 2% (v/v) B27 supplement (Gibco) in a 96-well plate for 12 days.
Vectors and Fusion Proteins
Sequences encoding amino acid residues 1-155 and 155-238 of the Venus variant of YFP and amino acid residues 1-229 and 230-311 of Rluc8 protein were subcloned in the pcDNA3.1 vector to obtain YFP and Rluc hemitruncated proteins. Human cDNAs for GHS-R1a, GHS-R1b, cannabinoid CB1 receptor (CB1R), corticotropin-releasing factor CRF1 receptor (CRF1R), or adenosine A1 receptor (A1R), cloned into pcDNA3.1, were amplified without their stop codons using sense and antisense primers harboring EcoRI and KpnI sites to clone GHS-R1a, GHS-R1b and CRF1R in the pRLuc-N1 vector (pRLuc-N1, PerkinElmer Life Sciences) or in the pEYFP-N1 vector (enhanced yellow variant of GFP, Clontech); HindIII and BamHI sites to clone A1R in the pcDNA3.1cRluc8- vector; BamHI and EcoRI sites to clone CB1R in the pcDNA3.1RLuc vector; or EcoRI and KpnI sites to clone GHS-R1a receptors in a GFP2-containing vector (p-GFP2, Packard BioScience, Meridien, CT). Amplified fragments were subcloned to be in-frame with restriction sites of pRLuc-N1, pEYFP-N1, or p-GFP2 vectors to provide plasmids that express proteins fused to RLuc, YFP, or GFP2 on the C-terminal end (GHS-R1a-Rluc, GHS-R1b-Rluc, CB1R-Rluc, CRF1R-Rluc, GHS-R1a-YFP, GHS-R1b-YFP, or GHS-R1a-GFP2). For bioluminescence resonance energy transfer (BRET) with bimolecular fluorescence and luminescence complementation (BiFC and BiLC) experiments, cDNA for GHS-R1b was subcloned into pcDNA3.1-nVenus and cDNA for GHS-R1a was subcloned into pcDNA3.1-cVenus to provide plasmids that express the receptor fused to the hemitruncated nYFP Venus or cYFP Venus on the C-terminal end of the receptor (GHS-R1b-nYFP and GHS-R1a-cYFP). Also, the cDNA for GHS-R1b was subcloned into pcDNA3.1-nRluc8 and the cDNA for GHS-R1a and A1R were subcloned into pcDNA3.1-cRluc8 to provide plasmids that express the receptor fused to the hemitruncated nRluc8 or cRluc8 on the C-terminal end of the receptor (GHS-R1b-nRluc, GHS-R1a-cRluc, and A1R-cRluc).
Cell Transfection
HEK-293T cells and neuronal primary cultures growing in 6-well dishes were transiently transfected with the corresponding protein cDNA by the PEI (Sigma-Aldrich, St. Louis, MO) method. Cells were incubated (4 h for HEK-293T cells and 6 h for neurons) with the corresponding cDNA together with PEI (5.47 mm in nitrogen residues) and 150 mm NaCl in a serum-starved medium. After 4 h, the medium was changed to a fresh complete culture medium. Forty-eight hours after transfection, cells were washed twice in quick succession in Hanks' balanced salt solution with 10 mm glucose, detached, and resuspended in the same buffer. Cells were maintained at 37 °C in an atmosphere of 5% CO2.
Resonance Energy Transfer-based Assays
For BRET assays, HEK-293T cells were transiently co-transfected with a constant cDNA encoding for receptor-Rluc and with increasing amounts of cDNA corresponding to receptor-YFP or receptor-GFP2. To control the cell number, the sample protein concentration was determined using a Bradford assay kit (Bio-Rad) using bovine serum albumin dilutions as standards. To quantify fluorescence proteins, cells (20 μg protein) were distributed in 96-well microplates (black plates with a transparent bottom), and the fluorescence was read in a Fluostar Optima fluorimeter (BMG Labtech, Offenburg, Germany) equipped with a high-energy xenon flash lamp using a 10-nm bandwidth excitation filter at 410 nm for receptor-GFP2 reading or 485 nm for receptor-YFP reading. Receptor fluorescence expression was determined as fluorescence of the sample minus the fluorescence of cells expressing receptor-Rluc alone. For BRET measurements, the equivalent of 20 μg of cell suspension was distributed in 96-well white microplates with white bottoms (Corning 3600, Corning, NY) and 5 μm of coelenterazine H (for the YFP acceptor) or DeepBlueC (for the GFP2 acceptor) (Molecular Probes, Eugene, OR) were added. Using DeepBlueC or coelenterazine H as substrates results in respective 410- and 485-nm emissions from Rluc, which allows the respective selective energy transfer to GFP2 and YFP (14). One minute after adding coelenterazine H or immediately after addition of DeepBlueC, BRET was determined using a Mithras LB 940 reader (Berthold Technologies, DLReady), which allows the integration of the signals detected in the short-wavelength filter at 485 nm and the long-wavelength filter at 530 nm when YFP is the acceptor or the short-wavelength filter at 400 nm and the long-wavelength filter at 510 nm when GFP2 is the acceptor. To quantify receptor-Rluc expression, luminescence readings were performed after 10 min of adding 5 μm of coelenterazine H irrespective of the acceptor used. Net BRET is defined as [(long-wavelength emission)/(short-wavelength emission)] − Cf, where Cf corresponds to [(long-wavelength emission)/(short-wavelength emission)] for the Rluc construct expressed alone in the same experiment. For BiFC and BiLC assays, HEK-293T cells were transiently co-transfected with a constant amount of cDNA encoding for proteins fused to nRLuc8 or cRLuc8 and with increasing amounts of the cDNA corresponding to proteins fused to nYFP Venus or cYFP Venus. The complemented YFP Venus or Rluc8 expression and BRET were quantified as described above. For sequence resonance energy transfer (SRET) assays (14), HEK-293T cells were transiently co-transfected with constant amounts of cDNAs encoding for both the receptor fused to RLuc or GFP2 and with increasingly amounts of cDNA corresponding to the receptor fused to YFP. Using aliquots of transfected cells (20 μg of protein), different determinations were performed in parallel: quantification of protein-YFP expression and quantification of protein-Rluc expression as described above. For SRET, cells were distributed in 96-well microplates, and 5 μm DeepBlueC was added. The SRET signal was collected using a Mithras LB 940 reader with detection filters for short wavelength (410 nm) and long wavelength (530 nm). By analogy with BRET, net SRET is defined as ((long wavelength emission)/(short wavelength emission)) − Cf, where Cf corresponds to long wavelength emission / short wavelength emission for cells expressing protein-Rluc and protein-GFP2. Linear unmixing was done for SRET quantification, taking into account the spectral signature to separate the two fluorescence emission spectra (11). SRET is expressed as milliSRET units (mSU; net SRET × 1000).
Immunocytochemistry
Transiently transfected HEK-293T cells were fixed in 4% paraformaldehyde for 15 min and washed with PBS containing 20 mm glycine (buffer A) to quench the aldehyde groups. After permeabilization with buffer A containing 0.2% Triton X-100 for 5 min, cells were treated with PBS containing 1% bovine serum albumin. After 1 h at room temperature, cells expressing receptor-Rluc were labeled with a primary mouse monoclonal anti-Rluc antibody (1/100, EMD Millipore, Darmstadt, Germany) for 1 h, washed, and stained with a secondary antibody for Cy3 donkey anti-mouse (1/100, Jackson ImmunoResearch Laboratories, Baltimore, MD). Receptors fused to YFP were detected by their fluorescence properties. Samples were rinsed and observed under a Leica SP2 confocal microscope or an SP5 confocal microscopy for DsRed (Leica Microsystems, Mannheim, Germany).
Western Blotting
To determine the GHS-R1a-YFP, GHS-R1b-YFP, or CB1R-YFP expression levels in transfected HEK-293T cells, equivalent amounts of cell protein (10 μg) were separated by electrophoresis on a denaturing 10% SDS-polyacrylamide gel and transferred onto PVDF fluorescence membranes. The membranes were probed with a mixture of a mouse anti-β-tubulin antibody (1:2000, Sigma-Aldrich) and a rabbit anti-YFP antibody (1:1000, Santa Cruz Biotechnology, Dallas, TX) and a mixture of IRDye 800 (anti-mouse) antibody (1:10,000; Sigma-Aldrich) and IRDye 680 (anti-rabbit) antibody (1:10,000; Sigma). Bands were scanned using an Odyssey infrared scanner (LI-COR Biotechnology, Lincoln, NE). Band densities were quantified using the scanner software, and the receptor level was normalized for differences in loading using tubulin protein band intensities.
Biotinylation Experiments
Cell surface proteins were biotinylated as described previously (9) using HEK-293T cells transiently expressing GHS-R1a-YFP and increasing amounts of GHS-R1b-Rluc or CB1R-Rluc or expressing increasing amounts of GHS-R1b-Rluc. Cells were washed three times with borate buffer (10 mm H3BO3 (pH 8.8) and 150 mm NaCl) and incubated with 50 μg/ml sulfo-NHS-LC-biotin (Thermo Fisher Scientific, Halethorpe, MD) in borate buffer for 5 min at room temperature. Cells were then washed three times in borate buffer and again incubated with 50 μg/ml sulfo-NHS-LC-biotin in borate buffer for 10 min at room temperature, followed by addition of 13 mm NH4Cl for 5 min to quench the remaining biotin. Cells were washed in PBS, disrupted with three 10-s strokes in a Polytron, and centrifuged at 16,000 × g for 30 min. The pellet was solubilized in ice-cold radioimmune precipitation assay buffer (50 mm Tris-HCl, 1% Triton X-100, 0.2% SDS, 100 mm NaCl, 1 mm EDTA, and 0.5% sodium deoxycholate) for 30 min and centrifuged at 16,000 × g for 20 min. The supernatant was incubated with 80 μl streptavidin-agarose beads (Sigma-Aldrich) for 1 h with constant rotation at 4 °C. Beads were washed three times with ice-cold lysis buffer and aspirated to dryness with a 28-gauge needle. Subsequently, 50 μl of SDS-PAGE sample buffer (8 m urea, 2% SDS, 100 mm dithiothreitol, and 375 mm Tris (pH 6.8)) were added to each sample. Proteins were dissociated by heating to 37 °C for 2 h and resolved by SDS-polyacrylamide gel electrophoresis in 10% gels and immunoblotted as described above.
RT-PCR Assay
Total cellular RNA was isolated from neuronal cultures using a QuickPrep total RNA extraction kit (Amersham Biosciences, Piscataway, NJ). Total RNA (1 μg) was reverse-transcribed by random priming using the RNase H minus, point mutant, Moloney murine leukemia virus reverse transcriptase, following the protocol for two-step RT-PCR provided by Promega (Madison, WI). The resulting single-stranded cDNA was used to perform PCR amplification for GHS-R1a and GHS-R1b and GAPDH as an internal control of the PCR technique using TaqDNA polymerase (Promega). A rat GHS-R1a and GHS-R1b common forward primer (5′-GCTCTTCGTGGTGGGCATCT-3′) was used. To amplify GHS-R1a, the 5′-GAGAAGGATTCAAATCCTAGCA-3′ reverse primer was used, corresponding to a nucleotide sequence coding for transmembrane domain 7, not present in GHS-R1b. To amplify GHS-R1b, the 5′-TCAGCGGGTGCCAGGACTC-3′ reverse primer was used, corresponding to a nucleotide sequence coding for the five TM domain not present in GHS-R1a. To amplify GAPDH, the primers used were 5′-CATCCTGCACCACCAACTGCTTAG-3′ (forward) and 5′-GCCTGCTTCACCACCTTCTTGATG-3′ (reverse). RNA without reverse transcriptions did not yield any amplicons, indicating that there was no genomic DNA contamination.
Dynamic Mass Redistribution (DMR) Label-free Assays
Cell signaling was explored using an EnSpire® multimode plate reader (PerkinElmer Life Sciences) by a label-free technology. Refractive waveguide-grating optical biosensors, integrated in 384-well microplates, allow extremely sensitive measurements of changes in local optical density in a detecting zone up to 150 nm above the surface of the sensor. Cellular mass movements induced upon receptor activation were detected by illuminating the underside of the biosensor with polychromatic light and measured as changes in wavelength of the reflected monochromatic light that is a sensitive function of the index of refraction. The magnitude of this wavelength shift (in picometers) is directly proportional to the amount of DMR. Briefly, HEK-293T cells or neurons were seeded in 384-well sensor microplates to obtain 70–80% confluent monolayers. Prior to the assay, cells were washed twice with assay buffer (Hanks' balanced salt solution with 20 mm HEPES (pH 7.15)) and incubated for 2 h in the reader at 24 °C in 30 μl/well of vehicle (assay buffer with 0.1% DMSO). Hereafter, the sensor plate was scanned, and a baseline optical signature was recorded before adding 10 μl of test compound dissolved in vehicle. Then, DMR responses were monitored for at least 5000 s. Kinetic results were analyzed using EnSpire workstation software v. 4.10.
cAMP Accumulation
Homogeneous time-resolved fluorescence energy transfer assays were performed using the Lance Ultra cAMP kit (PerkinElmer Life Sciences). The optimal cell density was first established for an appropriate fluorescent signal by measuring the time-resolved FRET signal as a function of forskolin concentration using different cell densities. Forskolin dose-response curves were related to the cAMP standard curve to establish which cell density provides a response that covers most of the dynamic range of the cAMP standard curve. 5000 HEK-293T cells or neurons/well in 384-well microplates growing in medium containing 50 μm zardeverine were pretreated with the antagonists or the corresponding vehicle at 25 °C for 20 min and stimulated with agonists for 15 min before adding 0.5 μm forskolin or vehicle and incubating for an additional 15-min period. Fluorescence at 665 nm was analyzed on a PHERAstar Flagship microplate reader equipped with an homogeneous time-resolved fluorescence energy transfer optical module (BMG Labtech).
Intracellular Calcium Release
Cells were co-transfected with the cDNA for the indicated receptors and 3 μg of GCaMP6 calcium sensor (10) using the Lipofectamine 2000 (Thermo Fisher Scientific) method. 48 h after transfection, 150,000 HEK-293T cells/well in 96-well black, clear-bottom microtiter plates were incubated with Mg+2-free Locke's buffer (pH 7.4) (154 mm NaCl, 5.6 mm KCl, 3.6 mm NaHCO3, 2.3 mm CaCl2, 5.6 mm glucose, and 5 mm HEPES) supplemented with 10 μm glycine, and receptor ligands were added as indicated. The fluorescence emission intensity of GCaMP6 was recorded at 515 nm upon excitation at 488 nm on the EnSpire® multimode plate reader for 335 s every 15 s and 100 flashes/well.
Arrestin Recruitment Assays
Arrestin recruitment was determined using BRET experiments as described above in HEK-293T cells expressing the cDNA corresponding to β-arrestin-2-Rluc (1 μg transfected), GHS-R1a-YFP (1.5 μg transfected) alone or with GHS-R1b (0.05–0.5 μg transfected) after the indicated treatment with ligands.
ERK1/2 Phosphorylation
HEK-293T cells (30,000 cells/well in 96-well plates) were treated with vehicle or the indicated ligand for the indicated time and were lysed by the addition of ice-cold lysis buffer (50 mm Tris-HCl (pH 7.4), 50 mm NaF, 150 mm NaCl, 45 mm β-glycerophosphate, 1% Triton X-100, 20 μm phenyl-arsine oxide, 0.4 mm NaVO4, and protease inhibitor mixture). Cellular debris was removed by centrifugation at 13,000 × g for 5 min at 4 °C, and the protein was quantified by the bicinchoninic acid method using bovine serum albumin dilutions as the standard. Equivalent amounts of protein (10 μg) were separated by electrophoresis (10% SDS-polyacrylamide gel) and transferred onto PVDF fluorescence membranes. The membranes were probed with a mixture of a mouse anti-phospho-ERK1/2 antibody (1:2500, Sigma-Aldrich) and a rabbit anti-ERK1/2 antibody that recognizes both phosphorylated and non-phosphorylated ERK1/2 (1:40,000, Sigma-Aldrich), and bands were visualized by the addition of a mixture of IRDye 800 (anti-mouse) antibody (1:10,000, Sigma-Aldrich) and IRDye 680 anti-rabbit antibody (1:10,000, Sigma-Aldrich) and scanned by the Odyssey infrared scanner. Bands densities were quantified using the scanner software, and the level of phosphorylated ERK1/2 isoforms was normalized for differences in loading using the total ERK1/2 protein band intensities.
Results
GHS-R1b-mediated Modulation of GHS-R1a Expression at the Plasma Membrane in Transfected HEX-293T Cells
The role of GHS-R1b on GHS-R1a expression in the plasma membrane was evaluated first by analyzing GHS-R1a expression by immunocytochemistry and confocal microscopy in HEK-293T cells transfected with cDNA of GHS-R1a fused to YFP (GHS-R1a-YFP, 1 μg), GHS-R1b fused to Rluc (GHS-R1b-Rluc, 0.5 μg), or both. Both GHS-R1a-YFP (Fig. 1A, identified by its own fluorescence) and GHS-R1b-Rluc (Fig. 1B, identified by anti-Rluc and secondary Cy3 antibodies, see “Experimental Procedures”), when expressed alone, could be detected in intracellular structures and at the plasma membrane level. Some degree of co-localization could be observed upon GHS-R1a-YFP and GHS-R1b-Rluc co-transfection (Fig. 1C). Fused receptors retained the same degree of functionality compared with non-fused receptors (Fig. 1D). Biotinylation experiments using a non-membrane permeable biotin were performed to provide a more accurate determination of receptor expression at the plasma membrane. HEK-293T cells were co-transfected with GHS-R1a-YFP cDNA (1 μg) and increasing amounts of GHS-R1b-Rluc cDNA (0, 0.1, 0.2, 0.3, or 0.6 μg) or only with GHS-R1b-Rluc cDNA (0.3 μg). Total expression of GHS-R1a-YFP (YFP fluorescence, 20,000 ± 2000 units) did not significantly change by increasing the expression of GHS-R1b-Rluc (Rluc luminescence, 10,000–300,000 units). To determine the relative expression of GHS-R1b with respect to GHS-R1a (GHS-R1b/GHS-R1a) in transfected cells, we performed parallel experiments in which HEK-293T cells were transfected with increasing amounts of GHS-R1a-YFP cDNA (up to 1.5 μg) or GHS-R1b-YFP cDNA (up to 0.6 μg), and the relative total expression of receptors was calculated by Western blotting using an anti-YFP antibody. Linearity of transfected cDNA versus the Western blotting signal or versus fluorescence was obtained in both cases (transfected cDNA in micrograms versus fluorescence values in arbitrary units gave linear plots with slopes of 0.885 and 0.099, respectively), which allowed the accurate determination of the relative GHS-R1b/GHS-R1a expression ratio. Co-transfection with 1 μg of GHS-R1a-YFP and 0, 0.1, 0.2, 0.3, or 0.6 μg of GHS-R1b-YFP gave GHS-R1b/GHS-R1a ratios of 0, 0.25, 0.5, 1.4, and 5, respectively. Biotinylation experiments demonstrated that transfected GHS-R1a was always present in the plasma membrane, with or without co-transfection with GHS-R1b, and that co-transfection with GHS-R1b resulting in GHS-R1b/GHS-R1a ratios from 0.25–5 led to an inverted U shape in the relative expression of GHS-R1a in the plasma membrane (Fig. 1E). As a negative control, no changes in GHS-R1a expression at the plasma membrane were detected upon co-transfection with increasing amounts of CB1R-Rluc cDNA (Fig. 1F, the CB1R/GHS-R1a expression ratio was calculated as above using the slope value of 0.139 corresponding to linear plots of transfected CB1R-YFP cDNA in micrograms versus fluorescence values in arbitrary units). Furthermore, biotinylation also demonstrated a linear increase in the plasma membrane expression of GHS-R1b upon increasing transfected amounts of GHS-R1b-YFP cDNA (Fig. 1G). These data indicate that GHS-R1b differentially modulates GHS-R1a expression at the plasma membrane level as a function of GHS-R1b/GHS-R1a expression ratio.
FIGURE 1.

GHS-R1b modulates plasma membrane expression of GHS-R1a in HEK-293T cells. A–C, confocal microscopy images of HEK-293T cells transfected with GHS-R1a-YFP cDNA (1.5 μg), GHS-R1b-Rluc (0.5 μg), or both. GHS-R1a-YFP was identified by its own fluorescence (green) and GHS-R1b-Rluc by a monoclonal anti-Rluc primary antibody and a cyanine-3-conjugated secondary antibody (red). C, colocalization of both receptors is shown in yellow. Cell nuclei were stained with Hoechst (blue). Scale bars = 10 μm. D, cAMP was determined in HEK-293T cells transfected with cDNA (1.5 μg) from the indicated receptors or fusion proteins. Cells were exposed for 15 min to vehicle or ghrelin (100 nm) in the presence of forskolin (0.5 μm). Values are means ± S.E. of three to four experiments and expressed as decreases (percent) versus forskolin alone (100%, dotted line). No statistical differences between differently transfected cells were found by ANOVA followed by Bonferroni's corrections (p > 0.05). E–G, biotinylation experiments were performed in HEK-293T cells co-transfected with GHS-R1a-YFP cDNA (1 μg) and increasing amounts of GHS-R1b-Rluc cDNA (0–0.6 μg) or GHS-R1b-Rluc cDNA alone (0.5 μg) (E), GHS-R1a-YFP cDNA (1 μg) and increasing amounts of CB1R-Rluc cDNA (0–1 μg) (F), or increasing amounts of GHS-R1b-Rluc cDNA (0.05–0.6 μg) (G). Quantification of immunoreactive bands from four to six independent experiments is shown. Values represent mean ± S.E. of the percentage of GHS-R1a-YFP membrane expression versus control cells (cells not expressing GHS-R1b-Rluc or CB1R-Rluc) (E and F) or the percentage of GHS-R1b-Rluc membrane expression versus control cells (non-transfected cells) (G). Statistical differences of differently transfected cells were analyzed by ANOVA followed by Bonferroni's corrections. *, p < 0.05; ***, p < 0.001 compared with control cells. Representative Western blotting analyses are shown in the bottom panels.
GHS-R1b-mediated Modulation of GHS-R1a Signaling in Transfected HEK-293T Cells
The role of GHS-R1b on GHS-R1a signaling was evaluated in HEK-293T cells expressing the same amount of GHS-R1a-YFP (fluorescence, 20,000 ± 2000) and increasing amounts of GHS-R1b-Rluc (0–5 GHS-R1b/GHS-R1a ratio). First, the effect of GHS-R1b on GHS-R1a signaling was determined with a DMR label-free assay (see “Experimental Procedures”), which can detect ligand-induced changes in light diffraction in the bottom 150 nm of a cell monolayer mostly dependent on G protein-dependent signaling (12). Ghrelin (10, 30, and 100 nm) induced dose- and time-dependent signaling in cells only transfected with GHS-R1a-YFP, which was inhibited by the GHS-R1a antagonist YIL781 (Fig. 2A). Ghrelin-induced DMR was completely blocked by pertussis toxin (PTX) but not by cholera toxin (CTX) or the Gq inhibitor YM254890 (Fig. 2B), indicating a predominant ghrelin-mediated Gi/o protein coupling to GHS-R1a in HEK-293T cells. As expected, ghrelin did not produce any significant effect in cells only expressing GHS-R1b-Rluc (Fig. 3A). The ghrelin-mediated DMR signal was then analyzed upon three different GHS-R1b/GHS-R1a expression ratios: 0.5, 1.4, and 5. At a GHS-R1b/GHS-R1a expression ratio of 0.5, ghrelin was significantly more efficient than when the cells were only transfected with GHS-R1a (Fig. 2, C and D). Taking also into account the results of biotinylation experiments, these results suggest that low relative GHS-R1b expression potentiates ghrelin-induced Gi/o protein-mediated signaling by facilitating GHS-R1a trafficking to the plasma membrane. However, progressively increasing the relative expression of GHS-R1b led to a progressive decrease in signaling that went down to an almost complete lack of effect of ghrelin with a GHS-R1b/GHS-R1a expression ratio of 5 (Fig. 2, C and D). This switch from facilitation to inhibition of ghrelin-induced Gi/o protein-mediated signaling cannot be explained by a GHS-R1b-mediated modulation of GHS-R1a trafficking because plasma membrane expression of GHS-R1a was the same at the highest GHS-R1b/GHS-R1a expression ratio than in cells not co-transfected with GHS-R1b (Fig. 1E). According to the predominant coupling to Gi/o protein, ghrelin dose-dependently decreased forskolin-induced cAMP accumulation in cells only expressing GHS-R1a (Fig. 4A). Again, this effect was not observed in cells only transfected with GHS-R1b (Fig. 3B), was inhibited by YIL781 (Fig. 4A), and was dependent on the GHS-R1b/GHS-R1a expression ratio, with ghrelin being more efficient, similarly efficient, and inefficient at expression ratios of 0.5, 1.4, and 5, respectively, compared with cells only transfected with GHS-R1a (Fig. 4B).
FIGURE 2.

GHS-R1b modulates GHS-R1a signaling detected by DMR in HEK-293T cells. DMR was determined in HEK-293T cells transfected with GHS-R1a-YFP cDNA (1 μg) (A and B) or co-transfected with GHS-R1a-YFP cDNA (1 μg) and increasing amounts of GHS-R1b-Rluc cDNA (0.05–0.6 μg) to obtain a 0.5, 1.4, and 5 GHS-R1b-Rluc/GHS-R1a-YFP ratio (C and D). Cells were pretreated overnight with vehicle (A, C, and D) or with PTX (10 ng/ml), CTX (100 ng/ml), or the Gαq inhibitor YM254890 (YM, 1 μm) (B), followed by treatment (15 min) with vehicle or the GHS-R1a antagonist YIL781 (2 μm) and activated with increasing concentrations of ghrelin (10, 30, and 100 nm; A, C, and D) or with 30 nm ghrelin (B). Representative picometer (pm) shifts of reflected light wavelength versus time curves are shown in A and C. Each curve represents the mean of an optical trace experiment carried out in triplicate. B, maximum responses at 500 s are derived from the corresponding picometer shifts of reflected light wavelength versus time curves. D, maximum responses at 500 s induced by different ghrelin concentrations (10–100 nm) are compared for GHS-R1b-Rluc/GHS-R1a-YFP ratios from 0–5. Values are derived from the curves in A and C. Statistical differences of the effect of ghrelin between cells treated with PTX compared with vehicle-treated cells (B) or in cells transfected with different GHS-R1b/GHS-R1a ratios compared with cells only expressing GHS-R1a (D) were analyzed by ANOVA followed by Bonferroni's corrections. *, p < 0.05; **, p < 0.01; ***, p < 0.001.
FIGURE 3.

Lack of functionality of GHS-R1b when expressed without GHS-R1a. DMR (A), cAMP accumulation (B), cytosolic Ca2+ increases (C), β arrestin-2 recruitment (D), and ERK1/2 phosphorylation (E) were determined in HEK-293T cells transfected with 0.4 μg of GHS-R1b-Rluc cDNA. The cells were pretreated (15 min) with vehicle or the GHS-R1a antagonist YIL781 (YIL, 2 μm), followed by activation (15 min) with increasing concentrations of ghrelin in the absence (A and C–E) or presence (B) of 0.5 μm forskolin (FK). Values are means ± S.E. of four to five experiments. pm, picometer.
FIGURE 4.

GHS-R1b modulates GHS-R1a-mediated inhibition of adenylyl cyclase in HEK-293T cells. cAMP accumulation was determined in HEK-293T cells transfected with GHS-R1a-YFP cDNA (1 μg) (A) or co-transfected with GHS-R1a-YFP cDNA (1 μg) and increasing amounts of GHS-R1b-Rluc cDNA (0.05–0.6 μg) to obtain a 0.5, 1.4, and 5 GHS-R1b-Rluc/GHS-R1a-YFP ratio (B). Cells were incubated overnight with vehicle or PTX (10 ng/ml) or for 2 h with CTX (100 ng/ml) and pretreated (15 min) with vehicle or the GHS-R1a antagonist YIL781 (2 μm), followed by activation (15 min) with ghrelin in the absence or presence of 0.5 μm forskolin (FK). Values are means ± S.E. of five to six experiments per treatment and expressed as decreases of forskolin-induced cAMP accumulation (100%, dotted line). Statistical differences of the effect of differently treated cells under different transfection conditions were analyzed by ANOVA followed by Bonferroni's corrections. *, p < 0.05; ***, p < 0.001 compared with the effect of forskolin alone.
Ghrelin also induced a dose-dependent increase in cytosolic Ca2+ (Fig. 5, A and B), β arrestin-2 recruitment (Fig. 5C), and ERK1/2 phosphorylation (Fig. 5D) in HEK-293T cells only transfected with GHS-R1a. All measured ghrelin-activated signaling pathways were also inhibited by YIL781 (Fig. 5), and they were not observed in cells only transfected with GHS-R1b (Fig. 3, C–E). Importantly, these three signaling mechanisms were dependent on the GHS-R1b/GHS-R1a expression ratio (Fig. 5). As observed with DMR and cAMP accumulation experiments, at GHS-R1b/GHS-R1a expression ratios of 0.5, 1.4, and 5, ghrelin was more efficient, similarly efficient, and significantly less efficient or inefficient, respectively, compared with cells only transfected with GHS-R1a (Fig. 5).
FIGURE 5.

GHS-R1b modulates GHS-R1a-mediated cytosolic Ca2+ increase, β arrestin-2 recruitment, and ERK1/2 phosphorylation. A and B, HEK-293T cells were transfected with GHS-R1a-YFP cDNA (1 μg) or co-transfected with GHS-R1a-YFP cDNA (1 μg) and increasing amounts of GHS-R1b-Rluc cDNA (0.05–0.6 μg) to obtain a 0.5, 1.4, and 5 GHS-R1b-Rluc/GHS-R1a-YFP ratio. A, representative intracellular curves of Ca+2 release over time. B, values of maximal Ca+2 release (means ± S.E., n = 4–6) induced by 30 nm ghrelin were derived from the curves obtained at the different GHS-R1b-Rluc/GHS-R1a-YFP ratios. C, β-arrestin-2 recruitment (means ± S.E., n = 5–7) was measured by BRET experiments in cells transfected with 1 μg of β-arrestin-2-Rluc cDNA and 1 μg of GHS-R1a-YFP cDNA in the absence or the presence of GHS-R1b cDNA (0.05–0.6 μg). In all cases, cells were pretreated (15 min) with vehicle or the GHS-R1a antagonist YIL781 (2 μm), followed by activation with ghrelin (30, 100, or 300 nm). D, ERK1/2 phosphorylation from the same transfected cell groups and treatments as in C, expressed as a percentage over values found in non-transfected cells (means ± S.E., n = 5–7). Representative Western blotting analyses are shown in the bottom panel. Statistical differences of the effect of different GHS-R1b/GHS-R1a ratios under different treatment conditions were analyzed by ANOVA followed by Bonferroni's corrections. *, p < 0.05 compared with cells only expressing GHS-R1a.
Homodimers and Heterotetramers of GHS-R1a and GHS-R1b in HEK-293T-transfected Cells
Biotinylation and signaling experiments therefore did not support a preferential intracellular localization of GHS-R1b and GHS-R1a retention upon intracellular heteromerization with GHS-R1b as the basis for a dominant negative effect of GHS-R1b on GHS-R1a function (6, 7). Our results instead fit with a negative effect of GHS-R1b on GHS-R1a signaling upon heteromerization in the plasma membrane (5). Because GPCR homodimers seem to be a predominant species and oligomeric entities are viewed as multiples of dimers (13), we also investigated the possibility of homodimerization of GHS-1b and heteromerization of GHS-R1a and GHS-R1b homodimers. Saturable BRET curves were obtained in HEK-293T cells expressing a constant amount of GHS-R1a-Rluc and increasing amounts of GHS-R1a-GFP2 (Fig. 6A, BRETmax of 82 ± 6 mBU and BRET50 of 55 ± 13 mBU) or a constant amount of GHS-R1b-Rluc and increasing amounts of GHS-R1b-YFP (Fig. 6B, BRETmax of 124 ± 12 mBU and BRET50 of 52 ± 16 mBU), strongly suggestive of homodimerization. As negative controls, linear plots with low BRET values were obtained using either CB1R-Rluc (Fig. 6A) or CRF1-Rluc (Fig. 6B). SRET assay was then used to evaluate the possibility of direct interactions between three receptor molecules, either two GHS-R1a and one GHS-R1b or two GHS-R1b and one GHS-R1a, as depicted in Fig. 6, C and D. In this assay, Rluc was fused to one of the receptor units to act as a BRET donor, GFP2 was fused to a second receptor unit to act as a BRET acceptor and FRET donor, and YFP was fused to the third receptor unit to act as a FRET acceptor. The cDNA constructs were transfected in HEK-293T cells, and YFP emission was determined after adding DeepBlueC as luciferase substrate. Positive SRET saturation curves were obtained with transfection of a constant amount of GHS-R1b-Rluc and GHS-R1a-GFP2 and increasing amounts of GHS-R1a-YFP (Fig. 6C) or increasing amounts of GHS-R1b-YFP (Fig. 6D), with SRETmax values of 222 ± 18 mSU and 40 ± 5 mSU and SRET50 values of 48 ± 14 mSU and 72 ± 20 mSU, respectively. As negative controls, linear plots with low SRET values were obtained when CB1R-Rluc was transfected as the BRET donor of GHS-R1a or GHS-R1b FRET pairs (Fig. 6, C and D). These results show the ability of GHS-R1a and GHS-R1b to assemble as heterotrimers and possibly heterotetramers. Support for heterotetramer formation was obtained by using BRET with double BiLC and BiFC assays (15, 16). In this assay, the two BRET sensors, the donor Rluc8 (a more efficient variant of Rluc) and the acceptor YFP Venus (a more efficient variant of YFP), are split into two hemiproteins, with each split sensor being fused to one of the four putative interacting receptors. BRET indicates reconstitution of both sensors and close proximity of the four receptors. A saturable BRET curve (BRETmax of 111 ± 10 mBU and BRET50 of 7 ± 2 mBU) was detected in HEK-293T cells co-transfected with equal amounts of GHS-R1a-cRluc and GHS-R1b-nRluc cDNAs and increasing amounts of GHS-R1a-cYFP and GHS-R1b-nYFP cDNAs (Fig. 6E). Negative controls were cells transfected with adenosine A1R-cRluc cDNA instead of GHS-R1a-cRluc cDNA (Fig. 6E). Collectively, these results indicate that GHS-R1a and GHS-R1b receptors can form oligomeric complexes that include heteromers of homodimers.
FIGURE 6.

Heterotetramers of GHS-R1a and GHS-R1b homodimers in HEK-293T cells. A and B, GHS-R1a and GHS-R1b homodimers were detected by BRET saturation experiments in HEK-293T cells co-transfected with GHS-R1a-Rluc cDNA (1.5 μg) and increasing amounts of GHS-R1a-GFP2 cDNA (0.5–3 μg) (A) or a constant amount of GHS-R1b-Rluc cDNA (0.3 μg) and increasing amounts of GHS-R1b-YFP (0.05–0.6 μg) (B). As negative controls, linear and low BRET values were obtained by transfecting the cDNA corresponding to either cannabinoid receptor CB1R-Rluc (0.5 μg, A) or the corticotropin-releasing factor receptor CRFR1-Rluc (0.3 μg, B) as BRET donors. C and D, positive SRET saturation curves were obtained in HEK-293T cells co-transfected with a constant amount of GHS-R1b-Rluc cDNA (0.4 μg) and GHS-R1a-GFP2 cDNA (1.5 μg) and increasing amounts of GHS-R1b-YFP cDNA (0.5–3 μg, C) or GHS-R1a-YFP cDNA (0.05–0.5 μg, D). As SRET negative controls, linear and low SRET values were obtained when CB1R-Rluc cDNA (0.4 μg) was transfected as BRET donor of GHS-R1a or GHS-R1b FRET pairs. E, the BiLFC saturation curve was obtained in HEK-293T cells co-transfected with equal amounts of cDNA corresponding to GHS-R1a-cRluc and GHS-R1b-nRluc (1.5 μg) and increasing amounts of GHS-R1a-cYFP and GHS-R1b-nYFP cDNAs (0.5–2.5 μg for each). As a negative control, linear and low BiLFC were obtained in cells transfected with adenosine A1R-cRluc cDNA (0.2 μg) instead of GHS-R1a-cRluc cDNA. The relative amounts of BRET or SRET are given as a function of 100× the ratio between the fluorescence of the acceptor and the luciferase activity of the donor. BRET and SRET are expressed as milliBRET units or milliSRET units (mSU) and given as the means ± S.D. of four to five experiments grouped as a function of the amount of BRET or SRET acceptor.
Differential GHS-R1b-mediated Modulation of GHS-R1a Signaling in Rat Striatal and Hippocampal Neurons
The significance of GHS-R1a-mediated signaling and its modulation by heteromerization with GHS-R1b was then addressed in primary neuronal cultures from the striatum and hippocampus, brain areas that express functional GHS-R1a receptors (3, 4). The relative expression of both GHS-R1a and GHS-R1b, determined by RT-PCR, was higher in striatal compared with hippocampal primary cultures (Figs. 7A). DMR was first analyzed to evaluate ghrelin-mediated signaling, and a dose-dependent response was obtained in both primary cultures (Fig. 7, B–D). Ghrelin was more potent and efficient in striatal than in hippocampal neurons, and its effects were counteracted by YIL781 in both preparations (Fig. 7, B–D). As shown in Fig. 7A, the relative expression of GHS-R1b was higher than GHS-R1a in striatal neurons, whereas the opposite, a higher relative expression of GHS-R1a than GHS-R1b, was observed in hippocampal neurons. Therefore, from the results obtained in HEK-293T cells, we anticipated that an increase in GHS-R1b expression could lead to opposite effects in hippocampal and striatal neurons. Indeed, in hippocampal primary cultures, transfection with increasing amounts of GHS-R1b cDNA (0.1 and 0.5 μg) led to a progressive significant increase in the efficacy of ghrelin-induced DMR (Fig. 8, A and C), whereas, in striatal primary cultures, GHS-R1b transfection led to the opposite effect (Fig. 8, B and C). By analyzing another signaling readout, cAMP accumulation, unexpected results were obtained compared with HEK-293T cells in both hippocampal and striatal primary cultures. Ghrelin produced an increase in cAMP production with an inverted U-shaped dose-response (maximal effect at about 100 nm), indicating an agonist-induced desensitization effect (Fig. 8, D and E). This effect was blocked by YIL781 in both preparations (Fig. 8, D and E, black columns). The same as for DMR, in hippocampal and striatal primary cultures, transfection with increasing amounts of GHS-R1b cDNA (0.1 and 0.5 μg) led to a progressive significant increase and decrease, respectively, in the effect of ghrelin-induced cAMP accumulation (Fig. 8, D and E). The results also showed that, in neurons, GHS-R1b can positively or negatively modulate GHS-R1a function depending on the endogenous relative GHS-R1b/GHS-R1a expression ratio.
FIGURE 7.

Differential expression of GHS-R1a and GHS-R1b in striatal and hippocampal neurons in culture. A, the relative expression of GHS-R1a and GHS-R1b was determined by RT-PCR using primary cultures of rat hippocampal (white columns) and striatal (black columns) neurons. C and D, DMR was determined in striatal (C) or hippocampal (D) neuronal primary cultures pretreated (30 min) with vehicle or the GHS-R1a antagonist YIL781 (2 μm) and followed by activation with ghrelin (30 or 100 nm). Representative picometer (pm) shifts of reflected light wavelength versus time curves are shown. Each curve represents the mean of an optical trace experiment carried out in triplicate. B, maximum responses of DMR at 2000 s induced by ghrelin (30 or 100 nm) are compared for striatal and hippocampal neuronal cultures. Values are means ± S.E. of five to seven experiments performed with independent primary cultures. Statistical differences of the expression of GHS-R1a and GHS-R1b and the effect of ghrelin between hippocampal compared with striatal cell cultures were analyzed by ANOVA followed by Bonferroni's corrections. **, p < 0.01; ***, p < 0.001.
FIGURE 8.

GHS-R1b-mediated modulation of GHS-R1a signaling in striatal and hippocampal neurons. A–C, DMR was determined in rat hippocampal (A and C) and striatal (B and C) primary cultures not transfected (black) or transfected with 0.1 μg (blue) or 0.5 μg (green) of GHS-R1b cDNA and activated with 100 nm ghrelin. Representative picometer (pm) shifts of reflected light wavelength versus time curves are shown in A and B. Each curve represents the mean of an optical trace experiment carried out in triplicate. C, ghrelin-induced maximum responses at 2000 s are compared for striatal and hippocampal neuronal cultures not transfected or transfected with 0.1 or 0.5 μg of GHS-R1b cDNA. Statistical differences between differently transfected cells for each type of culture were analyzed by ANOVA followed by Bonferroni's corrections. *, p < 0.05; ***, p < 0.001 compared with non-transfected cells. D and E, cAMP accumulation was determined in rat hippocampal (D) and striatal (E) primary cultures not transfected (black) or transfected with 0.1 μg (blue) or 0.5 μg (green) of GHS-R1b cDNA. Cells were pretreated (15 min) with vehicle or the GHS-R1a antagonist YIL781 (2 μm), followed by activation (15 min) with increasing ghrelin concentrations. Values are means ± S.E. of four to six experiments and expressed as percentage of values from non-stimulated cells (100%, dotted line). Statistical differences between differently transfected cells were analyzed by ANOVA followed by Bonferroni's corrections. *, p < 0.05; ***, p < 0.001 compared with non-transfected cells.
Dopamine D1R Interacts with GHS-R1a-GHS-R1b Heteromers, Promoting Coupling to Gs/olf Protein
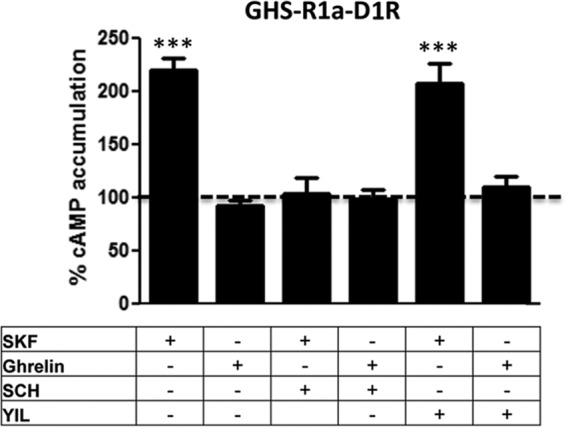
Previous studies have suggested that GHS-R1a-mediated signaling depends mostly on Gq coupling, although, in HEK-293T cells in this study, evidence for Gi/o coupling has also been obtained (see “Discussion”). Similarly, ghrelin-induced cAMP-PKA signaling has also been reported but suggested to be independent of Gs/olf proteins (see “Discussion”). The G protein subtype involved in ghrelin-induced cAMP accumulation in striatal and hippocampal neurons in culture was first investigated by using the Gs/olf toxin CTX, the Gi/o toxin PTX, and the Gq protein inhibitor YM254890. CTX, but not PTX or YM254890, prevented ghrelin-induced cAMP in both preparations (Fig. 9, A and B), identifying Gs/olf as predominant G proteins coupled to GHS-R1a in neurons. Although CTX increased the basal levels of cAMP by about 2- to 3-fold, this cannot explain an apparent inhibition of the effect of ghrelin because of saturation on the activation of adenylyl cyclase because, under the same experimental conditions, forskolin increased cAMP levels by 10-fold (data not shown). A possible explanation for the unexpected preferential coupling of GHS-R1a to Gs/olf in neurons versus Gi/o in HEK-293T cells could be the presence in neuronal primary cultures of additional receptors that could interact with GHS-R1a or GHS-R1b. Indeed, dopamine D1R is a canonical mediator of adenylyl cyclase activation that has been reported to heteromerize with GHS-R1a (17, 18). We then investigated its possible involvement in ghrelin-mediated cAMP accumulation in neurons in culture. In fact, the D1R antagonist SCH23390 (1 μm), but not the dopamine D2R antagonist raclopride (1 μm), blocked ghrelin-induced cAMP accumulation in striatal but not hippocampal neurons in culture (Fig. 9, C and D). That D1R co-expression can promote a switch in G protein coupling of GHS-R1a from Gi/o to Gs/olf was then demonstrated in HEK-293T cells transfected with GHS-R1b-Rluc cDNA (0.2 μg), GHS-R1a-YFP cDNA (1 μg, GHS-R1b/GHS-R1a ratio of 1.4) and D1R cDNA (0.4 μg, Fig. 10A), or D2R cDNA (0.4 μg, Fig. 10B). In the presence of D1R, both ghrelin (100 nm) and the D1R agonist SKF81297 (100 nm) increased cAMP production, an effect that was blocked by CTX but not by PTX or the Gq inhibitor YM254890 (Fig. 10A). In the presence of D2R, both ghrelin (100 nm) and the D2R agonist quinpirole (1 μm) decreased cAMP production, an effect that was blocked by PTX but not by CTX or the Gq inhibitor YM254890 (Fig. 10B). Fig. 10C demonstrates agonist selectivity at the concentrations used in cAMP experiments using cells only transfected with single receptors. In cells transfected with GHS-R1a, GHS-R1b, and D1R, co-activation of GHS-R1a and D1R with ghrelin (100 nm) and SKF81297 (100 nm) did not produce an additive or synergistic effect (Fig. 10D), but blockade of either receptor with the D1R antagonist SCH23390 (1 μm) or the GHS-R1a antagonist YIL781 (1 μm) completely counteracted cAMP accumulation induced by both ghrelin and SKF81297 (Fig. 10D). Because the interactions between GHS-R1a and D1R ligands, particularly the cross-antagonism (see “Discussion”), strongly suggested oligomerization, we investigated this possibility with BRET experiments. In HEK-293T cells transfected with a constant amount of D1R-Rluc cDNA (0.4 μg) and increasing amounts of GHS-R1a-YFP cDNA (0.2–1.5 μg) (Fig. 11A) or GHS-R1b-YFP cDNA (0.1–0.6 μg) (Fig. 11B), low and linear plots were observed, consistent with nonspecific interactions. Similarly, low BRET values were obtained (at a YFP/Rluc ratio of 100) when cells where exposed to ghrelin, the D1R agonist SKF81297, or both (100 nm in all cases, Fig. 11, C and D). Nevertheless, a saturable BRET curve was obtained when cells were transfected with D1R-Rluc cDNA (0.4 μg), increasing amounts of GHS-R1b-YFP cDNA (0.1–0.6 μg), and GHS-R1a cDNA (0.8 μg), with BRETmax and BRET50 values of 36 ± 6 mBU and 93 ± 10 mBU, respectively (Fig. 11E, black line), indicating that D1R specifically interacts with GHS-R1a-GHS-R1b heteromers. In agreement, significant BRET values could only be obtained in cells transfected with D1R-Rluc cDNA (0.4 μg) and GHS-R1a-GFP2 (1.0 μg) when co-transfected with increasing amounts of GHS-R1b cDNA (0.05–0.3 μg) (Fig. 11F). BRET saturation curves were also obtained in cells transfected with D1R-Rluc cDNA (0.4 μg), increasing amounts of GHS-R1b-YFP cDNA (0.1 to 0.6 μg), and GHS-R1a cDNA (0.8 μg) and treated with 100 nm SKF81297 (Fig. 11E, red line; BRETmax and BRET50 values of 34 ± 3 mBU and 25 ± 11 mBU, respectively), 100 nm ghrelin (Fig. 11E, green line; BRETmax and BRET50 values of 46 ± 3 mBU and 99 ± 12 mBU, respectively), or both (Fig. 11E, blue line; BRETmax and BRET50 values of 52 ± 3 mBU and 39 ± 9 mBU, respectively). The significant increase in BRETmax upon treatment with ghrelin indicates a facilitation of energy transfer or an increase in heteromer formation, whereas the significant decrease in BRET50 upon treatment with SKF81297 suggests an increase in the affinity of the interaction between receptors. Both effects, a significant increase in BRETmax and a significant decrease in BRET50, were observed upon co-treatment with ghrelin and SKF81297 (significant statistical differences in BRETmax and BRET50 compared with control non-treated cells were determined by ANOVA followed by Bonferroni's corrections: *, p < 0.05 in all cases). If D1R can only interact with GHS-R1a in the presence of GHS-R1b, the absence of GHS-R1b should disclose the properties that are dependent on GHS-R1a-GHR1b-D1R heteromerization. In fact, in cells transfected with D1R but only co-transfected with GHS-R1a, ghrelin (100 nm) did not produce cAMP accumulation, and YIL781 (1 μm) did not counteract cAMP accumulation induced by SKF81297 (100 nm) (Fig. 12). Together, the results from transfected HEK-293T cells provide a very plausible mechanism for the results obtained in striatal cells in culture, demonstrating that GHS-R1b determines the ability of GHS-R1a to form oligomeric complexes with D1R, which allows ghrelin to activate Gs/olf protein-mediated signaling.
FIGURE 9.

Gs/olf-coupling of ghrelin receptors in striatal and hippocampal neurons. A and B, cAMP accumulation was determined in rat striatal (A) and hippocampal (B) primary cultures incubated overnight with vehicle, PTX (10 ng/ml), or the Gαq inhibitor YM254890 (YM, 1 μm) or for 2 h with CTX (100 ng/ml). Cells were then treated with vehicle or ghrelin (100 nm). Values are means ± S.E. of three to four experiments and are expressed as percentage of the values of vehicle-treated cells (100%, dotted line). C and D, cAMP accumulation was determined in rat striatal (A) and hippocampal (B) primary cultures pretreated (15 min) with vehicle, the D1R antagonist SCH23390 (SCH, 1 μm), or the D2R antagonist raclopride (1 μm), followed by treatment (15 min) with vehicle or ghrelin (100 nm). Values are means ± S.E. of five to six experiments and are expressed as percentage of the values of vehicle-treated cells (100%, dotted line). Statistical differences between differently treated cells were analyzed by ANOVA followed by Bonferroni's corrections. *, p < 0.05; **, p < 0.01; ***, p < 0.001 compared with vehicle-treated cells. &&, p < 0.01 compared with ghrelin-treated cells.
FIGURE 10.

D1R promotes GHS-R1a-GHS-R1b heteromers coupling to Gs/olf protein. cAMP accumulation was determined in HEK-293T cells transfected with GHS-R1b-Rluc cDNA (0.2 μg), GHS-R1a-YFP cDNA (1 μg), and D1R cDNA (0.4 μg, A and D) or D2R cDNA (0.4 μg, B) or single-transfected with the same amount of the indicated receptors (C). Cells were incubated overnight with vehicle, PTX (10 ng/ml), or the Gαq inhibitor YM254890 (YM, 1 μm) or for 2 h with CTX (100 ng/ml) and pretreated (15 min) with vehicle, the GHS-R1a antagonist YIL781 (YIL, 2 μm), or the D1R antagonist SCH23390 (SCH, 1 μm), followed by activation (15 min) with ghrelin (100 nm), the D1R agonist SKF81297 (SKF, 100 nm), or the D2R agonist quinpirole (Quin, 1 μm) alone or in combination in the absence (A and D) or presence (B and C) of forskolin (FK, 0.5 μm). Values are means ± S.E. of six to eight experiments and expressed as percentage of values of cells not treated with ghrelin (100%, dotted line). Statistical differences between differently treated cells were analyzed by ANOVA followed by Bonferroni's corrections. *, p < 0.05; **, p < 0.01 compared with vehicle-treated cells.
FIGURE 11.

Selective heteromerization of D1R with GHS-R1a-GH-R1b complexes. BRET experiments in HEK-293T cells transfected with a constant amount of D1R-Rluc cDNA (0.4 μg) and increasing amounts of GHS-R1a-YFP cDNA (0.2–1.5 μg, A) or GHS-R1b-YFP cDNA (0.1–0.6 μg, B). BRET at a YFP/Rluc ratio of 100 was also determined in cells not activated or activated with ghrelin (100 nm), the D1R agonist SKF81297 (SKF, 100 nm), or both (C and D). E, BRET experiments were performed in HEK-293T cells transfected with D1R-Rluc cDNA (0.4 μg), GHS-R1a cDNA (0.8 μg), and increasing amounts of GHS-R1b-YFP cDNA (0.1–0.6 μg), not stimulated (black curve), or stimulated with SKF81297 (SKF, 100 nm, red curve), ghrelin (100 nm, green curve), or both (blue curve). F, BRET experiments were performed in HEK-293T cells transfected with D1R-Rluc cDNA (0.4 μg), GHS-R1a-GFP2 cDNA (1.0 μg), and increasing amounts of GHS-R1b cDNA (0.05–0.3 μg). BRET values are given as a function of 100× the ratio between the fluorescence of the acceptor and the luciferase activity of the donor. BRET is expressed as milliBRET units and given as the means ± S.D. of four to six experiments grouped as a function of the amount of BRET acceptor. Statistical differences between differently transfected cells were analyzed by ANOVA followed by Bonferroni's corrections. *, p < 0.05; **, p < 0.01 compared with cells not transfected with GHS-R1b.
FIGURE 12.
Dependence on GHS-R1b for D1R-mediated modulation of GHS-R1a signaling. cAMP accumulation was determined in cells transfected with GHS-R1a-YFP cDNA (1.5 μg) and D1R cDNA (0.5 μg). Cells were treated with vehicle, ghrelin (100 nm), or SKF 81297 (SKF, 100 nm) with and without YIL781 (YIL, 2 μm) or SCH23390 (SCH, 1 μm). Values are means ± S.E. of four to six experiments and are expressed as percentage values from cells only treated with vehicle (100%, dotted line). Statistical differences between differently treated cells were analyzed by ANOVA followed by Bonferroni's corrections. **, p < 0.01; ***, p < 0.001 compared with cells treated only with vehicle.
Discussion
Previous studies about the role of the truncated ghrelin receptor GHS-R1b only indicated a possible dominant negative effect, which could depend on its ability to retain the full and functional ghrelin receptor GHS-R1a in intracellular compartments (6, 7) or to stabilize GHS-R1a in a non-signaling conformation (5). This study does not support the intracellular mechanism as a main regulatory mechanism. Instead, it reveals a novel and complex modulatory role of GHS-R1b in the trafficking and signaling of GHS-R1a. First, GHS-R1b facilitates GHS-R1a trafficking to the plasma membrane with an efficiency that depends on a specific relative GHS-R1b/GHS-R1a expression ratio. With further increases in the GHS-R1b/GHS-R1a expression ratio, this facilitation declines and disappears. Thus, higher and probably non-physiological amounts of GHS-R1b seem to be necessary to promote intracellular retention of GHS-R1a (6, 7). Second, GHS-R1b impairs GHS-R1a signaling upon oligomerization at the plasma membrane. The correlation between the results obtained with biotinylation and signaling experiments in HEK-293T cells demonstrates that the main factor determining the potency of ghrelin-induced signaling is the stoichiometric relationship of both proteins in the plasma membrane. Therefore, GHS-R1b can act as a dual modulator of GHS-R1a function: low relative GHS-R1b expression potentiates and high relative GHS-R1b expression inhibits GHS-R1a function by facilitating GHS-R1a trafficking to the plasma membrane and by exerting a negative allosteric effect on GHS-R1a signaling, respectively. The ability of GHS-R1a homodimers to oligomerize with one or several (at least two) GHS-R1b protein molecules provides a frame for oligomerization to be involved in this fine-tuning, stoichiometry-dependent modulation of GHS-R1a function. Because GHS-R1a seems to be the minimal functional unit (19), one possible scenario is that one GHS-R1b molecule per one GHS-R1a homodimer facilitates trafficking but not a negative allosteric modulation of ghrelin, whereas two (or more) GHS-R1b molecules would not facilitate trafficking but would allosterically decrease ghrelin-mediated signaling.
To our knowledge, this is the first study that addresses the modulatory role of GHS-R1b on GHS-R1a signaling in primary neurons in culture that offers a more physiological model than previously used mammalian transfected cell lines. The results first indicate that endogenous relative expression of GHS-R1a and GHS-R1b are in the same range in primary neuronal cultures that in our experiments in HEK-293T transfected cells. Significantly, from the experiments in HEK-293T cells, predictable changes in ghrelin-induced signaling were demonstrated in striatal and hippocampal neurons in culture upon varying the relative levels of expression of GHS-R1b. Progressively increasing the expression of GHS-R1b in hippocampal and striatal cell cultures led to an increase and decrease in ghrelin-induced signaling, respectively, that depended on a respective initially low and high relative GHS-R1a/GHS-R1b expression ratio.
In isolation, the GHS-R1a receptor has been shown to couple to Gq proteins, resulting in activation of phospholipase C, inositol 1,4,5-trisphosphate, and Ca2+ mobilization (5, 19, 20), but it has also been reported to produce signaling dependent on pertussis toxin-sensitive Gi/o proteins (21, 22). Thus, ghrelin seems to be able to activate different signaling pathways in a tissue-specific manner. In pituitary GH cells, GHS-R1a seems to couple preferentially to Gq, leading to stimulation of GH release, whereas, in islet pancreatic β cells, it couples to Gi/o proteins, and its activation leads to inhibition of insulin release (23). It has also been reported that ghrelin can produce cAMP-PKA signaling, although this is generally not attributed to its canonically dependent stimulatory Gs protein (24–26). The use of selective G protein toxins and inhibitors demonstrated a preferential Gi/o coupling of the GHS-R1a-GHS-R1b complex in HEK-293T cells and, unexpectedly, a preferential Gs/olf coupling in both striatal and hippocampal neurons in culture. In HEK-293T cells, the same modulation by GHS-R1b was observed for GHS-R1a-mediated inhibition of adenylyl cyclase, β arrestin-2 recruitment, ERK1/2 phosphorylation, and cytosolic Ca2+ increase. Although a canonical Gq-coupled signaling, cytosolic Ca2+ increase can also be induced by Gi-associated βγ-dependent mechanisms, as demonstrated in several mammalian cell lines, including HEK-293 cells (27, 28). ERK1/2 phosphorylation could then depend on a downstream effect of cytosolic Ca2+ increase or β arrestin-2 recruitment (28, 29).
This study demonstrates that oligomerization with GHS-R1b confers the GHS-R1a-GHS-R1b complex the ability to heteromerize with D1R, allowing ghrelin to signal through Gs/olf. Thus, in HEK-293T cells transfected with GHS-R1a and GHS-R1b, co-transfection of D1R promoted a switch of ghrelin-mediated signaling from Gi/o to Gs/olf signaling. A previous study on transfected HEK-293 cells suggested that GHS-R1a can heteromerize and functionally interact with D1R but apparently without concomitant interaction with GHS-R1b. The same study also suggested that, within the GHS-R1a-D1R heteromer, ghrelin amplifies D1R signaling (17). A more recent study by the same research group also suggests that GHS-R1a-D1R heteromerization allows D1R to couple and signal through Gq proteins, again without the involvement of GHS-R1b (18). However, our BRET experiments show that GHS-R1a-D1R heteromerization depends on the presence of GHS-R1b in the complex. In cells co-transfected with D1R, GHS-R1a, and GHS-R1b, ghrelin (maximal effective concentration) does not potentiate and, if anything, decreases cAMP accumulation induced by SKF81297. Furthermore, a significant cross-antagonism, a common biochemical property of receptor heteromers, was also observed. This is the ability of an antagonist of one of the protomers to counteract the signaling induced by an agonist of the other protomer in a receptor heteromer (13). In cells transfected with GHS-R1a, GHS-R1b, and D1R, both the D1R antagonist SCH23390 and the GHS-R1a antagonist YIL781 were able to block both SKF81297- and ghrelin-induced cAMP increases. The cross-antagonism of SCH23390 on ghrelin-induced cAMP accumulation was also observed in striatal but not in hippocampal cells in culture. Furthermore, ghrelin-induced cAMP accumulation in striatal cells was dependent on the relative expression of GHS-R1b. The total correlation among the results obtained in HEK-293T and striatal cells indicates the presence of the same D1R-GHS-R1a-GHS-R1b complexes in striatal cells. In the hippocampus, although evidence for molecular and functional interactions between hippocampal GHS-R1a and D1R have been reported recently (18), receptors other than D1R might be responsible for coupling GHS-R1a-GHS-R1b heteromers to Gs-olf protein, suggesting that different complexes containing GHS-R1a-GHS-R1b heteromers can be differentially expressed in the brain.
In summary, GHS-R1b plays a much more active and complex role in ghrelin-induced signaling than previously assumed. This study indicates that the relative expression of GHS-R1b not only determines the efficacy of ghrelin-induced, GHS-R1a-mediated signaling but also determines the ability of GHS-R1a to form oligomeric complexes with other receptors, promoting profound qualitative changes in ghrelin-induced signaling.
Author Contributions
G. M., D. A., E. A., M. M., and E. M. performed the experiments and analyzed the data. G. N., D. A., J. M., A. C., E. I. C., V. C., P. J. M., C. L., and S. F. designed the experiments. G. M., C. L., and S. F. wrote the manuscript.
Acknowledgment
We thank Jasmina Jiménez for technical assistance.
This work was supported by Spanish Ministerio de Ciencia y Tecnología Grant SAF2011-23813, government of Catalonia Grant 2014-SGR-1236, Centro de Investigación Biomédica en Red sobre Enfermedades Neurodegenerativas Grant CB06/05/0064, and intramural funds of the National Institute on Drug Abuse. The authors declare that they have no conflicts of interest with the contents of this article.
- GHS
- growth hormone secretagogue
- D1R
- dopamine D1 receptor
- BRET
- bioluminescence resonance energy transfer
- SRET
- sequence resonance energy transfer
- DMR
- dynamic mass redistribution
- PTX
- pertussis toxin
- CTX
- cholera toxin
- ANOVA
- analysis of variance
- mBU
- milliBRET unit
- mSU
- milliSRET unit.
References
- 1. Silver R., and Balsam P. (2010) Oscillators entrained by food and the emergence of anticipatory timing behaviors. Sleep Biol. Rhythms 8, 120–136 [DOI] [PMC free article] [PubMed] [Google Scholar]
- 2. Mason B. L., Wang Q., and Zigman J. M. (2014) The central nervous system sites mediating the orexigenic actions of ghrelin. Annu. Rev. Physiol. 76, 519–533 [DOI] [PMC free article] [PubMed] [Google Scholar]
- 3. Andrews Z. B. (2011) The extra-hypothalamic actions of ghrelin on neuronal function. Trends Neurosci. 34, 31–40 [DOI] [PubMed] [Google Scholar]
- 4. Jang J. K., Kim W. Y., Cho B. R., Lee J. W., and Kim J. H. (2013) Microinjection of ghrelin in the nucleus accumbens core enhances locomotor activity induced by cocaine. Behav. Brain. Res. 248, 7–11 [DOI] [PubMed] [Google Scholar]
- 5. Mary S., Fehrentz J. A., Damian M., Gaibelet G., Orcel H., Verdié P., Mouillac B., Martinez J., Marie J., and Banères J. L. (2013) Heterodimerization with its splice variant blocks the ghrelin receptor 1a in a non-signaling conformation: a study with a purified heterodimer assembled into lipid discs. J. Biol. Chem. 288, 24656–24665 [DOI] [PMC free article] [PubMed] [Google Scholar]
- 6. Leung P. K., Chow K. B., Lau P. N., Chu K. M., Chan C. B., Cheng C. H., and Wise H. (2007) The truncated ghrelin receptor polypeptide (GHS-R1b) acts as a dominant-negative mutant of the ghrelin receptor. Cell Signal. 19, 1011–1022 [DOI] [PubMed] [Google Scholar]
- 7. Chow K. B., Sun J., Chu K. M., Tai Cheung W., Cheng C. H., and Wise H. (2012) The truncated ghrelin receptor polypeptide (GHS-R1b) is localized in the endoplasmic reticulum where it forms heterodimers with ghrelin receptors (GHS-R1a) to attenuate their cell surface expression. Mol. Cell. Endocrinol. 348, 247–254 [DOI] [PubMed] [Google Scholar]
- 8. Hradsky J., Mikhaylova M., Karpova A., Kreutz M. R., and Zuschratter W. (2013) Super-resolution microscopy of the neuronal calcium-binding proteins Calneuron-1 and Caldendrin. Methods Mol. Biol. 963, 147–169 [DOI] [PubMed] [Google Scholar]
- 9. Ciruela F., Soloviev M. M., and McIlhinney R. A. (1999) Cell surface expression of the metabotropic glutamate receptor type 1α is regulated by the C-terminal tail. FEBS Lett. 448, 91–94 [DOI] [PubMed] [Google Scholar]
- 10. Chen T. W., Wardill T. J., Sun Y., Pulver S. R., Renninger S. L., Baohan A., Schreiter E. R., Kerr R. A., Orger M. B., Jayaraman V., Looger L. L., Svoboda K., and Kim D. S. (2013) Ultrasensitive fluorescent proteins for imaging neuronal activity. Nature 499, 295–300 [DOI] [PMC free article] [PubMed] [Google Scholar]
- 11. Zimmermann T., Rietdorf J., Girod A., Georget V., and Pepperkok R. (2002) Spectral imaging and linear un-mixing enables improved FRET efficiency with a novel GFP2-YFP FRET pair. FEBS Lett. 531, 245–249 [DOI] [PubMed] [Google Scholar]
- 12. Schröder R., Schmidt J., Blättermann S., Peters L., Janssen N., Grundmann M., Seemann W., Kaufel D., Merten N., Drewke C., Gomeza J., Milligan G., Mohr K., and Kostenis E. (2011) Applying label-free dynamic mass redistribution technology to frame signaling of G protein-coupled receptors noninvasively in living cells. Nat. Protoc. 6, 1748–1760 [DOI] [PubMed] [Google Scholar]
- 13. Ferré S., Casadó V., Devi L. A., Filizola M., Jockers R., Lohse M. J., Milligan G., Pin J. P., and Guitart X (2014) G protein-coupled receptor oligomerization revisited: functional and pharmacological perspectives. Pharmacol. Rev. 66, 413–434 [DOI] [PMC free article] [PubMed] [Google Scholar]
- 14. Carriba P., Navarro G., Ciruela F., Ferré S., Casadó V., Agnati L., Cortés A., Mallol J., Fuxe K., Canela E. I., Lluís C., and Franco R. (2008) Detection of heteromerization of more than two proteins by sequential BRET-FRET. Nat. Methods 5, 727–733 [DOI] [PubMed] [Google Scholar]
- 15. Guitart X., Navarro G., Moreno E., Yano H., Cai N. S., Sánchez-Soto M., Kumar-Barodia S., Naidu Y. T., Mallol J., Cortés A., Lluís C., Canela E. I., Casadó V., McCormick P. J., and Ferré S. (2014) Functional selectivity of allosteric interactions within G protein-coupled receptor oligomers: the dopamine D1-D3 receptor heterotetramer. Mol. Pharmacol. 86, 417–429 [DOI] [PMC free article] [PubMed] [Google Scholar]
- 16. Bonaventura J., Navarro G., Casadó-Anguera V., Azdad K., Rea W., Moreno E., Brugarolas M., Mallol J., Canela E. I., Lluís C., Cortés A., Volkow N. D., Schiffmann S. N., Ferré S., and Casadó V. (2015) Allosteric interactions between agonists and antagonists within the adenosine A2A receptor-dopamine D2 receptor heterotetramer. Proc. Natl. Acad. Sci. U.S.A. 112, E3609–E3618 [DOI] [PMC free article] [PubMed] [Google Scholar]
- 17. Jiang H., Betancourt L., and Smith R. G. (2006) Ghrelin amplifies dopamine signaling by cross talk involving formation of growth hormone secretagogue receptor/dopamine receptor subtype 1 heterodimers. Mol. Endocrinol. 20, 1772–1785 [DOI] [PubMed] [Google Scholar]
- 18. Kern A., Mavrikaki M., Ullrich C., Albarran-Zeckler R., Brantley A. F., and Smith R. G. (2015) Hippocampal dopamine/DRD1 signaling dependent on the Ghrelin receptor. Cell 163, 1176–1190 [DOI] [PMC free article] [PubMed] [Google Scholar]
- 19. Damian M., Mary S., Maingot M., M'Kadmi C., Gagne D., Leyris J. P., Denoyelle S., Gaibelet G., Gavara L., Garcia de Souza Costa M., Perahia D., Trinquet E., Mouillac B., Galandrin S., Galès C., Fehrentz J. A., Floquet N., Martinez J., Marie J., and Banères J. L. (2015) Ghrelin receptor conformational dynamics regulate the transition from a preassembled to an active receptor:Gq complex. Proc. Natl. Acad. Sci. U.S.A. 112, 1601–1606 [DOI] [PMC free article] [PubMed] [Google Scholar]
- 20. Holst B., Brandt E., Bach A., Heding A., and Schwartz T. W. (2005) Nonpeptide and peptide growth hormone secretagogues act both as ghrelin receptor agonist and as positive or negative allosteric modulators of ghrelin signaling. Mol. Endocrinol. 19, 2400–2411 [DOI] [PubMed] [Google Scholar]
- 21. Dezaki K., Kakei M., and Yada T. (2007) Ghrelin uses Galphai2 and activates voltage-dependent K+ channels to attenuate glucose-induced Ca2+ signaling and insulin release in islet β-cells: novel signal transduction of ghrelin. Diabetes 56, 2319–2327 [DOI] [PubMed] [Google Scholar]
- 22. Bennett K. A., Langmead C. J., Wise A., and Milligan G. (2009) Growth hormone secretagogues and growth hormone releasing peptides act as orthosteric super-agonists but not allosteric regulators for activation of the G protein Gαo1 by the Ghrelin receptor. Mol. Pharmacol. 76, 802–811 [DOI] [PMC free article] [PubMed] [Google Scholar]
- 23. Dezaki K. (2013) Ghrelin function in insulin release and glucose metabolism. Endocr. Dev. 25, 135–143 [DOI] [PubMed] [Google Scholar]
- 24. Malagón M. M., Luque R. M., Ruiz-Guerrero E., Rodríguez-Pacheco F., García-Navarro S., Casanueva F. F., Gracia-Navarro F., and Castaño J. P. (2003) Intracellular signaling mechanisms mediating ghrelin-stimulated growth hormone release in somatotropes. Endocrinology 144, 5372–5380 [DOI] [PubMed] [Google Scholar]
- 25. Cuellar J. N., and Isokawa M. (2011) Ghrelin-induced activation of cAMP signal transduction and its negative regulation by endocannabinoids in the hippocampus. Neuropharmacology 60, 842–851 [DOI] [PMC free article] [PubMed] [Google Scholar]
- 26. Sun Y., Shi N., Li H., Liu K., Zhang Y., Chen W., and Sun X. (2014) Ghrelin suppresses Purkinje neuron P-type Ca2+ channels via growth hormone secretagogue type 1a receptor, the βγ subunits of Go-protein, and protein kinase a pathway. Cell Signal. 26, 2530–2538 [DOI] [PubMed] [Google Scholar]
- 27. Dorn G. W. 2nd, Oswald K. J., McCluskey T. S., Kuhel D. G., and Liggett S. B. (1997) α 2A-adrenergic receptor stimulated calcium release is transduced by Gi-associated Gβγ-mediated activation of phospholipase C. Biochemistry 36, 6415–6423 [DOI] [PubMed] [Google Scholar]
- 28. Della Rocca G. J., van Biesen T., Daaka Y., Luttrell D. K., Luttrell L. M., and Lefkowitz R. J. (1997) Ras-dependent mitogen-activated protein kinase activation by G protein-coupled receptors. Convergence of Gi- and Gq-mediated pathways on calcium/calmodulin, Pyk2, and Src kinase. J. Biol. Chem. 272, 19125–19132 [DOI] [PubMed] [Google Scholar]
- 29. Kovacs J. J., Hara M. R., Davenport C. L., Kim J., and Lefkowitz R. J. (2009) Arrestin development: emerging roles for β-arrestins in developmental signaling pathways. Dev. Cell 17, 443–458 [DOI] [PMC free article] [PubMed] [Google Scholar]