

Abstract
Many cancer cells depend on glutamine as they use the glutaminolysis pathway to generate building blocks and energy for anabolic purposes. As a result, glutamine transporters are essential for cancer growth and are potential targets for cancer chemotherapy with ASCT2 (SLC1A5) being investigated most intensively. Here we show that HeLa epithelial cervical cancer cells and 143B osteosarcoma cells express a set of glutamine transporters including SNAT1 (SLC38A1), SNAT2 (SLC38A2), SNAT4 (SLC38A4), LAT1 (SLC7A5), and ASCT2 (SLC1A5). Net glutamine uptake did not depend on ASCT2 but required expression of SNAT1 and SNAT2. Deletion of ASCT2 did not reduce cell growth but caused an amino acid starvation response and up-regulation of SNAT1 to replace ASCT2 functionally. Silencing of GCN2 in the ASCT2(−/−) background reduced cell growth, showing that a combined targeted approach would inhibit growth of glutamine-dependent cancer cells.
Keywords: amino acid transport, cell growth, glutamine, mammalian target of rapamycin (mTOR), membrane transport
Introduction
Differentiated, non-dividing cells generate energy by metabolizing nutrients via the TCA2 cycle and respiratory chain, resulting in the production of carbon dioxide and water (1). Synthesis of macromolecules is limited to essential turnover of proteins and polynucleotides. Rapidly dividing cells, by contrast, synthesize significant amounts of protein, DNA, RNA, and membrane lipids de novo. Synthesis of these compounds withdraws large amounts of metabolites from metabolic pathways. Cyclic pathways, such as the TCA cycle, are very sensitive to withdrawal of metabolites because depletion of TCA cycle intermediates will render the cycle non-functional and compromise the capacity to generate energy (2). Linear pathways, by contrast, increase the flow-through to adapt to high metabolic demand. Converting the TCA cycle into a linear pathway is of considerable advantage to rapidly dividing cells, such as cancer cells, activated lymphocytes, and stem cells. This linearized version of the TCA cycle has been termed glutaminolysis, allowing generation of energy and metabolic building blocks (2, 3). Glutamine, the starting substrate of this pathway, is imported by the cell and deaminated to glutamate. Glutamate is converted into 2-oxoglutarate by glutamate dehydrogenase or by a transaminase reaction. After going through several steps of the TCA cycle, malate or oxaloacetate is produced. Oxaloacetate can be converted into aspartate, which is a major precursor for nucleotide biosynthesis. Both oxaloacetate and malate can also be converted into pyruvate, which can be used to generate alanine, lactate, or acetyl-CoA. As a result, many cancer cells depend on glutamine unless they express glutamine synthetase (4). It is worth noting that glutaminolysis through the conversion of 2-oxoglutarate to oxaloacetate produces two NADH, one FADH, and one GTP and therefore provides the cell with significant energy. Activation of the glutaminolysis pathway in cancer cells is accompanied by a reduced entry of pyruvate into the TCA cycle (5).
The adaptation of metabolism to cellular growth is associated with transcription factors MYC and HIF, both of which are up-regulated in many cancer cells (6, 7). In contrast to differentiated cells, expression of glutamine transporters is essential for fast growing cells. Overexpression of MYC is associated with the induction of ASCT2 (SLC1A5) (8), a glutamine transporter highly expressed in many cancer cells (9). As a result, ASCT2 is generally considered to mediate the entry of glutamine to the glutaminolysis pathway (e.g. Refs. 10 and 11). In addition, ASCT2 is often expressed together with 4F2hc/LAT1 (SLC3A2/SLC7A5), a heteromeric antiporter that exchanges large neutral amino acids. Both transporters have been implicated in cancer growth and mTOR signaling in many studies (e.g. Refs. 12 and 13). It has been proposed that ASCT2 takes up glutamine, which then acts as an exchange substrate to accumulate leucine via 4F2hc/LAT1 (10). This proposal is problematic as ASCT2 is also an obligatory amino acid exchanger for small neutral amino acids and does not mediate net uptake of glutamine unless other amino acids are available for release (14). Moreover, glutamine is not a good intracellular exchange substrate for 4F2hc/LAT1 (15). Thus, expression of a net transporter for neutral amino acids is likely to be important for cell growth.
Net neutral amino acid transporters are found in the SLC38 family of sodium-neutral amino acid transporters (SNAT) (16). The family is subdivided into two groups, namely system A amino acid transporters and system N amino acid transporters. System A amino acid transporters (SNAT1 (SLC38A1), SNAT2 (SLC38A2), and SNAT4 (SLC38A4)) are Na+-neutral amino acid cotransporters transporting a wide variety of small neutral amino acids, whereas system N transporters (SNAT3 (SLC38A1), SNAT5 (SLC38A5), and SNAT8 (SLC38A8)) are more substrate-specific, preferring glutamine, asparagine, and histidine (16). Functionally, system N transporters are characterized by their tolerance to Na+ replacement by Li+, whereas system A transporters are sensitive to inhibition by the amino acid analogue N-methylaminoisobutyric acid (MeAIB). SNAT5 has been shown to be activated by MYC, but its contribution to glutamine uptake in cancer cells has not been studied (17). Here we demonstrate that system A (SNAT1 and SNAT2) activity is essential to mediate net glutamine uptake and glutaminolysis in cancer cell lines, whereas ASCT2 and LAT1 harmonize intracellular amino acid pools. We thus propose a unified model of amino acid homeostasis in cancer cells.
Experimental Procedures
Cell Lines and Cell Culture
Human cervical adenocarcinoma epithelial cells (HeLa) and human thymidine kinase-negative osteosarcoma cells 143B (TK−) (a gift from Dr. David Tscharke (Research School of Biology, The Australian National University)) were cultured in DMEM/Ham's F-12 (Sigma D8437) containing 10% fetal bovine serum (FBS; Life Technologies) at 37 °C in a humidified atmosphere of 5% CO2 in air. For subculturing, cells were detached by trypsinization (0.25% trypsin, EDTA; Gibco). Cell counting was performed using a Scepter cell counter (Millipore) or a hemocytometer. All complete media for maintaining cells were supplemented with 2 mm l-glutamine (Gibco). Cell viability after trypsinization was generally ≥95% as evaluated by trypan blue exclusion.
Growth Assays
To eliminate effects of serum-derived trace glutamine, dialyzed FBS was used (Sigma). For growth assays, HeLa and 143B cells were seeded into 96-well culture plates at a density of 4,000–5,000 cells/well and kept initially in DMEM/Ham's F-12, 10% dialyzed FBS without glutamine. After 4 h, the medium was replaced with the desired test solutions, and cell proliferation was measured using an IncuCyte system (Essen BioScience). IncuCyte data are shown as cell confluence (mean ± S.E.) at set intervals.
Amino Acid Flux Assays
All uptake assays were performed in a water bath at 37 °C as described (15) with some modifications. Briefly, cells were grown to confluence in 35-mm Petri dishes. For Na+-dependent transport, Hanks' balanced salt solution (136.6 mm NaCl, 5.4 mm KCl, 2.7 mm Na2HPO4, 1.3 mm CaCl2, 0.5 mm MgCl2, 0.44 mm KH2PO4, 0.41 mm MgSO4, 5 mm HEPES, pH 7.5) supplemented with 5 mm glucose was used. For Na+-independent transport, NaCl was substituted with N-methyl-d-glucamine chloride or LiCl, and sodium phosphate was substituted with potassium phosphate. l-[U-14C]glutamine (1.85 MBq/ml, 9.26 GBq/mmol; PerkinElmer Life Sciences) was used at ∼2,000 dpm/nmol with unlabeled l-glutamine adjusted to 100 μm final concentration. Transport rates were normalized to cell-derived protein content measured by Bradford reagent (Sigma). Uptake rates were expressed as mean ± S.D., and differences were evaluated by analysis of variance.
Metabolomics
Labeling of metabolite pools derived from [13C5]glutamine was carried out as described (18) with some modifications. 143B cells were labeled in the presence of 4 mm [13C5]glutamine for 1 or 24 h in otherwise glutamine-free DMEM/Ham's F-12 supplemented with 10% dialyzed FBS. After the labeling period, medium was aspirated, and 1 ml of deionized water was added to the cells. After swirling briefly, the water was removed, and cells were covered with liquid nitrogen. Once the liquid nitrogen had evaporated, 600 μl of ice-cold CH3OH:CHCl3 (9:1) (supplemented with 1 mm ribitol) was added and incubated for 10 min. The cells were scraped together, transferred into microcentrifuge tubes, and incubated for an additional 5 min at 4 °C. The extracts were centrifuged at 4 °C for 5 min at 16,100 × g, and the supernatant was transferred into a fresh 1.5-ml tube. Samples were sent on dry ice to Metabolomics Australia (Parkville, Victoria, Australia) for analysis.
High Performance Liquid Chromatography (HPLC)
The HPLC system consisted of a Dionex UltiMateTM 3000 UHPLC in line with a fluorescence FLD-3400 detector. To measure amino acid consumption over time, 143B cells were grown initially in 35- or 60-mm dishes and maintained in complete culture medium in the tissue culture incubator until grown to full confluence. Before starting the experiment, the cells were washed thrice in Hanks' balanced salt solution, pH 7.4, containing 5 mm d-glucose and 0.024 mm NaHCO3. Cells were then incubated for 5 h in the same buffer containing 0.2 mm glutamine. Supernates were sampled at 0, 2, and 4 or 5 h; cleared by centrifugation; and freeze-dried overnight. Dried samples were resuspended in 100 μl of 50 mm NaHCO3, pH 9.0. Benzylserine (3 μl 1 mm) was added as an internal standard, and 10 μl of 2,4,6-trinitrobenzenesulfonic acid (10 mm in CH3OH) was added for amino acid derivatization. Subsequently, samples were incubated for 2 h at 37 °C, and 10 μl was injected for analysis. Samples were eluted off a Kinetex 1.7-μm C18 (2.1 × 100-mm) column at 35 °C. The mobile phase consisted of 100 mm ammonium acetate, pH 7.0 (solvent A) and acetonitrile (solvent B). The gradient was A/B = 90/10% at 0 min increasing to 50/50% after 10 min and to 100% B after 12 min. Eluents were detected at λ = 335 nm. Standard curves were generated for amino acids of interest by varying the injection volume and integrating the corresponding peak areas.
Reverse Transcription-PCR
A NucleoSpin RNAII kit (Macherey-Nagel) was used to isolate total RNA from cells according to the manufacturer's instructions. RNA concentration was quantified by a NanoDrop spectrophotometer (Thermo Fisher Scientific). RNA was reverse transcribed to cDNA using a SuperScript II reverse transcriptase kit (Invitrogen). The cDNA of interest was amplified using Taq polymerase (Qiagen) using serial dilutions of the template to optimize semiquantitative analysis. PCR primer sequences are available on request.
RNA Silencing
Low passages (<20) of 143B cells were grown in DMEM/Ham's F-12 supplemented with 10% FBS and 2 mm glutamine (total concentration, 4 mm). On the day before transfection, cells were split and seeded out in 35-mm cell culture dishes at 150,000–300,000 cells. Immediately before transfection, the medium was renewed. For transfection (all volumes per dish) 4 μl of Lipofectamine RNAiMAX (Life Technologies) was combined with 250 μl of Opti-MEM (Life Technologies), and separately 30 pmol of RNAi construct (Ambion Silencer Select predesigned siRNAs as listed in Table 1) was combined with 250 μl of Opti-MEM. Both solutions were combined after 5 min and incubated for a further 20–30 min at room temperature before adding the transfection complexes dropwise to the cells. All transfections were performed in triplicates. Transfected cells were incubated at 37 °C and 5% CO2 for 4–6 h after which the medium was replaced with fresh DMEM/Ham's F-12, 10% FBS, 2 mm glutamine. Transport or Western blotting analyses were performed after 48 h unless stated otherwise.
TABLE 1.
siRNA constructs used in this study
Application is outlined under “Experimental Procedures.”
| Protein target | Target gene transcript | Origin |
|---|---|---|
| hASCT2 | SLC1A5 | Ambion ID s12916 |
| hSNAT1 | SLC38A1 | Ambion ID s37592 |
| hSNAT2 | SLC38A2 | Ambion ID s632 |
| hSNAT4 | SLC38A4 | Ambion ID s30145 |
| hEIF2AK4 | GCN2 | Ambion ID s54069 |
| Universal Mission Negative control number 1 | Scrambled | Sigma |
Genomic Mutation of the ASCT2 (Slc1a5) Gene
A commercial CRISPR/Cas9 system was used (Sigma). The construct U6gRNA-pCMV-Cas9–2A-GFP contains a 22-bp guide RNA (cctcgaagcagtcaacctcccg), resulting in cleavage/repair of the Slc1a5 gene in exon 7. An endotoxin-free preparation (Macherey and Nagel) of the plasmid was used for transfection of 143B cells maintained in DMEM/Ham's F-12, 10% FBS, 2 mm glutamine. Cells were split and seeded out in a 60-mm dish to reach 40% confluence on the day before transfection. Immediately before transfection, the cells were replenished with fresh DMEM/Ham's F-12, 10% FCS, 2 mm glutamine. Plasmid DNA (4 μg) and 10 μl of Lipofectamine 2000 (Invitrogen) were separately incubated in 500 μl of Opti-MEM (Invitrogen) for 5 min at room temperature before combining them and incubating for a further 20–30 min at room temperature to form complexes. The complexes were then added dropwise to the cells and placed in an incubator at 37 °C in 5% CO2 followed by a medium change after 4–6 h. After 48 h of expression, cells were trypsinized (0.25% trypsin, EDTA (Invitrogen)) and collected by centrifugation (500 × g) followed by three washes in Dulbecco's phosphate-buffered saline supplemented with 5 mm glucose and 1% dialyzed FBS (Sigma). Cells were then passed through a cell strainer (70 μm; Corning), centrifuged, and suspended in PBS supplemented with 5 mm glucose and 1% dialyzed FBS. Single cell sorting was performed using an ARIA II FACS machine (FACS Facility, The Australian National University) with GFP intensity set at two different levels. Single cells were collected in 96-well plates containing DMEM/Ham's F-12, 10% FBS, 2 mm glutamine and incubated for up to 3 weeks at 37 °C in 5%CO2. Established clones were trypsinized and seeded into 25-cm2 cell culture flasks (Corning) for further propagation. A compound heterozygote mutation of human ASCT2 at the target site was identified by sequencing.
Membrane Protein Preparation and Surface Biotinylation
Cells were grown on 100-mm dishes and washed thrice in 10 ml of ice-cold PBS. Cells were collected and spun down for 5 min at 500 × g. The supernatant was replaced by 5 ml of hypoosmotic buffer (15 mm KCl, 2 mm MgCl2, 0.1 mm EDTA, 10 mm HEPES, pH 8.0), and the cells were resuspended by mixing. After incubation on ice for 5 min, membranes were ruptured by 35 strokes in a Potter homogenizer. Debris and nuclei were removed by centrifugation at 2,000 × g for 10 min. Membranes were isolated from the supernatant by centrifugation at 180,000 × g at 4 °C for 60 min. Pellets were resuspended in 200 μl of 5 mm glycine.
For surface biotinylation, cells were grown on 100-mm dishes and washed thrice in 10 ml of modified PBS (supplemented with 1 mm CaCl2, 1 mm MgCl2, pH 8.0). Cells were then covered with 0.5 mg/ml EZ-Link sulfo-NHS-LC-biotin (Thermo Fisher Scientific) in modified PBS, pH 8.0, and incubated for 45 min at room temperature on a rotary shaker at low speed. Biotinylation was terminated by washing thrice in modified PBS supplemented with 100 mm glycine, pH 8.0. Cells were scraped together, transferred to a 1.5-ml reaction tube, and lysed by addition of 1 ml of 150 mm NaCl, 1% Triton X-100, 20 mm Tris·HCl, pH 7.5. The homogenate was incubated on ice for 1.5 h to complete lysis. Subsequently, the homogenate was centrifuged at 13,500 × g in a table top centrifuge for 10 min, and the supernatant was transferred to a new tube. After protein determination, equal amounts of protein homogenate were added to 150 μl of high capacity streptavidin-agarose beads. The beads were incubated overnight at 4 °C on a rotary shaker before washing four times in lysis buffer. The streptavidin-agarose slurry was mixed with protein sample buffer and sample reducing reagent. After boiling for 5min, a 40-μl sample was loaded onto polyacrylamide gels.
SDS-PAGE and Western Blotting
For protein extraction, cells were lysed in radioimmune precipitation assay protein extraction buffer (Sigma) supplemented with protease inhibitor mixture (EDTA-free; Roche Applied Science). After homogenization, samples were centrifuged at 16,000 × g for 10 min. Total soluble proteins from the supernates were measured using the Bradford reagent using bovine serum albumin as a standard.
To prepare protein samples for SDS-PAGE, 50–100 μg of total protein was mixed with 5 μl of 4× lithium dodecyl sulfate sample buffer (Invitrogen) and 2 μl of reducing agent (Invitrogen) and made up to 20 μl using Milli-Q water. Samples were then incubated at 70 °C for 10 min before loading onto the gel. Electrophoresis was performed using 4–12% Bis-Tris polyacrylamide NuPAGE® gels (Invitrogen) electrophoresed in an XCell SureLock® Mini-Cell (Invitrogen) under reducing conditions according to standard manufacturer procedures. The SeeBlue Plus 2 prestained protein ladder (Invitrogen) was used to estimate the apparent molecular weight of fractionated proteins.
Following SDS-PAGE, fractionated proteins were transferred onto nitrocellulose membranes (GE Healthcare) using a Mini Trans-Blot Electrophoretic Transfer Cell (Bio-Rad) according to standard protocols. Blots were blocked for 2 h at room temperature (or overnight at 4 °C) in 50 ml of 10% (w/v) skim milk in PBS with 0.15% Tween 20 (PBS-T). After washing thrice in PBS-T for 10 min each, the blots were incubated with the first antibody for 2 h or overnight in 5 ml of skim milk (2%, w/v) in PBS-T at dilutions listed in Table 2. Excess primary antibody was removed by washing three times with PBS-T. Blots were incubated with 5 ml of diluted secondary antibody for 1 h. After washing thrice in PBS-T and a final rinse in PBS, reactive bands were detected by enhanced chemiluminescence using Luminata Crescendo or Forte Western HRP Substrate (Millipore Merck). For reprobing, the same blots were incubated for 45 min at 70 °C in 50 ml of stripping buffer (62.5 mm Tris-HCl, pH 6.8, 2% SDS, 100 mm 2-mercaptoethanol). Membranes were then washed thrice with PBS-T and blocked for 3 h using 10% (w/v) skim milk in PBS-T before reprobing with the next antibody as described above.
TABLE 2.
Antibodies used in this study and their dilution
Application is outlined under “Experimental Procedures.”
| Antibodies | Company | Phosphorylation site | Dilution |
|---|---|---|---|
| Anti-ASCT2 (SLC1A5) | Cell Signaling Technology | 1:2,000–1:3,000 | |
| Anti-SNAT1 (SLC38A1) | Millipore | 1:2,000 | |
| Anti-SNAT2 (SLC38A2) | Abcam | 1:2,000 | |
| Anti-S6 | Cell Signaling Technology | 1:2,000 | |
| Anti-P-S6 | Cell Signaling Technology | Ser-240/Ser-244 | 1:1,000 |
| Anti-eIF2 | Cell Signaling Technology | 1:2,000 | |
| Anti-P-Eif2 | Cell Signaling Technology | Ser-51 | 1:1,000 |
| Anti-LAT1 | Cell Signaling Technology | 1:1,000 | |
| Anti-Na+/K+-ATPase | Abcam | 1:5,000–1:10,000 | |
| Anti-c-MYC | Santa Cruz Biotechnology | 1:200 | |
| Anti-rabbit IgG-HRP | GE Healthcare | 1:1,000–1:10,000 | |
| Anti-mouse IgG-HRP | Cell Signaling Technology | 1:1,000–1:10,000 | |
| Anti-4E-BP1 | Cell Signaling Technology | 1:3,000 | |
| Anti-P-4E-BP1 | Cell Signaling Technology | Thr-37/Thr-46 | 1:2,000 |
| Anti-p70S6 kinase | Cell Signaling Technology | 1:1,000 | |
| Anti-P-p70S6 kinase | Cell Signaling Technology | Ser-371 | 1:1,000 |
Oocyte Expression Systems and Flux Experiments
Xenopus laevis (Nasco) oocytes were isolated and maintained as described previously (19). Selected oocytes were injected with 10 ng of human ASCT2, human SNAT1, human SNAT2, or human SNAT5 cRNA and were used as described previously (20).
Growth and Statistical Analysis
Growth curves were analyzed using the Gompertz equation for cell growth, y = a × exp(−exp(k(x − xc))), or the logistic equation, y = a/(1 + exp(−k(x − xc))). For all experiments, the number of technical repeats is shown as n, and the number of biological/experimental repeats is shown as e. Unpaired t tests were performed to compare means of the combined biological repeats.
Results
Glutamine is an essential amino acid for cells that carry out the glutaminolysis pathway (3). In agreement with this metabolic phenotype, we found that growth of HeLa cells and 143B cells highly depended on glutamine. Both cell lines completely ceased growth in the absence of glutamine (data not shown). At the same time, both cell lines produced alanine, aspartate, and glutamate in a glutamine-dependent manner. For instance, 143B cells produced 4 ± 0.2 μm aspartate, 23 ± 5 μm glutamate, and 80 ± 10 μm alanine from 200 μm glutamine over 5 h. Moreover, metabolic labeling with [13C5]glutamine resulted in strong 13C enrichment of cellular glutamate, succinate, fumarate, malate, and aspartate pools (results presented further below). These results confirmed the use of the glutaminolysis pathway. Accordingly, MYC was detected in the nuclei of both cell lines (data not shown).
Having established functional glutaminolysis in both cell lines, we wondered how import of glutamine is mediated in these cells. Analysis of amino acid transporter expression by RT-PCR revealed the presence of a variety of glutamine transporters, namely ASCT2, LAT1, LAT2, SNAT1, and SNAT2. SNAT5 was detected in HeLa but not in 143B cells (Fig. 1, A and B). A separate analysis of SNAT isoforms in 143B cells showed high expression levels of SNAT1 and SNAT2 (Fig. 1C). SNAT4, SNAT7, and SNAT9 were weakly expressed and may serve roles in addition to glutamine transport. For instance, SNAT9 is a lysosomal arginine transporter involved in mTOR signaling (21, 22).
FIGURE 1.

Expression of glutamine transporters in cancer cell lines. A panel of glutamine transporter mRNAs was analyzed by RT-PCR in 143B cells (A and C) or HeLa cells (B). Glutamine transporters are listed by their common names in A and B; members of the SNAT family (C) are listed by number, i.e. SNAT1 = A1. c, clathrin; M, marker lane. D and E, uptake of 100 μm [14C]glutamine was measured in 143B (D) or HeLa cells (E) in the presence of competing amino acids or analogues (10 mm). To discriminate between Na+-dependent and Na+-independent amino acid transporters, experiments were performed in Hanks' balanced salt solution containing NaCl or its replacement LiCl or N-methyl-d-glucamine (NMDG) (n = 3, e = 3). The difference between LiCl and N-methyl-d-glucamine condition indicates a possible involvement of SNAT3 or SNAT5. Inhibition of Na+-dependent transport by MeAIB suggests participation of SNAT1 or SNAT2. Inhibition by threonine suggests involvement of ASCT2 or LAT2. Inhibition by leucine suggests involvement of LAT1 or LAT2. Complete inhibition by the combination of MeAIB, threonine, and leucine suggests that no other glutamine transporters are involved. F, inhibition of cell growth (HeLa or 143B cells as indicated) by glutamine analogue l-γ-glutamyl-hydroxamate (GHX) or l-γ-glutamyl-p-nitroanilide (GPNA) (n = 10, e = 3). G, specificity of inhibitors was tested in X. laevis oocytes expressing human isoforms of ASCT2, SNAT1, SNAT2, SNAT4, and SNAT5. Uptake was measured using 100 μm [14C]glutamine in the presence of 3 mm inhibitor (n = 10, e = 3). Error bars in panels represent S.D. BS, benzylserine.
To correlate the expression data with functional data, we analyzed glutamine uptake into HeLa and 143B cells using competition experiments. The competing amino acids and analogues were chosen to identify system A activity (MeAIB), ASCT2 activity (Thr, which is not an inhibitor of system A), and system L (Leu) in an additive manner as published previously (23). Despite the dominant mRNA expression of system A isoforms SNAT1 and SNAT2, the system A inhibitor MeAIB decreased glutamine uptake only by a small fraction (Fig. 1, D and E). Glutamine uptake was predominantly Na+-dependent, particularly in 143B cells. With the exception of system N (molecular isoforms SNAT3 and SNAT5), Na+-dependent transporters cannot use Li+ instead of Na+; thus, lithium tolerance is a good indicator of the presence of SNAT3 and SNAT5. However, replacement of NaCl by LiCl reduced glutamine uptake only slightly less than replacement by N-methyl-d-glucamine, suggesting that Li+-tolerant transporters have a limited role in glutamine uptake. As a result, glutamine transport appeared to have two broad components: a small Na+-independent and a large Na+-dependent (Li+-sensitive) component. Glutamine uptake was almost completely inhibited by 10 mm threonine, a typical ASCT2 substrate. Combining 10 mm threonine and 10 mm leucine (a typical substrate of Na+-independent system L transporters LAT1 and LAT2) reduced uptake to background levels. This profile is consistent with a contribution to glutamine transport by the Na+-independent transport system L (isoforms LAT1 and LAT2) and by the Na+-dependent transport system ASC (isoform ASCT2). Although LAT1 activity has been described in many cancer cells (24), its contribution to glutamine uptake is small because this amino acid is not a good substrate for this transporter (15). The analysis of glutamine transport can be explained by the action of three transport systems, namely system ASC (ASCT2) and smaller contributions by system L (LAT1 and LAT2) and system A (SNAT1 and SNAT2). The bulk of glutamine transport is thus mediated by obligatory antiporters, similar to transport activities described before in cancer cells (25).
To confirm that ASCT2 is indeed the dominant transport activity in both cell lines, we attempted to use known pharmacological ASCT2 inhibitors, such as benzylserine and l-γ-glutamyl-p-nitroanilide (26, 27), and the SNAT5 inhibitor l-γ-glutamylhydroxamate (28). Despite the absence of SNAT5 expression in 143B cells, l-γ-glutamylhydroxamate was effective in suppressing growth of both cell lines at concentrations >1 mm; γ-glutamyl-p-nitroanilide (Fig. 1F) and benzylserine (not shown) were less effective. This prompted us to investigate the specificity of these inhibitors using X. laevis oocytes expressing human cRNAs of ASCT2, SNAT1, -2, -4, and -5 (Fig. 1G). Surprisingly, addition of 3 mm benzylserine failed to inhibit uptake of glutamine in oocytes expressing human ASCT2. By contrast, l-γ-glutamyl-p-nitroanilide inhibited glutamine uptake via ASCT2 but also inhibited SNAT1, -2, -4, and -5. The compound l-γ-glutamylhydroxamate inhibited ASCT2, SNAT1, -4, and -5. Overall, the data suggest that these published glutamine transporter inhibitors are either ineffective or nonspecific. As a result, we decided to suppress expression of ASCT2, SNAT1, SNAT2, and SNAT4 by RNAi (Fig. 2). Silencing of ASCT2 mRNA reduced the uptake activity for glutamine by about 50% (Fig. 2A) and selectively depleted ASCT2 mRNA (Fig. 2B) and protein (Fig. 2C) (78% reduction; p = 0.0004). Silencing of ASCT2 did not change the activity of the mTOR pathway in 143B cells as ascertained by phosphorylation of ribosomal protein S6 (p > 0.05). It did, however, increase the abundance of phospho-eIF2α 26-fold (p = 0.001), consistent with eliciting an amino acid starvation response (Fig. 2C). When cultured in the presence of 4 mm glutamine, treatment of 143B cells with SNAT1, SNAT2, and SNAT4 siRNA slightly reduced transport activity without reaching significance (Fig. 2D, black bars). Silencing of SNAT1 and SNAT4 mRNA was almost complete, whereas silencing of SNAT2 mRNA was incomplete (about 50%; data not shown). However, the SNAT2 protein was barely detectable in the plasma membrane of cells maintained in complete medium (Fig. 2E). This is consistent with the well known induction of SNAT2 mRNA (Fig. 2F) and protein under amino acid depletion conditions (29) (Fig. 2E), restricting its expression in replete medium. SNAT1 showed a smaller response under amino acid depletion, whereas ASCT2 expression remained constant (Fig. 2E). Consistent with an amino acid-dependent regulation, the contribution of SNAT1 and SNAT2 to glutamine transport became more obvious and significant when cells were cultured in medium supplemented with 2 mm glutamine instead of 4 mm glutamine (Fig. 2D, gray bars). Accordingly, surface expression of SNAT1 and -2 increased when glutamine supplementation was reduced (Fig. 2G). Overall, these experiments confirmed that Na+-dependent uptake of glutamine (at a concentration of 100 μm) is dominated by ASCT2 with smaller contributions by SNAT1 and SNAT2, depending on glutamine levels.
FIGURE 2.

Silencing of ASCT2 reduces glutamine uptake and elicits an amino acid starvation signal. A, siRNA-induced ASCT2 silencing reduced uptake of 100 μm [14C]glutamine by more than 50% (n = 3, e = 4). Scrambled siRNA did not show a significant effect. nt, non-transfected. B, siRNA-induced ASCT2 silencing was specific. Apart from a reduction of 4F2hc mRNA, expression of no other amino acid transporter was affected as measured by RT-PCR (e = 3). C, siRNA-induced ASCT2 silencing was confirmed at the protein level by Western blotting. Immunodetection revealed no change of the total amount of ribosomal protein S6 and its phosphorylated form. However, an increase of P-eIF2α was observed, indicating amino acid starvation. LAT1 protein expression was slightly reduced. Actin was used as a loading control. D, specific siRNA constructs were used to evaluate the contribution of different transporters to glutamine uptake. Silencing experiments were performed in wild-type 143B cells, which were grown in DMEM/Ham's F-12 supplemented with 10% FBS and 4 mm glutamine (black bars) or 2 mm glutamine (gray bars). In the presence of 4 mm glutamine, only small contributions to glutamine uptake by SNAT1, SNAT2, and SNAT4 were observed. The contribution by SNAT1 and SNAT2 became significant when grown in the presence of 2 mm glutamine (n = 3, e = 3). E, amino acid depletion increases SNAT1 and SNAT2 expression. Surface expression of ASCT2, SNAT1, or SNAT2 was determined by immunoblotting after surface biotinylation of 143B cells grown in complete medium (+AA) or after 12-h incubation in Hanks' balanced salt solution supplemented with 5 mm glucose and 200 μm glutamine (−AA). Na+/K+-ATPase was used as a loading control (e = 3). F, quantification of transporter mRNA expression by RT-PCR after amino acid depletion. 143B cells were incubated for 12 h in Hanks' balanced salt solution containing 5 mm glucose and 200 μm glutamine to deplete internal amino acids (−AA). Transcript levels were compared with cells grown in complete medium (+AA) (e = 3). G, SNAT1 and SNAT2 surface expression is glutamine-dependent. Cells were grown in DMEM/Ham's F-12 supplemented with 10% dialyzed FBS and different concentrations of glutamine (Q). All other amino acids were present at standard medium concentrations. Surface biotinylation combined with immunoblotting was used to determine transporter abundance. Na+/K+-ATPase was used as a loading control (e = 2). Error bars in panels represent S.D. AA, amino acids.
Because silencing did not completely abolish ASCT2 protein expression in the plasma membrane, we generated an ASCT2(−/−) line through CRISPR/Cas9 methodology (Fig. 3A). Glutamine uptake was reduced by more than 60% consistent with the silencing experiments (Fig. 3B). The remaining glutamine uptake was sensitive to inhibition by MeAIB and was abolished by a combination of MeAIB and threonine. The amount of MeAIB-sensitive glutamine uptake increased significantly from 5.5 ± 0.5 nmol/(6 min × mg of protein) in the parental 143B cells to 12 ± 1 nmol/(6 min × mg of protein) in the ASCT2(−/−) cells (p = 0.002). Silencing experiments (Fig. 3C) showed that this increase was mainly mediated by SNAT1, the transport activity of which was barely detectable in the parental cell line in complete medium containing 4 mm glutamine. A similar contribution of SNAT1 was observed in medium supplemented with 2 mm glutamine (Fig. 3C, gray bars). In agreement with a higher contribution of SNAT1, a slight increase of its protein was observed in ASCT2(−/−) cells (Fig. 3A).
FIGURE 3.

Genomic mutation of ASCT2 in 143B cells. A, CRISPR/Cas9 methodology was used to mutate ASCT2, resulting in complete ablation of ASCT2 protein expression. An increase of a higher molecular weight band was observed upon immunodetection of SNAT1 in ASCT2(−/−) cells, most likely representing glycosylated SNAT1. Actin was used as a loading control. B, characterization of 100 μm [14C]glutamine uptake in ASCT2(−/−) cells using amino acids and analogues using the same principles as in Fig. 1D. Glutamine uptake was reduced by 68% when compared with parental cells (column 1 versus column 3). The fraction of glutamine uptake that was inhibited by MeAIB increased in ASCT2(−/−) cells (n = 3, e = 3), indicating an increased contribution by SNAT1/2. Glutamine transport was completely inhibited by the combination of MeAIB and Thr. 2-Aminobicyclo-(2,2,1)-heptane-2-carboxylic acid (BCH), a typical inhibitor of LAT1 and LAT2, did not affect glutamine uptake. C, silencing of SNAT1, SNAT2, and SNAT4 in ASCT2(−/−) cells grown in DMEM/Ham's F-12 supplemented with 10% FBS and 4 mm glutamine (black bars) or 2 mm glutamine (gray bars) (n = 3, e = 3). The experiment was performed under the same condition in 143B parental cells as shown in Fig. 2D. D, growth curve of parental 143B cells and ASCT2(−/−) cells when cultured in DMEM/Ham's F-12 supplemented with dialyzed FBS (10%) and the indicated concentrations of glutamine (n = 10, e = 3). E, glutamine consumption of parental 143B cells and ASCT2(−/−) cells was measured in Hanks' balanced salt solution supplemented with 5 mm glucose and 200 μm glutamine. Samples were removed from the supernatant at the indicated times for amino acid analysis (n = 3, e = 2). F, metabolism of [13C5]glutamine in parental 143B cells and ASCT2(−/−) cells was analyzed by GC-MS. Cells were grown in DMEM/Ham's F-12 supplemented with dialyzed FBS and 4 mm [13C5]glutamine. Enrichment of each metabolite is given in percent (parental/ASCT2(−/−)) (e = 3). G, silencing of glutamine transporters in 143B parental cells showed a significant increase of extracellular glutamine (reduced glutamine consumption) upon silencing of SNAT1. No further increase was observed when SNAT1 and ASCT2 were silenced in combination (n = 3, e = 3). Error bars in growth assays represent S.E.; in all other panels error bars represent S.D. OxPhos, oxidative phosphorylation.
Despite the strongly reduced glutamine uptake, we found that the growth rate of ASCT2(−/−) cells was essentially unaltered compared with the parental cells in the presence of 1 or 3 mm glutamine (Fig. 3D). Consistently, net glutamine consumption was almost the same in the parental cells and ASCT2(−/−) cells (Fig. 3E). This suggests that ASCT2 has an important role in avoiding an unloaded tRNA response but is not involved in net glutamine uptake to sustain glutaminolysis. This notion was confirmed by metabolic labeling with [13C5]glutamine. In both 143B parental cells and ASCT2(−/−) cells, metabolites of the glutaminolysis pathway were highly enriched (Fig. 3F). A second pathway that was labeled equally strongly in both cell lines was proline biosynthesis. This pathway has recently been recognized as a critical pathway for cancer cells and embryonic stem cells (30, 31) (Fig. 3F).
In agreement with a significant role of SNAT1 in net glutamine uptake, silencing of SNAT1 significantly decreased net glutamine consumption in 143B cells, whereas silencing of ASCT2 had little effect. No synergism was observed when ASCT2 and SNAT1 were silenced together (Fig. 3G). Consistent with the silencing experiments, ASCT2(−/−) cells showed unaltered mTOR signaling (Fig. 4A) as evidenced by phosphorylation of p70S6 kinase, ribosomal protein S6, and 4E-BP-1 (all p > 0.05). Moreover, they showed a 20-fold increase (p = 0.002) in eIF2α phosphorylation, indicating an unloaded tRNA response (Fig. 4A). Reduced expression of ASCT2 in heterozygous cell clones was consistently accompanied by an increased signal of P-eIF2α (p = 0.04). The unloaded tRNA response is known to increase SNAT2 expression (32), thereby compensating for the loss of ASCT2. We reasoned that blocking the unloaded tRNA response through silencing of GCN2 should block cell growth in the background of ASCT2(−/−) cells. In agreement with this notion, the growth rate of GCN2-silenced cells was reduced from k = 0.035 to k = 0.0018 (Fig. 4B). Parental 143B cells, by contrast, showed no difference in the growth curve when GCN2 mRNA was silenced (Fig. 4C) despite significant reduction of its mRNA (Fig. 4D). Silencing of SNAT1 alone reduced cell growth only slightly (Fig. 4E). This suggested a compensatory up-regulation of SNAT2, which we observed at the protein level (Fig. 4F). As mentioned above, silencing of SNAT2 mRNA was always incomplete (about 50%). To block SNAT1 and SNAT2 activity completely, we combined silencing of SNAT1 with the system A inhibitor MeAIB, which caused selective withdrawal of SNAT2, but not SNAT1, from the plasma membrane after its expression was induced by amino acid depletion (Fig. 4G) (33). The combination of both reagents drastically reduced the growth rate of 143B cells from k = 0.05 to k = 0.003 (Fig. 4E).
FIGURE 4.

Genomic mutation of ASCT2 induces amino acid starvation. A, signaling through mTOR appeared to be unchanged in ASCT2(−/−) cells as evidenced by immunoblotting of mTOR downstream targets ribosomal protein S6, p70S6 kinase, and 4E-BP-1 and their phosphorylated forms (for phosphorylation sites, see Table 2). However, an increase in phosphorylation of eIF2α was consistently observed (e = 3), indicating amino acid starvation. Actin was used as a loading control. B, silencing of GCN2 severely blunted the growth of ASCT2(−/−) cells (n = 10, e = 3) but had little effect on the growth of parental 143B cells (C) (n = 10, e = 3). D, silencing of GCN2 mRNA in 143B parental and ASCT2(−/−) cells was confirmed by RT-PCR (e = 3). E, combination of SNAT1 silencing with the SNAT1/2 inhibitor MeAIB strongly reduced cell growth in parental cells (n = 10, e = 2). F, silencing of SNAT1 abolished protein expression and induced elevated expression of SNAT2 (e = 2). Na+/K+-ATPase was used as a loading control. scr, scrambled; si, RNA silencing. G, effect of MeAIB on surface expression of SNAT1 or SNAT2 after induction of SNAT2 using 12-h incubation in Hanks' balanced salt solution, 5 mm glucose, 200 μm glutamine (−AA). Incubation of cells in complete medium is indicated as (+AA) (e = 2). Na+/K+-ATPase was used as a loading control. Error bars in growth assays represent S.E.; in all other panels error bars represent S.D. AA, amino acids.
Together, these results demonstrate a crucial role of SNAT1 in supplying glutamine for glutaminolysis with SNAT2 acting as a “backup” under conditions of amino acid depletion. Analysis of 947 cell lines (34) using Oncomine demonstrated a consistently strong expression of SNAT1, SNAT2, and ASCT2 in almost all of the analyzed cell lines (data not shown). Other glutamine transporters, such as SNAT3, SNAT4, and SNAT5, by contrast, were inconsistently expressed (data not shown). This supports a general role for SNAT1 in sustaining glutaminolysis.
Discussion
Glutamine addiction has been noted in many cancer cells and has recently been recognized as a specific metabolic adaptation to the demands of a growing cell (2, 3). Conversion of the canonical TCA cycle into the linear glutaminolysis pathway creates the demand for glutamine transporters as an essential element for glutamine-dependent cancer cells. It was recognized 10 years ago that many cancer cells up-regulate ASCT2 and LAT1 (13). As shown in this and other studies, ASCT2 and LAT1 are dominantly active transporters in many cancer cell lines (25, 35–37). Accordingly, both transporters are currently targeted to reduce cancer growth (38–40). Unfortunately, many studies assume the ability of ASCT2 to mediate net glutamine uptake (for example, see Fig. 7 in Ref. 10 or Fig. 1 in Ref. 11); moreover, inhibitors, such as benzylserine and γ-glutamyl-p-nitroanilide, that are often used to test involvement of ASCT2, are nonspecific or ineffective. We demonstrate here that ASCT2 is important for amino acid homeostasis but that SNAT1 and SNAT2 mediate net glutamine uptake for the glutaminolysis pathway. Whether SNAT1 and SNAT2 have additional effects as transceptors remains to be shown (41).
We propose a novel view of amino acid homeostasis in cancer cells that requires three different types of transporters (Fig. 5). Type 1 transporters are amino acid harmonizers. These are rapid exchangers for a group of amino acids, such as large amino acids (LAT1 and LAT2) and small amino acids (ASCT1 and ASCT2). To maintain a harmonized mixture of all 20 proteinogenic amino acids, these transporters should be faster than net uptake. Type 2 transporters are amino acid loaders that mediate net uptake of a group of amino acids including glutamine. Loaders must have at least one overlapping amino acid substrate with the harmonizers. Glutamine and alanine are ideal substrates as they are highly abundant in blood plasma and are major substrates for SNAT1. Type 3 transporters are rescue transporters. As shown here, SNAT2 mRNA is highly abundant, but under homeostatic amino acid levels, it is not translated into protein. Non-harmonized amino acid mixtures will result in uncharged tRNAs, activating GCN2 (42), which in turn will cause translation of the abundant SNAT2 mRNA by a cap-independent mechanism (32). Independently, it appears that SNAT2 protein is degraded after ubiquitination (43), and this may occur under nutrient-replete conditions but is halted when amino acids are depleted.
FIGURE 5.

Proposed model of neutral amino acid homeostasis in cancer cells. Amino acid symporters and exchangers work in combination to ensure a homeostatic intracellular mixture of all neutral amino acids. SNAT1 is a major net importer (loader) of neutral amino acids including glutamine as a substrate for glutaminolysis. Amino acid exchangers (harmonizers) quickly harmonize amino acid composition in times of imbalanced amino acid usage. An imbalance of the amino acid composition results in an amino acid starvation response, which increases SNAT2 expression (rescue). AA, amino acid.
ASCT2 silencing has been shown to induce rapid apoptosis in hepatoma cells (44) and to reduce growth of melanoma and pancreatic cancer cells (39, 40). As shown here, an ASCT2-deficient cancer cell line can display normal growth due to up-regulation of SNAT1 and SNAT2, which have overlapping substrate specificity with ASCT2. One of the differences may be that cells that are sensitive to ASCT2 inhibition show reduced mTOR signaling when ASCT2 is silenced (12). This has been proposed to involve the amino acid exchanger LAT1, exchanging intracellular glutamine imported by ASCT2 against branched-chain amino acids, which in turn would activate mTOR (10). One of the problems with this proposal is that ASCT2 also requires an exchange substrate. In addition, LAT1 has limited capacity to use intracellular glutamine as an exchange substrate (15). Activation of mTOR is mediated by cytosolic and lysosomal leucine levels and lysosomal amino acid transporters (21, 22). SNAT1 and SNAT2 proficiently provide exchange substrates to LAT1, thereby explaining the normal mTOR signaling in ASCT2(−/−) cells.
Targeting SNAT1 could have potential for the treatment of clear cell renal cell carcinoma (CCRCC). Analysis of four different sporadic CCRCC sets (45–48) using Oncomine reveals 3–5-fold higher expression of SNAT1 in tumor tissue compared with matched normal tissue (Fig. 6A). The vast majority of CCRCC is caused by biallelic mutation or inactivation of the von Hippel-Lindau tumor suppressor (49). The von Hippel-Lindau tumor suppressor protein is an adapter protein that interacts with a number of proteins, most notably targeting HIF1α for degradation by the proteasome. Inactivation of von Hippel-Lindau tumor suppressor thus increases HIF1α expression. Analysis of HIF1α target genes in CCRCC using the same data sets but also including hereditary CCRCC shows SNAT1 (SLC38A1) among well known targets, such as monocarboxylate transporter 4 (SLC16A3), lactate dehydrogenase A, and hexokinase 2 (Fig. 6B). SNAT1 expression is not only driven by HIF1α but also by other transcription factors. The ENCODE database (50) shows a strong signature of MYC binding and RNA polymerase 2 around the promoter of the SNAT1 gene Slc38a1 in K562 and HeLa cells (data not shown). Moreover, hepatocyte growth factor receptor is overexpressed in many cancers and appears to up-regulate SNAT1 gene expression through its mitogen-activated protein kinase signaling pathway (51) (Fig. 6C). This suggests that SNAT1 transport activity is an important function for many fast growing cancer cells.
FIGURE 6.
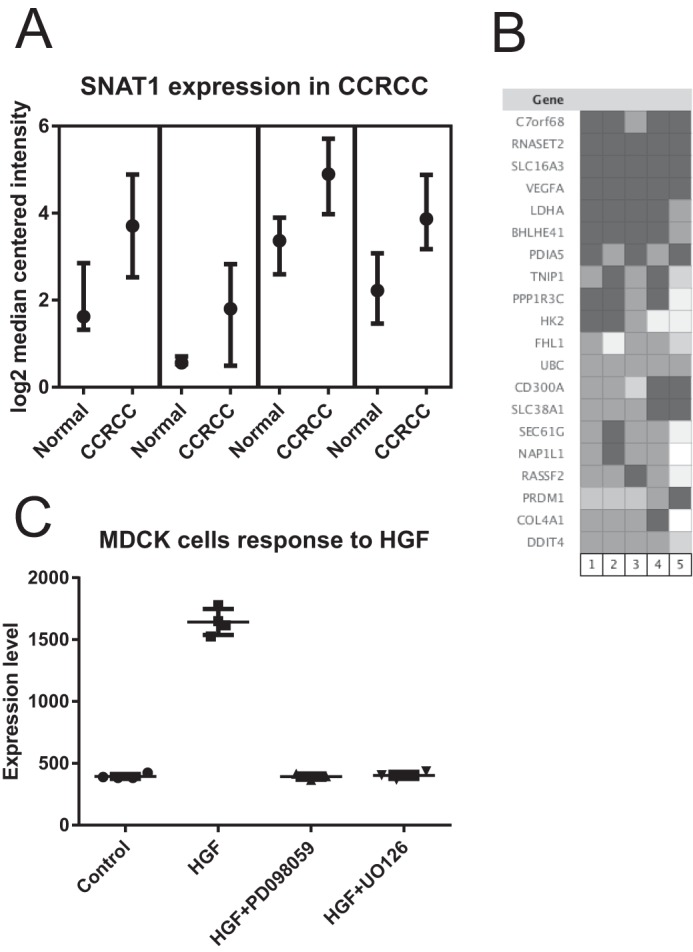
Database evaluation of SNAT1 expression in cancer tissue and cells using Oncomine. A, significantly elevated levels of SNAT1 mRNA were detected in four studies of CCRCC. Depending on the study, samples from normal adjacent tissue or matched normal control tissue were used to generate the control microarrays. In all studies, mRNA expression levels were normalized to the median intensity of all spots on the microarray and plotted as log2 median-centered intensity. B, coexpression analysis revealed that SNAT1 (SLC38A1 in the figure) was highly expressed together with HIF1α target genes in clear cell renal cell carcinoma. C, expression of SNAT1 may be driven by the hepatic growth factor (HGF) oncogenic pathway. Overexpression of hepatic growth factor in Madin-Darby canine kidney (MDCK) cells significantly increases expression of SNAT1. The response can be blocked by mitogen-activated protein kinase inhibitors. Data variance is shown as box plots indicating upper limit, median, and lower limit.
Author Contributions
A. B. and F. R. planned and performed experiments, analyzed data, and edited the manuscript. S. B. designed the study, analyzed data, and wrote the manuscript.
Acknowledgments
We thank Pei-Chuan Liu for performing preliminary experiments that helped to design this study. Dr. Markus Winterberg gave invaluable support for the amino acid analysis, and Metabolomics Australia performed metabolomics analysis with labeled glutamine.
The authors declare that they have no conflicts of interest with the contents of this article.
- TCA
- tricarboxylic acid
- HIF
- hypoxia-inducible factor
- mTOR
- mammalian target of rapamycin
- SNAT
- sodium-neutral amino acid transporter
- MeAIB
- N-methylaminoisobutyric acid
- CRISPR
- clustered regularly interspaced short palindromic repeats
- Bis-Tris
- 2-[bis(2-hydroxyethyl)amino]-2-(hydroxymethyl)propane-1,3-diol
- ASCT
- alanine-serine-cysteine transporter
- CCRCC
- clear cell renal cell carcinoma
- P-eIF2α
- phospho-eIF2α.
References
- 1. Chandel N. S. (2015) Navigating Metabolism, Cold Spring Harbor Laboratory Press, Cold Spring Harbor, NY [Google Scholar]
- 2. Newsholme E. A., Crabtree B., and Ardawi M. S. (1985) Glutamine metabolism in lymphocytes: its biochemical, physiological and clinical importance. Q. J. Exp. Physiol. 70, 473–489 [DOI] [PubMed] [Google Scholar]
- 3. Wise D. R., and Thompson C. B. (2010) Glutamine addiction: a new therapeutic target in cancer. Trends Biochem. Sci. 35, 427–433 [DOI] [PMC free article] [PubMed] [Google Scholar]
- 4. Kung H. N., Marks J. R., and Chi J. T. (2011) Glutamine synthetase is a genetic determinant of cell type-specific glutamine independence in breast epithelia. PLoS Genet. 7, e1002229. [DOI] [PMC free article] [PubMed] [Google Scholar]
- 5. Vander Heiden M. G., Cantley L. C., and Thompson C. B. (2009) Understanding the Warburg effect: the metabolic requirements of cell proliferation. Science 324, 1029–1033 [DOI] [PMC free article] [PubMed] [Google Scholar]
- 6. Hitosugi T., Fan J., Chung T. W., Lythgoe K., Wang X., Xie J., Ge Q., Gu T. L., Polakiewicz R. D., Roesel J. L., Chen G. Z., Boggon T. J., Lonial S., Fu H., Khuri F. R., et al. (2011) Tyrosine phosphorylation of mitochondrial pyruvate dehydrogenase kinase 1 is important for cancer metabolism. Mol. Cell 44, 864–877 [DOI] [PMC free article] [PubMed] [Google Scholar]
- 7. Bayley J. P., and Devilee P. (2012) The Warburg effect in 2012. Curr. Opin. Oncol. 24, 62–67 [DOI] [PubMed] [Google Scholar]
- 8. DeBerardinis R. J., Mancuso A., Daikhin E., Nissim I., Yudkoff M., Wehrli S., and Thompson C. B. (2007) Beyond aerobic glycolysis: transformed cells can engage in glutamine metabolism that exceeds the requirement for protein and nucleotide synthesis. Proc. Natl. Acad. Sci. U.S.A. 104, 19345–19350 [DOI] [PMC free article] [PubMed] [Google Scholar]
- 9. Nakanishi T., Sugawara M., Huang W., Martindale R. G., Leibach F. H., Ganapathy M. E., Prasad P. D., and Ganapathy V. (2001) Structure, function, and tissue expression pattern of human SN2, a subtype of the amino acid transport system N. Biochem. Biophys. Res. Commun. 281, 1343–1348 [DOI] [PubMed] [Google Scholar]
- 10. Nicklin P., Bergman P., Zhang B., Triantafellow E., Wang H., Nyfeler B., Yang H., Hild M., Kung C., Wilson C., Myer V. E., MacKeigan J. P., Porter J. A., Wang Y. K., Cantley L. C., et al. (2009) Bidirectional transport of amino acids regulates mTOR and autophagy. Cell 136, 521–534 [DOI] [PMC free article] [PubMed] [Google Scholar]
- 11. Boroughs L. K., and DeBerardinis R. J. (2015) Metabolic pathways promoting cancer cell survival and growth. Nat. Cell Biol. 17, 351–359 [DOI] [PMC free article] [PubMed] [Google Scholar]
- 12. Fuchs B. C., Finger R. E., Onan M. C., and Bode B. P. (2007) ASCT2 silencing regulates mammalian target-of-rapamycin growth and survival signaling in human hepatoma cells. Am. J. Physiol. Cell Physiol. 293, C55–C63 [DOI] [PubMed] [Google Scholar]
- 13. Fuchs B. C., and Bode B. P. (2005) Amino acid transporters ASCT2 and LAT1 in cancer: partners in crime? Semin. Cancer Biol. 15, 254–266 [DOI] [PubMed] [Google Scholar]
- 14. Bröer A., Wagner C., Lang F., and Bröer S. (2000) Neutral amino acid transporter ASCT2 displays substrate-induced Na+ exchange and a substrate-gated anion conductance. Biochem. J. 346, 705–710 [PMC free article] [PubMed] [Google Scholar]
- 15. Deitmer J. W., Bröer A., and Bröer S. (2003) Glutamine efflux from astrocytes is mediated by multiple pathways. J. Neurochem. 87, 127–135 [DOI] [PubMed] [Google Scholar]
- 16. Bröer S. (2014) The SLC38 family of sodium-amino acid co-transporters. Pflugers Arch. 466, 155–172 [DOI] [PubMed] [Google Scholar]
- 17. Wise D. R., DeBerardinis R. J., Mancuso A., Sayed N., Zhang X. Y., Pfeiffer H. K., Nissim I., Daikhin E., Yudkoff M., McMahon S. B., and Thompson C. B. (2008) Myc regulates a transcriptional program that stimulates mitochondrial glutaminolysis and leads to glutamine addiction. Proc. Natl. Acad. Sci. U.S.A. 105, 18782–18787 [DOI] [PMC free article] [PubMed] [Google Scholar]
- 18. Zhang J., Ahn W. S., Gameiro P. A., Keibler M. A., Zhang Z., and Stephanopoulos G. (2014) 13C isotope-assisted methods for quantifying glutamine metabolism in cancer cells. Methods Enzymol. 542, 369–389 [DOI] [PMC free article] [PubMed] [Google Scholar]
- 19. Bröer S. (2003) Xenopus laevis oocytes. Methods Mol. Biol. 227, 245–258 [DOI] [PubMed] [Google Scholar]
- 20. Bröer A., Brookes N., Ganapathy V., Dimmer K. S., Wagner C. A., Lang F., and Bröer S. (1999) The astroglial ASCT2 amino acid transporter as a mediator of glutamine efflux. J. Neurochem. 73, 2184–2194 [PubMed] [Google Scholar]
- 21. Rebsamen M., Pochini L., Stasyk T., de Araújo M. E., Galluccio M., Kandasamy R. K., Snijder B., Fauster A., Rudashevskaya E. L., Bruckner M., Scorzoni S., Filipek P. A., Huber K. V., Bigenzahn J. W., Heinz L. X., et al. (2015) SLC38A9 is a component of the lysosomal amino acid sensing machinery that controls mTORC1. Nature 519, 477–481 [DOI] [PMC free article] [PubMed] [Google Scholar]
- 22. Wang S., Tsun Z. Y., Wolfson R. L., Shen K., Wyant G. A., Plovanich M. E., Yuan E. D., Jones T. D., Chantranupong L., Comb W., Wang T., Bar-Peled L., Zoncu R., Straub C., Kim C., et al. (2015) Metabolism. Lysosomal amino acid transporter SLC38A9 signals arginine sufficiency to mTORC1. Science 347, 188–194 [DOI] [PMC free article] [PubMed] [Google Scholar]
- 23. Tamarappoo B. K., Handlogten M. E., Laine R. O., Serrano M. A., Dugan J., and Kilberg M. S. (1992) Identification of the protein responsible for hepatic system N amino acid transport activity. J. Biol. Chem. 267, 2370–2374 [PubMed] [Google Scholar]
- 24. Wang Q., and Holst J. (2015) l-Type amino acid transport and cancer: targeting the mTORC1 pathway to inhibit neoplasia. Am. J. Cancer Res. 5, 1281–1294 [PMC free article] [PubMed] [Google Scholar]
- 25. Bode B. P., Fuchs B. C., Hurley B. P., Conroy J. L., Suetterlin J. E., Tanabe K. K., Rhoads D. B., Abcouwer S. F., and Souba W. W. (2002) Molecular and functional analysis of glutamine uptake in human hepatoma and liver-derived cells. Am. J. Physiol. Gastrointest. Liver Physiol. 283, G1062–G1073 [DOI] [PubMed] [Google Scholar]
- 26. Grewer C., and Grabsch E. (2004) New inhibitors for the neutral amino acid transporter ASCT2 reveal its Na+-dependent anion leak. J. Physiol. 557, 747–759 [DOI] [PMC free article] [PubMed] [Google Scholar]
- 27. Esslinger C. S., Cybulski K. A., and Rhoderick J. F. (2005) Nγ-Aryl glutamine analogues as probes of the ASCT2 neutral amino acid transporter binding site. Bioorg. Med. Chem. 13, 1111–1118 [DOI] [PubMed] [Google Scholar]
- 28. Baird F. E., Beattie K. J., Hyde A. R., Ganapathy V., Rennie M. J., and Taylor P. M. (2004) Bidirectional substrate fluxes through the system N (SNAT5) glutamine transporter may determine net glutamine flux in rat liver. J. Physiol. 559, 367–381 [DOI] [PMC free article] [PubMed] [Google Scholar]
- 29. Gazzola R. F., Sala R., Bussolati O., Visigalli R., Dall'Asta V., Ganapathy V., and Gazzola G. C. (2001) The adaptive regulation of amino acid transport system A is associated to changes in ATA2 expression. FEBS Lett. 490, 11–14 [DOI] [PubMed] [Google Scholar]
- 30. Phang J. M., Liu W., Hancock C. N., and Fischer J. W. (2015) Proline metabolism and cancer: emerging links to glutamine and collagen. Curr. Opin. Clin. Nutr. Metab. Care 18, 71–77 [DOI] [PMC free article] [PubMed] [Google Scholar]
- 31. D'Aniello C., Fico A., Casalino L., Guardiola O., Di Napoli G., Cermola F., De Cesare D., Tatè R., Cobellis G., Patriarca E. J., and Minchiotti G. (2015) A novel autoregulatory loop between the Gcn2-Atf4 pathway and l-proline metabolism controls stem cell identity. Cell Death Differ. 22, 1234. [DOI] [PMC free article] [PubMed] [Google Scholar]
- 32. Gaccioli F., Huang C. C., Wang C., Bevilacqua E., Franchi-Gazzola R., Gazzola G. C., Bussolati O., Snider M. D., and Hatzoglou M. (2006) Amino acid starvation induces the SNAT2 neutral amino acid transporter by a mechanism that involves eukaryotic initiation factor 2α phosphorylation and cap-independent translation. J. Biol. Chem. 281, 17929–17940 [DOI] [PubMed] [Google Scholar]
- 33. Hyde R., Cwiklinski E. L., MacAulay K., Taylor P. M., and Hundal H. S. (2007) Distinct sensor pathways in the hierarchical control of SNAT2, a putative amino acid transceptor, by amino acid availability. J. Biol. Chem. 282, 19788–19798 [DOI] [PubMed] [Google Scholar]
- 34. Barretina J., Caponigro G., Stransky N., Venkatesan K., Margolin A. A., Kim S., Wilson C. J., Lehár J., Kryukov G. V., Sonkin D., Reddy A., Liu M., Murray L., Berger M. F., Monahan J. E., et al. (2012) The Cancer Cell Line Encyclopedia enables predictive modelling of anticancer drug sensitivity. Nature 483, 603–607 [DOI] [PMC free article] [PubMed] [Google Scholar]
- 35. Kaira K., Oriuchi N., Imai H., Shimizu K., Yanagitani N., Sunaga N., Hisada T., Tanaka S., Ishizuka T., Kanai Y., Endou H., Nakajima T., and Mori M. (2008) l-Type amino acid transporter 1 and CD98 expression in primary and metastatic sites of human neoplasms. Cancer Sci. 99, 2380–2386 [DOI] [PMC free article] [PubMed] [Google Scholar]
- 36. Kim D. K., Kanai Y., Choi H. W., Tangtrongsup S., Chairoungdua A., Babu E., Tachampa K., Anzai N., Iribe Y., and Endou H. (2002) Characterization of the system L amino acid transporter in T24 human bladder carcinoma cells. Biochim. Biophys. Acta 1565, 112–121 [DOI] [PubMed] [Google Scholar]
- 37. Yanagida O., Kanai Y., Chairoungdua A., Kim D. K., Segawa H., Nii T., Cha S. H., Matsuo H., Fukushima J., Fukasawa Y., Tani Y., Taketani Y., Uchino H., Kim J. Y., Inatomi J., et al. (2001) Human l-type amino acid transporter 1 (LAT1): characterization of function and expression in tumor cell lines. Biochim. Biophys. Acta 1514, 291–302 [DOI] [PubMed] [Google Scholar]
- 38. Oda K., Hosoda N., Endo H., Saito K., Tsujihara K., Yamamura M., Sakata T., Anzai N., Wempe M. F., Kanai Y., and Endou H. (2010) l-Type amino acid transporter 1 inhibitors inhibit tumor cell growth. Cancer Sci. 101, 173–179 [DOI] [PMC free article] [PubMed] [Google Scholar]
- 39. Wang Q., Beaumont K. A., Otte N. J., Font J., Bailey C. G., van Geldermalsen M., Sharp D. M., Tiffen J. C., Ryan R. M., Jormakka M., Haass N. K., Rasko J. E., and Holst J. (2014) Targeting glutamine transport to suppress melanoma cell growth. Int. J. Cancer 135, 1060–1071 [DOI] [PubMed] [Google Scholar]
- 40. Wang Q., Hardie R. A., Hoy A. J., van Geldermalsen M., Gao D., Fazli L., Sadowski M. C., Balaban S., Schreuder M., Nagarajah R., Wong J. J., Metierre C., Pinello N., Otte N. J., Lehman M. L., et al. (2015) Targeting ASCT2-mediated glutamine uptake blocks prostate cancer growth and tumour development. J. Pathol. 236, 278–289 [DOI] [PMC free article] [PubMed] [Google Scholar]
- 41. Hyde R., Taylor P. M., and Hundal H. S. (2003) Amino acid transporters: roles in amino acid sensing and signalling in animal cells. Biochem. J. 373, 1–18 [DOI] [PMC free article] [PubMed] [Google Scholar]
- 42. Kilberg M. S., Shan J., and Su N. (2009) ATF4-dependent transcription mediates signaling of amino acid limitation. Trends Endocrinol. Metab. 20, 436–443 [DOI] [PMC free article] [PubMed] [Google Scholar]
- 43. Jeon Y. J., Khelifa S., Ratnikov B., Scott D. A., Feng Y., Parisi F., Ruller C., Lau E., Kim H., Brill L. M., Jiang T., Rimm D. L., Cardiff R. D., Mills G. B., Smith J. W., et al. (2015) Regulation of glutamine carrier proteins by RNF5 determines breast cancer response to ER stress-inducing chemotherapies. Cancer Cell 27, 354–369 [DOI] [PMC free article] [PubMed] [Google Scholar]
- 44. Fuchs B. C., Perez J. C., Suetterlin J. E., Chaudhry S. B., and Bode B. P. (2004) Inducible antisense RNA targeting amino acid transporter ATB0/ASCT2 elicits apoptosis in human hepatoma cells. Am. J. Physiol. Gastrointest. Liver Physiol. 286, G467–G478 [DOI] [PubMed] [Google Scholar]
- 45. Gumz M. L., Zou H., Kreinest P. A., Childs A. C., Belmonte L. S., LeGrand S. N., Wu K. J., Luxon B. A., Sinha M., Parker A. S., Sun L. Z., Ahlquist D. A., Wood C. G., and Copland J. A. (2007) Secreted frizzled-related protein 1 loss contributes to tumor phenotype of clear cell renal cell carcinoma. Clin. Cancer Res. 13, 4740–4749 [DOI] [PubMed] [Google Scholar]
- 46. Beroukhim R., Brunet J. P., Di Napoli A., Mertz K. D., Seeley A., Pires M. M., Linhart D., Worrell R. A., Moch H., Rubin M. A., Sellers W. R., Meyerson M., Linehan W. M., Kaelin W. G. Jr., and Signoretti S. (2009) Patterns of gene expression and copy-number alterations in von-Hippel Lindau disease-associated and sporadic clear cell carcinoma of the kidney. Cancer Res. 69, 4674–4681 [DOI] [PMC free article] [PubMed] [Google Scholar]
- 47. Lenburg M. E., Liou L. S., Gerry N. P., Frampton G. M., Cohen H. T., and Christman M. F. (2003) Previously unidentified changes in renal cell carcinoma gene expression identified by parametric analysis of microarray data. BMC Cancer 3, 31. [DOI] [PMC free article] [PubMed] [Google Scholar]
- 48. Yusenko M. V., Kuiper R. P., Boethe T., Ljungberg B., van Kessel A. G., and Kovacs G. (2009) High-resolution DNA copy number and gene expression analyses distinguish chromophobe renal cell carcinomas and renal oncocytomas. BMC Cancer 9, 152. [DOI] [PMC free article] [PubMed] [Google Scholar]
- 49. Frew I. J., and Moch H. (2015) A clearer view of the molecular complexity of clear cell renal cell carcinoma. Annu. Rev. Pathol. 10, 263–289 [DOI] [PubMed] [Google Scholar]
- 50. ENCODE Project Consortium (2011) A user's guide to the encyclopedia of DNA elements (ENCODE). PLos Biol. 9, e1001046. [DOI] [PMC free article] [PubMed] [Google Scholar]
- 51. Hellman N. E., Spector J., Robinson J., Zuo X., Saunier S., Antignac C., Tobias J. W., and Lipschutz J. H. (2008) Matrix metalloproteinase 13 (MMP13) and tissue inhibitor of matrix metalloproteinase 1 (TIMP1), regulated by the MAPK pathway, are both necessary for Madin-Darby canine kidney tubulogenesis. J. Biol. Chem. 283, 4272–4282 [DOI] [PubMed] [Google Scholar]