Abstract
7-Hydroxymethyl chlorophyll a reductase (HCAR) catalyzes the second half-reaction in chlorophyll b to chlorophyll a conversion. HCAR is required for the degradation of light-harvesting complexes and is necessary for efficient photosynthesis by balancing the chlorophyll a/b ratio. Reduction of the hydroxymethyl group uses redox cofactors [4Fe-4S] cluster and FAD to transfer electrons and is difficult because of the strong carbon-oxygen bond. Here, we report the crystal structure of Arabidopsis HCAR at 2.7-Å resolution and reveal that two [4Fe-4S]clusters and one FAD within a very short distance form a consecutive electron pathway to the substrate pocket. In vitro kinetic analysis confirms the ferredoxin-dependent electron transport chain, thus supporting a proton-activated electron transfer mechanism. HCAR resembles a partial reconstruction of an archaeal F420-reducing [NiFe] hydrogenase, which suggests a common mode of efficient proton-coupled electron transfer through conserved cofactor arrangements. Furthermore, the trimeric form of HCAR provides a biological clue of its interaction with light-harvesting complex II.
Keywords: crystal structure, electron transfer, flavin adenine dinucleotide (FAD), iron-sulfur protein, reductase, chlorophyll cycle, chlorophyll degradation, proton-coupled electron transfer
Introduction
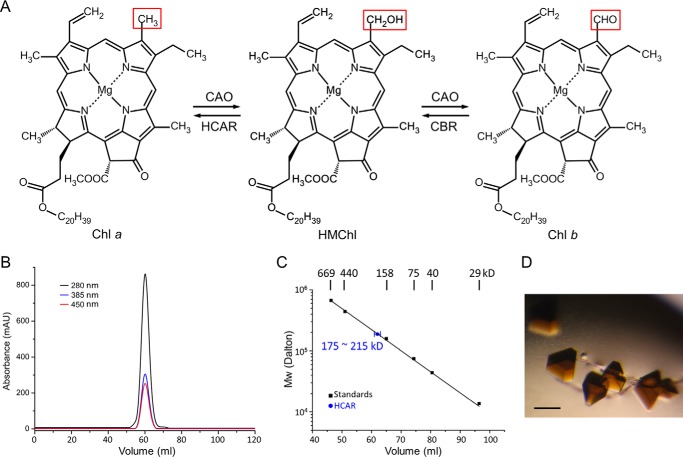
The balance of chlorophyll metabolism is vital for plants to ensure an efficient photosynthesis and to support various biological processes (1). To this end, chlorophyll biosynthesis and degradation need to cooperate with the chlorophyll cycle, a process of interconversion between chlorophyll a and chlorophyll b (2–5). The chlorophyll a/b ratio is important for stabilization of the light-harvesting complexes (LHCs).2 In general, an increase of the chlorophyll b level correlates with accumulation of LHCs and thus improvement of light usage efficiency in normal condition; excessive chlorophyll b, however, could impair the energy transfer pathway by replacing chlorophyll a in LHCs (6). In the chlorophyll cycle, both the forward (from chlorophyll a to chlorophyll b) and the backward conversions use 7-hydroxymethyl chlorophyll a (HMChl) as the intermediate (see Fig. 1A). Chlorophyll a oxygenase catalyzes two sequential oxidation reactions from the 7-methyl to the 7-formyl group (7, 8); chlorophyll b reductase and HMChl reductase (HCAR) catalyze the reverse two sequential reduction reactions (9, 10). In addition, the reverse reduction reactions are essential for LHC-II turnover because chlorophyll degradation precedes degradation of the LHC-II apoprotein, and the chlorophyll catabolic process starts from chlorophyll a (11–13). Direct interaction between HCAR and LHC-II has been observed in senescing chloroplasts (14).
FIGURE 1.
Function, purification, and crystallization of HCAR. A, interconversion of chlorophyll a and chlorophyll b with HMChl as intermediate. CAO, chlorophyll a oxygenase; CBR, chlorophyll b reductase. B, SEC profiles on a HiLoad 16/60 Superdex 200 column. The protein and its cofactors are monitored by absorbance at 280, 385, and 450 nm. C, calibration curve of logarithm of molecular mass as a function of elution volume. The HCAR elusion peak indicates an oligomeric state. D, the dark brown crystals of HCAR. The scale bar corresponds to 200 μm.
HCAR is the last identified enzyme of the chlorophyll cycle (10). Bioinformatic studies have discovered that the HCAR homologues range from archaea to plants (15). They perform different roles, such as the F420-binding subunit of F420-reducing [NiFe] hydrogenase (Frh) in methanogenic archaea (16) and 3,8-divinyl (proto)chlorophyllide a 8-vinyl reductase (DVR) involved in (bacterio)chlorophyll biosynthesis (17, 18). The cofactors FAD and [4Fe-4S] cluster have been found to participate in electron transfer within Frh and DVR (18, 19). The structure of Frh from Methanothermobacter marburgensis has been solved by cryo-microscopy and crystallography (20–22). Frh is a heterotrimer, with subunit FrhA carrying a [NiFe] center, subunit FrhG carrying three [4Fe-4S] clusters, and subunit FrhB carrying one [4Fe-4S] cluster and one FAD. It has been suggested that the HCAR homologues adopt structures similar to that of FrhB, the F420-binding subunit (19), but arrangements of the cofactors and hence the details of the electron pathway within HCAR remain unclear.
Here, the crystal structure of Arabidopsis HCAR reveals the ligating cysteines of the two [4Fe-4S] clusters, residues involved in FAD binding, and a deep substrate pocket adjacent to the flavin ring. We established a quantitative in vitro assay, confirmed the reduced ferredoxin (Fdred)-dependent reaction, and demonstrated that His417 and Asp237 are critical for the catalytic activity. This structural and biochemical characterization supports a proton-activated electron transfer mechanism. A structure-based phylogenetic analysis indicates that, in HCAR homologues, an efficient electron pathway and the usage of Fdred as electron donor are kept despite the change of substrate specificity during evolution.
Experimental Procedures
Protein Expression and Purification
The gene of Arabidopsis HCAR (At1g04620) lacking sequence of the N-terminal 26 amino acid peptide was amplified by PCR. The product was inserted into pETMALc-H (23) with an introduced tobacco etch virus (TEV) cleavage sequence following the MBP-His6 tag in the vector and then transformed into Escherichia coli BL21(DE3) cells. The expression of MBP-His6-TEV-HCAR protein was induced with 0.2 mm isopropyl β-d-thiogalactopyranoside for ∼16 h at 16 °C. Harvested cells were resuspended in buffer A (20 mm Tris-HCl, pH 7.0, and 500 mm NaCl) supplemented with 20 mm imidazole and disrupted by sonication. The cleared supernatant of cell lysate was incubated with buffer A-equilibrated nickel-nitrilotriacetic acid affinity column (Qiagen) for 1 h at 4 °C, and the recombinant proteins were eluted by 200 mm imidazole. The MBP-His6 tag was cleaved by TEV protease. Protein aggregates and the MBP-His6 tag were then removed by size exclusion chromatography (SEC; see below). The purity of HCAR protein was monitored by SDS-PAGE during purification. The purified protein was concentrated to 10 mg/ml and flash-frozen in liquid nitrogen for further crystallization or activity assay. The selenomethionine derivatives of HCAR were expressed at 25 °C supplemented with additional 10 mg/liter vitamin B2 (Sigma-Aldrich) in the medium and purified as described above. The site-directed mutation of HCAR was generated with a Fast Mutagenesis System Kit (TransGen Biotech) using the MBP-His6-TEV-HCAR plasmid as template. All mutated plasmids were sequenced to verify the desired mutations. The procedure for purification of the mutant proteins was the same as that of the wild type.
The fragment of Arabidopsis ferredoxin-NADP+-oxidoreductase (FNR; At1g20020) lacking the N-terminal 55-amino acid peptide and the fragment of Zea mays ferredoxin (FDX1, GenBankTM code M73829) lacking the N-terminal 52-amino acid peptide were PCR-amplified. Both fragments were cloned into the pET-22b(+) (Novagen) expression vector, respectively. The expression procedure of FNR and ferredoxin were the same as that of HCAR, and both proteins were purified by a nickel-nitrilotriacetic acid column followed by SEC.
Size Exclusion Chromatography
A HiLoad 16/60 Superdex 200 column (GE Healthcare) was equilibrated with buffer A supplemented with 2 mm dithiothreitol. The protein elution profile was monitored by absorbance at 280 nm. The apparent molecular weight of HCAR was evaluated by comparison to globular protein standards (GE Healthcare) with known molecular weights. The protein standards are thyroglobulin, ferritin, aldolase, conalbumin, ovalbumin, and carbonic anhydrase. Comparison of the HCAR peaks from triplicate experiments with the calibration curve yielded an apparent molecular weight.
Chlorophyll Preparation
Chlorophylls were extracted with acetone from spinach leaves. Chlorophyll b was separated by a 200-mesh silica column with hexane/ethyl acetate (Sigma-Aldrich) in 2:1 (v/v) ratio as the elution agent. HMChl was prepared by reducing chlorophyll b with NaBH4 (32). 1 mg of chlorophyll b was dissolved in 10 ml of methanol containing 0.5 mg of NaBH4 and incubated for 2 min at room temperature. The reaction was stopped by adding 10 ml of saturated NaCl solution, and the products were transferred into diethyl ether and dried by nitrogen. The crude products of chlorophyll a, chlorophyll b, and HMChl were purified by HPLC on a SunFire Prep C18 OBD column (5 μm, 19 × 250 mm; Waters) with methanol as the elution agent. Purified chlorophylls were pooled and dried by nitrogen. The steps of chlorophylls preparation need to avoid light.
Determination of Extinction Coefficients
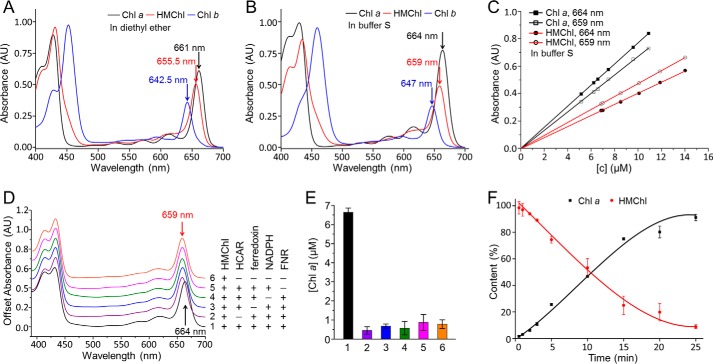
To establish the activity assay, we first characterized the spectroscopic properties of chlorophyll a, chlorophyll b, and HMChl in buffer S (5 mm Tris-HCl, pH 7.5, 30 mm NaCl, 0.02% Triton X-100, and 80% acetone). The absorbance peaks of HMChl and chlorophyll a are at 655.5 and 661 nm in diethyl ether, and at 659 and 664 nm in buffer S. We then determined the extinction coefficients of HMChl and chlorophyll a at 659 and 664 nm in buffer S, respectively. The molar extinction coefficient (ϵ) of chlorophyll a at 664 nm in 80% aqueous acetone is 76.79 mm−1 cm−1 (33). The ϵ value of chlorophyll a at 664 nm in buffer S is 76.98 ± 0.70 mm−1 cm−1. The ϵ value of HMChl at 655.5 nm in diethyl ether is 61.10 mm−1 cm−1 (34). The ϵ values of HMChl at 655.5 and 659 nm in buffer S are 44.57 ± 0.65 and 47.30 ± 0.39 mm−1 cm−1. By calibrating with a series of chlorophyll a/HMChl standards at 664 and 659 nm in buffer S, the ϵ value of chlorophyll a at 659 nm in buffer S is 66.98 ± 0.68 mm−1 cm−1, and the ϵ value of HMChl at 664 nm in buffer S is 40.24 ± 0.31 mm−1 cm−1. Using an experimental scheme described by Porra et al. (33), by measuring the absorbance at 659 and 664 nm (A659 nm and A664 nm) of a chlorophyll a/HMChl mixture, the concentration of chlorophyll a and HMChl can be calculated by using the following equations.
In Vitro Activity Assay
The HCAR activity assay was performed in 100 μl of buffer B (25 mm Tris-HCl, pH 7.5, 150 mm NaCl, and 0.1% Triton X-100), with 50 μm HMChl, 10 μm FNR, 10 μm ferredoxin, 1 mm NADPH, and 15 μm HCAR. The reaction mixture was incubated at 25 °C for 15 min before 400 μl of acetone was added, which yielded the mixture in buffer S (20% buffer B and 80% acetone). The chlorophylls were extracted into liquid phase by violent vortexing, whereas the proteins were denatured by acetone. After centrifugation at 16,000 × g for 10 min, the separated supernatant containing the chlorophylls was analyzed by full-wavelength scanning or monitored by the absorption at 664 and 659 nm in a 1-cm cuvette.
Crystallization, Data Collection, Structure Determination, and Refinement
Initial crystallization screening was performed by the vapor diffusion method in a sitting drop consisting 1 μl of HCAR protein (10 mg/ml) mixed with 1 μl of well solution at 289 K. Dark brown crystals appeared after 5 days under 0.2 m MgCl2, 0.1 m Tris-HCl, pH 8.5, 25% (w/v) polyethylene glycol 3350, 3% (v/v) ethylene glycol, and its quality was improved by seeding method. Before being flash-frozen in liquid nitrogen, the crystals were transferred step by step into drops of the mother liquid supplemented with 5, 10, and 20% (v/v) glycerol. All x-ray diffraction data sets were collected at Beamline BL17U of Shanghai Synchrotron Radiation Facility at a wavelength of 0.9793 Å at 100 K. The data were integrated and scaled by HKL2000 (HKL Research, Inc.). 66 selenium atoms in six HCAR molecules per asymmetric unit were determined by AutoSol in PHENIX suite (24, 25). The identified selenium sites were then refined, and the initial model were generated by AutoBuild (26). The missing residues were built manually using Coot (27) according to the 2|Fo| − |Fc| and |Fo| − |Fc| electron density maps. The structure was then refined using phenix.refine (28). The overall quality of the structure was assessed by MolProbity (29), and 95.86, 3.86, and 0.28% of the residues were in the most favored, additional allowed and disallowed regions of the Ramachandran plot, respectively. Structure determination and refinement statistics are listed in Table 1. The structure and diffraction data have been deposited in the Protein Data Bank (code 5DQR). The protein structure figures were prepared by PyMOL (Schrödinger).
TABLE 1.
Data collection and refinement statistics
Highest resolution shell values are shown in parentheses.
| Native HCAR | SeMet-HCAR | |
|---|---|---|
| Data collection | ||
| Space group | P32 | P32 |
| Cell dimensions | ||
| a, b, c (Å) | 89.1, 89.1, 273.3 | 89.5, 89.5, 292.7 |
| α, β, γ (°) | 90, 90, 120 | 90, 90, 120 |
| Wavelength | 0.9793 | 0.9793 |
| Resolution (Å) | 50 − 2.70 (2.80 − 2.70) | 50 − 3.20 (3.31 − 3.20) |
| Rsym or Rmergea | 0.105 (0.571) | 0.112 (0.812) |
| I/σI | 11.6 (2.3) | 37 (4.8) |
| Completeness (%) | 99.6 (99.9) | 100 (100) |
| Redundancy | 3.2 (3.2) | 22.8 (23.4) |
| Refinement | ||
| Resolution (Å) | 44.6 − 2.70 | |
| No. reflections | 65245 | |
| Rworkb/Rfreec | 0.202/0.246 | |
| No. atoms | ||
| Protein | 19280 | |
| Ligand/ion | 414 | |
| Water | 622 | |
| B-factors | ||
| Protein | 17.4 | |
| Ligand/ion | 10.0 | |
| Water | 13.9 | |
| Root mean square deviations | ||
| Bond lengths (Å) | 0.005 | |
| Bond angles (°) | 0.852 | |
a Rmerge = ΣhklΣi|Ii(hkl)−<I(hkl)> |/ΣhklΣiIi(hkl), where Ii(hkl) is the ith observation of reflection hkl and <I(hkl)> is the weighted intensity for all observations i of reflection hkl.
b Rwork = Σ| |Fo| − |Fc||/Σ|Fo|, where Fo and Fc are the observed and calculated structure factors, respectively.
c Rfree is the cross-validated R factor computed for a test set of 5% of the reflections, which were omitted during refinement.
Substrate Docking
In silico docking of a 7-hydroxymethyl chlorophyllide a (HMChlide, HMChl without the phytol tail) to HCAR was performed with the program AutoDock Vina 1.1.2 (30). The HMChlide coordinates were adapted from chlorophyll b. Protein coordinates were taken from chain B of the HCAR structure. Prior to simulation, hydrogen atoms, Gasteiger partial charges and ligand torsions, especially the torsion of the C–O bond that is different from the C=O bond in chlorophyll b, were added using the program AutoDockTool (31). During simulation, the protein structures were kept rigid, and grid maps were calculated using 18 × 16 × 22 grid points with spacing of 1.0 Å. Grids were minimized and centered such that they barely covered the substrate pocket, and the most plausible docking result was selected based on the steric accessibilities of the substrate and the calculated binding affinity energy.
Sequence Analysis
Amino acid sequences were aligned using Clustal Omega (35). The secondary structure elements were recognized by DSSP program (36), and the figure was created by ESPript 3 (37).
Phylogenetic Analysis
For the phylogenetic analysis, the midpoint-rooted neighbor-joining tree was generated using MEGA 4 software (38), with the following parameters: bootstrap (500 replicates), complete deletion, Poisson model, and uniform rates. The accession numbers are: NP_171956.2 (Arabidopsis thaliana HCAR), XP_008681058.1 (Z. mays), ABR16627.1 (Picea sitchensis), XP_001770443.1 (Physcomitrella patens), XP_001699546.1 (Chlamydomonas reinhardtii), WP_040945152.1 (Prochloron didemni), WP_010873198.1 (Synechocystis PCC 6803 DVR), ACF13672.1 (Chloroherpeton thalassium BciB), WP_013296464.1 (M. marburgensis FrhB), and AAF65743.1 (Methanosarcina mazei FpoF).
Results
HCAR Is a Trimer
The purified mature Arabidopsis HCAR is of 49 kDa, and the apparent molecular mass according to SEC elution profile is 195 ± 20 kDa (Fig. 1, B and C), which suggests a trimeric or tetrameric state. Given the non-globular shape of an HCAR trimer (see below), the apparent molecular weight is consistent with a trimer state. The purified protein is colored dark brown, indicating the binding of cofactors [4Fe-4S] and FAD. The yielding HCAR crystals also exhibit dark brown color (Fig. 1D).
Establishment of an in Vitro Assay
To quantitatively characterize the activity of HCAR, we first established an assay on the basis of absorption spectra (Fig. 2, A–C). The assay was performed in an aqueous system at near neutral pH. The peak absorbances of substrate HMChl and product chlorophyll a are at 659 and 664 nm in our spectrum measurement buffer. The corresponding molar extinction coefficients are 47.30 ± 0.39 mm−1 cm−1 at 659 nm and 40.24 ± 0.31 mm−1 cm−1 at 664 nm for HMChl and are 66.98 ± 0.68 mm−1 cm−1 at 659 nm and 76.98 ± 0.70 mm−1 cm−1 at 664 nm for chlorophyll a.
FIGURE 2.
Establishment of a quantitative activity assay for HCAR. A and B, spectral comparison of purified chlorophylls in diethyl ether (A) and in buffer S (B). C, the calibration line of absorbance versus concentration of chlorophyll a and HMChl in buffer S. The same standard series of chlorophyll a or HMChl were measured at 664 and 659 nm. The extinction coefficient is derived from the slope by the least squares method. D, the absorption spectra of six in vitro HCAR activity experiments. The presence or absence of a component (50 μm HMChl, 15 μm HCAR, 10 μm ferredoxin, 1 mm NADPH, 10 μm FNR) is indicated by + or −, respectively. The reaction was stopped with four parts acetone, and then the liquid phase was spectroscopically monitored. E, product contents of the six experiments after the 15-min reaction. The experiment order is same as that in D, and the same color scheme is used. The contents of chlorophyll a are calculated from the absorbance value at 659 and 664 nm. The error bars represent the S.D. from three independent experiments. F, progress curve of the HCAR-catalyzed reaction. The reaction with approximate 3-fold excess of HMChl was prepared as in experiment 1 in D, and three replicates were conducted. The contents of HMChl and chlorophyll a are calculated from the absorbance value at 659 and 664 nm. Chl, chlorophyll.
In this in vitro assay system, Fdred was obtained by supplying NADPH and FNR. All the components of the assay, including ferredoxin, FNR, NADPH, and HCAR, are indispensable for the conversion of HMChl to chlorophyll a, as demonstrated by the shift of maximum absorption from 659 to 664 nm (Fig. 2D). The contents of the product chlorophyll a can be calculated (Fig. 2E). The reaction shows a typical first order catalytic profile when excess HMChl is supplied (Fig. 2F).
Overall Structure of HCAR
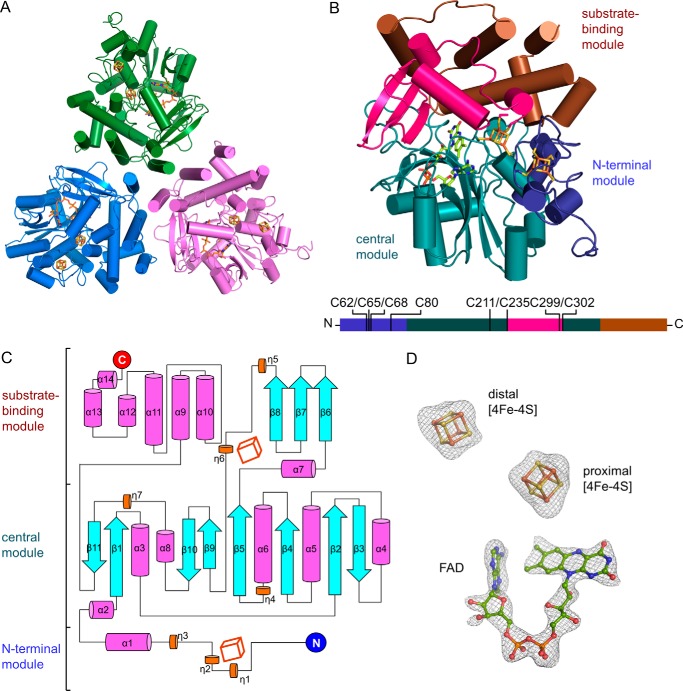
The molecular replacement method using coordinates of the 31-kDa FrhB as template did not find a solution. The structure was determined using single-wavelength anomalous diffraction method (39) and refined to 2.7 Å (Table 1). An HCAR trimer is in a trefoil shape (Fig. 3A). Each protomer shows a compact fold with fourteen α-helices, seven 310-helices, and eleven β-strands (Fig. 3, B and C). This compact structure can be further divided into three functionally discrete modules: an N-terminal module holding a [4Fe-4S] cluster, a central module engulfing the FAD cofactor, and a substrate-binding module composed of a C-terminal helical bundle and an insertion region from the central module. At the interface between the central and the substrate-binding modules, a second [4Fe-4S] cluster bridges the first [4Fe-4S] cluster with FAD. Both [4Fe-4S] clusters and FAD have clear electron density (Fig. 3D). The second [4Fe-4S] cluster is referred to as the proximal cluster for it is closer to FAD. The [4Fe-4S] cluster, typically with a redox potential of approximately −400 mV, mainly functions in electron transfer (40). This crystal structure provides the first definitive evidence of two [4Fe-4S] clusters in HCAR.
FIGURE 3.
Structure of HCAR. A, HCAR trimer in trefoil shape. Protomers are colored in green, blue, and purple, respectively. B, structure of an HCAR protomer. Three functional modules are color-indicated. The [4Fe-4S] clusters with their ligating cysteines and the redox cofactor FAD are shown as sticks. An overview of the functional modules of HCAR is shown at the bottom with the ligating cysteines indicated. The overall structure is divided into three functional modules, which are the N-terminal module (residues 27–100), the central module (101–235, 303–358), and the substrate-binding module (236–302, 359–462). C, topology of the secondary structure elements of HCAR. The N and C termini are indicated as blue and red circles. α-Helix and 310 helix are shown as magenta and orange cylinders, and β-strands are shown as cyan arrows. Two [4Fe-4S] clusters are shown as cubes. D, defined electron density of the cofactors. The |Fo| − |Fc| omit map is contoured at 3σ as gray mesh.
Arrangement of Cofactors
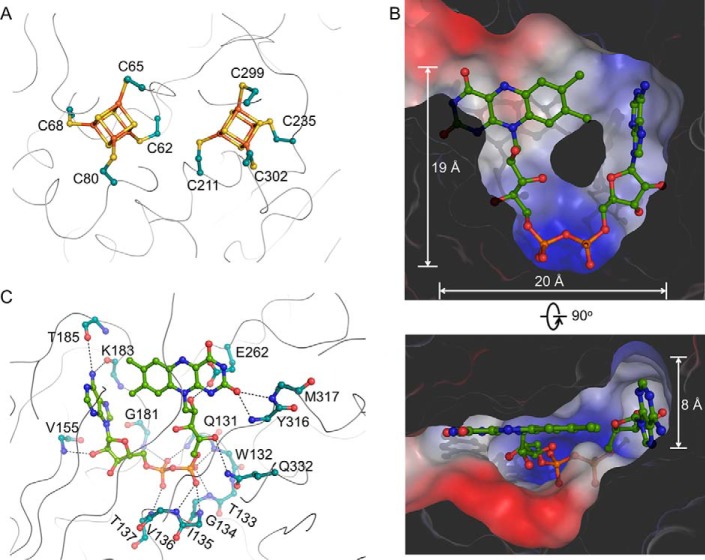
All residues involved in cofactor interactions are well defined. The two [4Fe-4S] clusters are coordinated by four cysteines, respectively (Fig. 4A). To evaluate the roles of these two clusters, we mutated the ligating cysteines to serines to eliminate each cluster separately. However, the two 4-Cys mutants formed inclusion bodies, and the eight single Cys mutants aggregated. This indicates that both [4Fe-4S] clusters are critical for maintaining protein structure.
FIGURE 4.
Cofactor interactions. A, details of the two [4Fe-4S] cluster-binding sites. B, the FAD-binding pocket. The surface of HCAR is colored according to the electrostatic potential. C, the environment of the FAD cofactor (green sticks). The side chain atoms of residues whose backbone atoms participate in FAD binding are not shown.
The U-shaped FAD is buried inside a cavity of approximate 20 × 19 × 8 Å3 in the central module (Fig. 4B). The U-shaped conformation allows close proximity between the adenine and flavin rings (41). The pyrophosphate moiety is fixed by the backbone amide groups of Gln131–Thr137 and Gly181 (Fig. 4C). The flavin ring is stabilized by amide groups of Tyr316 and Met317, and the ribitol moiety forms hydrogen bonds with the side chains of Glu262 and Gln332. Hydrogen bonds also occur between 2′-OH of adenosine ribose and the backbone amide group of Val155 and between the adenosine ring and the carbonyl groups of Lys183 and Thr185. In the crystal, FAD molecules from six HCAR in an asymmetric unit display a uniform binding mode.
Substrate Pocket
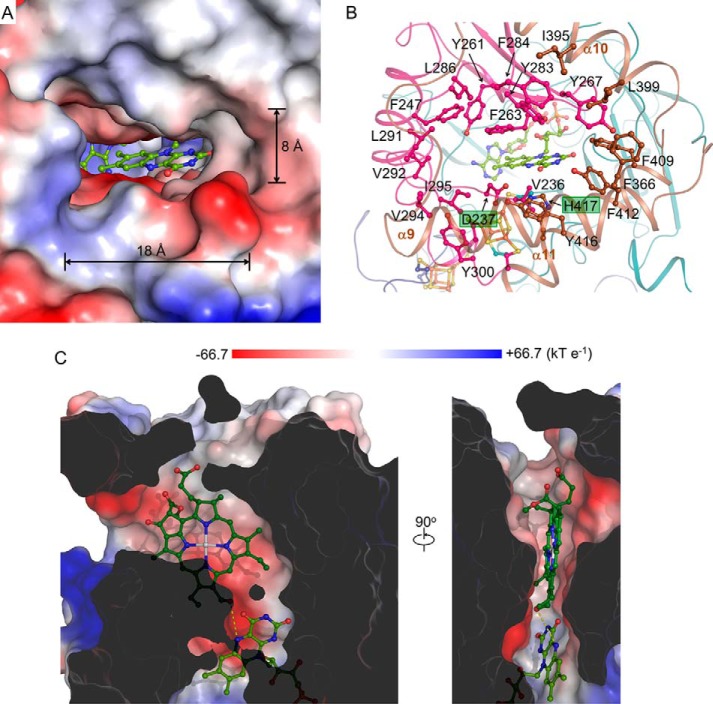
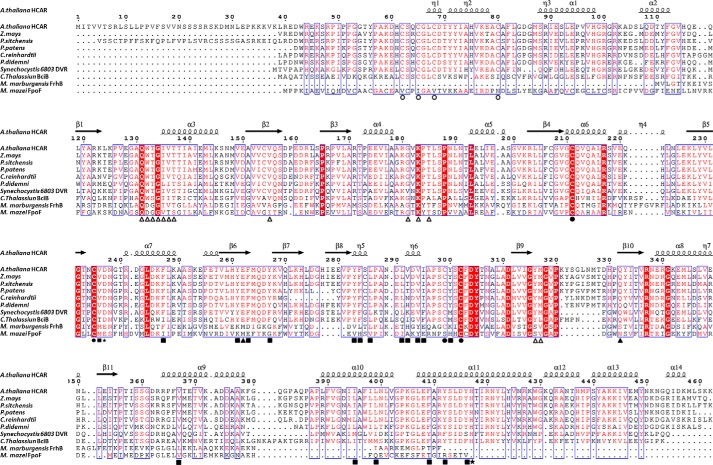
The substrate-binding module has a pocket with a size of approximate 18 × 15 × 8 Å3 (Fig. 5A). This hydrophobic pocket with a solvent-accessible entrance is constituted by aromatic residues including Phe366 on α9; Phe409, Tyr412, and Tyr416 on α11 and Phe247, Tyr261, Phe263, Tyr267, Tyr283, Phe284, and Tyr300 in the insertion region, as well as aliphatic residues including Ile395 and Leu399 on α10 and Val236, Leu286, Leu291, Val292, Val294, and Ile295 in the insertion region (Fig. 5B). His417 is located at the center of the observed substrate pocket, and it may stabilize the Mg2+ at the center of the chlorophyll molecule. Using in silico docking, we modeled an HMChlide into HCAR. The docked molecule fits well with the substrate pocket, and its 7-hydroxymethyl oxygen atom points to the N5 atom of the flavin ring, implying an effective electron transfer pathway (Fig. 5C). Most of the above mentioned residues are conserved (Fig. 6), indicating a common chlorophyll-binding mode for HCAR homologues from different species.
FIGURE 5.
The substrate pocket. A, overall shape of the substrate pocket. B, side chains of the constituting residues and FAD are shown in stick. His417 and Asp237 are indicated. C, clipped surface representation of the substrate pocket. A docked HMChlide is shown in stick. The N5 atom of FAD and the oxygen atom of the hydroxymethyl group are linked by a yellow dashed line. The surface of HCAR is colored according to the electrostatic potential.
FIGURE 6.
Sequence alignment. The amino acid sequences of HCAR homologues from 10 species are aligned. The ligating cysteines of the distal and proximal [4Fe-4S] clusters are labeled by empty and solid circles, respectively. The FAD-binding residues whose backbone atoms are involved in FAD interaction are indicated by empty triangles, and those whose side chain atoms are involved are indicated by solid triangles. Residues forming the substrate pocket are indicated by solid squares. His417 and Asp237 are labeled with stars.
Catalytic Mechanism
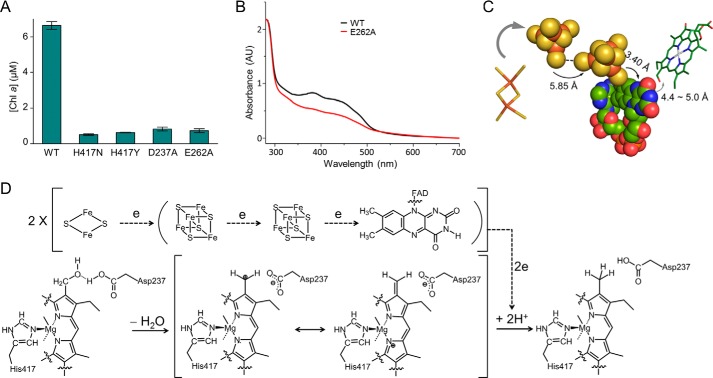
To test the role of the His417, we generated H417A, H417N, and H417Y mutants for activity assays. The H417A mutant formed inclusion bodies during expression, and hence its activity was not measured. Both H417N and H417Y mutants lost their activities (Fig. 7A), which highlights the importance of this histidine. Asp237, a residue near His417, is a candidate involved in proton coupling. We generated the D237A mutant, and it lost activity (Fig. 7A). The redox cofactor FAD is required to be fine-positioned for efficient electron transfer. Glu262 and Gln332 are involved in FAD binding through their polar side chains, whereas all other above-mentioned residues stabilize FAD through their backbone atoms (Fig. 4C). The E262A mutant lost its catalytic activity, probably for its impaired FAD binding capacity as shown by the spectroscopic analysis (Fig. 7, A and B). The Q332A mutant aggregated, and its activity was not measured.
FIGURE 7.
Catalytic mechanism. A, assays for the critical residues involved in HCAR catalysis. The data are presented as the means ± S.D. of three independent experiments. B, spectra of HCAR proteins. E262A mutant protein has decreased absorbance between 300 and 500 nm, consistent with the fact that it contains less cofactor than the wild type HCAR. C, electron transfer pathway. The [4Fe-4S] clusters and FAD are shown in sphere model. The [2Fe-2S] cluster of Fd and the substrate HMChlide are shown as sticks. The distances between each element are indicated. D, proposed catalytic mechanism of HCAR. Dashed lines show the electron flow path from [2Fe-2S] cluster of ferredoxin to substrate via two [4Fe-4S] clusters and FAD.
The edge to edge distances between the two [4Fe-4S] clusters and between the proximal [4Fe-4S] and FAD are 5.85 ± 0.04 and 3.40 ± 0.05 Å, respectively (Fig. 7C). The predicted distance between the substrate carbon-oxygen bond and the N5 atom of the flavin ring is ∼4.4–5.0 Å. Electron transfer could happen directly within such short distances (42). Based on the structure and in vitro assay, a detailed proton-activated electron transfer pathway can be suggested (Fig. 7D).
HCAR Homologues and Evolution
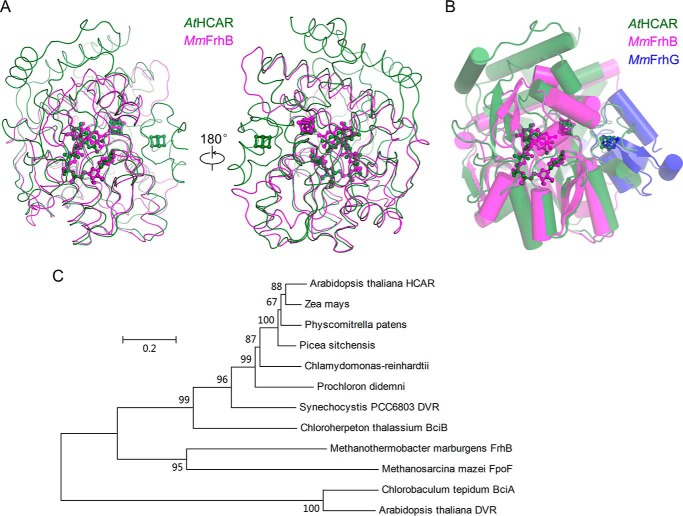
Homologues of HCAR are distributed from archaea to land plants (15), and their functions have varied widely. The closest structural homologue of HCAR is FrhB from the methanogenic archaeon M. marburgensis (20–22). Superimposition of HCAR with FrhB (21) shows the structural similarity of their U-shaped FAD binding site (Fig. 8A). Frh catalyzes the reversible redox reaction from H2 and the cofactor F420, a 5-deazaflavin derivative to F420H2 (43). The root mean square deviation for the 248 aligned Cα atoms between HCAR and FrhB is 2.1 Å. The location of the FrhB [4Fe-4S] cluster is almost identical to the proximal cluster of HCAR (Fig. 8A). HCAR has a long N-terminal module holding the distal [4Fe-4S] cluster and a deep substrate pocket. The distal cluster of HCAR overlaps well with the distal [4Fe-4S] cluster in the C-terminal region of FrhG, a subunit that interacts with FrhB in an Frh heterotrimer (Fig. 8B). The C-terminal region of FrhG harbors a ferredoxin domain (20–22). Comparably, the N-terminal module of HCAR may interact or correlate with ferredoxin.
FIGURE 8.
HCAR homologues and evolution. A, superimposition of HCAR with FrhB from M. marburgensis. The backbone is shown in tube representation, and the cofactors are in ball-and-stick model. B, superimposition of HCAR with FrhB and FrhG from M. marburgensis. Each molecule is color-coded. C, phylogenetic tree of HCAR homologues. Chlorobaculum tepidum BciA and A. thaliana DVR are listed as outgroup.
The homologue of HCAR in green sulfur bacteria, BciB, is a DVR (19). In the cyanobacterium Synechocystis, the HCAR homologue possesses promiscuous enzymatic activities besides its primary function as an DVR and can work as NADH dehydrogenase, chlorophyll b reductase, and HCAR (17, 19, 44). Plant HCAR is proposed to evolve from a cyanobacterial DVR with its substrate specificity changing from the 8-vinyl group to the 7-hydroxymethyl group on the chlorin ring, and the neutral NADH dehydrogenase activity is retained (44). A phylogenetic analysis indicates that FrhB and the bciB-coded DVR from green sulfur bacteria and most cyanobacteria share a common ancestor with HCAR (Fig. 8C). The substrate specificity of HCAR homologues has changed from F420 to either the 8-vinyl group or the 7-hydroxymethyl group of (bacterio)chlorophyll, whereas the function as electron input module and the usage of Fdred as electron donor are kept.
Discussion
HCAR is proposed to use proton-coupled electron transfer (PCET) to overcome the carbon-oxygen bond energy barrier in the 7-hydroxymethyl group (10). A similar biological example is ribonucleotide reductase that catalyzes the replacement of the ribose 2′-OH with a hydrogen atom in ribonucleotides by utilizing a PCET pathway via amino acid radicals (45). PCET is a strategy that has been found in metalloenzyme-catalyzed bioenergetics reactions, such as hydrogen oxidation in hydrogenase (43, 46), oxygen reduction in cytochrome c oxidase (47), and water oxidation in photosystem II (48). Although the detailed mechanism of PCET is currently under investigation, its fundamental principle is the coupling of electron and proton transfer to cross the intermediate energy barrier (49). The HCAR-catalyzed hydroxymethyl reduction, in which a resonance-stabilized carbocation could exist as intermediate (10, 50), employs proton-activated electron transfer, a type of PCET occurring in the Q-cycle of the cytochrome bc1 complex (51). The solvent provides the coupled proton directly or indirectly through neighboring residue(s) (50). We propose that electron donated by Fdred is transferred to FAD via the distal and proximal [4Fe-4S] clusters sequentially and finally to the 7-hydroxymethyl group on the chlorin ring (Fig. 7, C and D). Physiologically, such a consecutive and direct electron pathway within HCAR ensures a safe path of electron to the target site in an oxygenic environment in plant chloroplasts.
The 3-fold symmetry observed in the HCAR trimer (Fig. 3A) is reminiscent of trimerization of LHC-II in plants (52). Because chlorophyll b degradation is essential for LHC-II turnover (11–13), and HCAR directly interacts with LHC-II (14), it is plausible that their similarity reflects a biological function (Fig. 9A). A comparison of the LHC-II stromal surface (53) and the HCAR surface with substrate pockets reveals an electrostatic complementary between them (Fig. 9B). Further studies are needed to elucidate the details of the LHC-II-HCAR interaction. It should be noticed that plant chlorophyll a oxygenase is also predicted to be trimeric (54). In summary, our structural and biochemical analysis provides a deeper understanding and a broader scope for the HCAR-catalyzing reaction.
FIGURE 9.
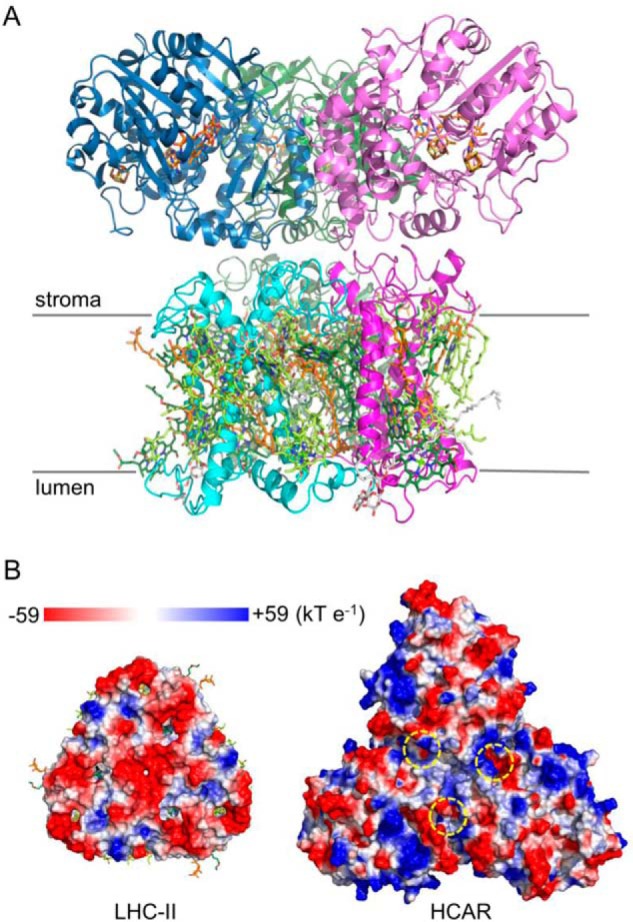
Putative interaction between LHC-II and HCAR. A, model of LHC-II-HCAR complex; view along the thylakoid membrane. LHC-II protomers are colored in light green, cyan, and magenta, respectively. The chlorophyll a, chlorophyll b, carotenoid, and lipid molecules are shown in pale green, green, orange, and gray sticks. HCAR protomers are colored as in Fig. 3A. B, the putative interacting surface in its electrostatic potentials. The entrances of the substrate pockets of HCAR are indicated by yellow dashed circles.
Author Contributions
W. X. performed the experiments; W. X. and L. L. designed the study and wrote the paper.
Acknowledgments
We thank Ming-Zhu Wang at the Institute of Biophysics of the Chinese Academy of Sciences and the staff at Shanghai Synchrotron Radiation Facility for technical support during data collection.
This work was supported by National Basic Research Program of China Grant 2011CBA00901, National Natural Science Foundation of China Grant 31370759, and Key Research Program Grant KGZD-EW-T05 from the Chinese Academy of Sciences. The authors declare that they have no conflicts of interest with the contents of this article.
- LHC
- light-harvesting complex
- HMChl
- 7-hydroxymethyl chlorophyll a
- HCAR
- HMChl reductase
- DVR
- 3,8-divinyl (proto)chlorophyllide a 8-vinyl reductase
- TEV
- tobacco etch virus
- SEC
- size exclusion chromatography
- FNR
- ferredoxin-NADP+-oxidoreductase
- PCET
- proton-coupled electron transfer.
References
- 1. Mochizuki N., Tanaka R., Grimm B., Masuda T., Moulin M., Smith A. G., Tanaka A., and Terry M. J. (2010) The cell biology of tetrapyrroles: a life and death struggle. Trends Plant Sci. 15, 488–498 [DOI] [PubMed] [Google Scholar]
- 2. Rüdiger W. (2002) Biosynthesis of chlorophyll b and the chlorophyll cycle. Photosynth. Res. 74, 187–193 [DOI] [PubMed] [Google Scholar]
- 3. Hörtensteiner S. (2006) Chlorophyll degradation during senescence. Annu. Rev. Plant Biol. 57, 55–77 [DOI] [PubMed] [Google Scholar]
- 4. Tanaka R., and Tanaka A. (2007) Tetrapyrrole biosynthesis in higher plants. Annu. Rev. Plant Biol. 58, 321–346 [DOI] [PubMed] [Google Scholar]
- 5. Hörtensteiner S., and Kräutler B. (2011) Chlorophyll breakdown in higher plants. Biochim. Biophys. Acta 1807, 977–988 [DOI] [PubMed] [Google Scholar]
- 6. Tanaka R., and Tanaka A. (2011) Chlorophyll cycle regulates the construction and destruction of the light-harvesting complexes. Biochim. Biophys. Acta 1807, 968–976 [DOI] [PubMed] [Google Scholar]
- 7. Tanaka A., Ito H., Tanaka R., Tanaka N. K., Yoshida K., and Okada K. (1998) Chlorophyll a oxygenase (CAO) is involved in chlorophyll b formation from chlorophyll a. Proc. Natl. Acad. Sci. U.S.A. 95, 12719–12723 [DOI] [PMC free article] [PubMed] [Google Scholar]
- 8. Espineda C. E., Linford A. S., Devine D., and Brusslan J. A. (1999) The AtCAO gene, encoding chlorophyll a oxygenase, is required for chlorophyll b synthesis in Arabidopsis thaliana. Proc. Natl. Acad. Sci. U.S.A. 96, 10507–10511 [DOI] [PMC free article] [PubMed] [Google Scholar]
- 9. Kusaba M., Ito H., Morita R., Iida S., Sato Y., Fujimoto M., Kawasaki S., Tanaka R., Hirochika H., Nishimura M., and Tanaka A. (2007) Rice NON-YELLOW COLORING1 is involved in light-harvesting complex II and grana degradation during leaf senescence. Plant Cell 19, 1362–1375 [DOI] [PMC free article] [PubMed] [Google Scholar]
- 10. Meguro M., Ito H., Takabayashi A., Tanaka R., and Tanaka A. (2011) Identification of the 7-hydroxymethyl chlorophyll a reductase of the chlorophyll cycle in Arabidopsis. Plant Cell 23, 3442–3453 [DOI] [PMC free article] [PubMed] [Google Scholar]
- 11. Horie Y., Ito H., Kusaba M., Tanaka R., and Tanaka A. (2009) Participation of chlorophyll b reductase in the initial step of the degradation of light-harvesting chlorophyll a/b-protein complexes in Arabidopsis. J. Biol. Chem. 284, 17449–17456 [DOI] [PMC free article] [PubMed] [Google Scholar]
- 12. Shimoda Y., Ito H., and Tanaka A. (2012) Conversion of chlorophyll b to chlorophyll a precedes magnesium dechelation for protection against necrosis in Arabidopsis. Plant J. 72, 501–511 [DOI] [PubMed] [Google Scholar]
- 13. Sakuraba Y., Schelbert S., Park S. Y., Han S. H., Lee B. D., Andrès C. B., Kessler F., Hörtensteiner S., and Paek N. C. (2012) STAY-GREEN and chlorophyll catabolic enzymes interact at light-harvesting complex II for chlorophyll detoxification during leaf senescence in Arabidopsis. Plant Cell 24, 507–518 [DOI] [PMC free article] [PubMed] [Google Scholar]
- 14. Sakuraba Y., Kim Y. S., Yoo S. C., Hörtensteiner S., and Paek N. C. (2013) 7-Hydroxymethyl chlorophyll a reductase functions in metabolic channeling of chlorophyll breakdown intermediates during leaf senescence. Biochem. Biophys. Res. Commun. 430, 32–37 [DOI] [PubMed] [Google Scholar]
- 15. Islam M. R., Aikawa S., Midorikawa T., Kashino Y., Satoh K., and Koike H. (2008) slr1923 of Synechocystis sp. PCC6803 is essential for conversion of 3,8-divinyl(proto)chlorophyll(ide) to 3-monovinyl(proto)chlorophyll(ide). Plant Physiol. 148, 1068–1081 [DOI] [PMC free article] [PubMed] [Google Scholar]
- 16. Künkel A., Vorholt J. A., Thauer R. K., and Hedderich R. (1998) An Escherichia coli hydrogenase-3-type hydrogenase in methanogenic archaea. Eur. J. Biochem. 252, 467–476 [DOI] [PubMed] [Google Scholar]
- 17. Ito H., Yokono M., Tanaka R., and Tanaka A. (2008) Identification of a novel vinyl reductase gene essential for the biosynthesis of monovinyl chlorophyll in Synechocystis sp. PCC6803. J. Biol. Chem. 283, 9002–9011 [DOI] [PubMed] [Google Scholar]
- 18. Liu Z., and Bryant D. A. (2011) Multiple types of 8-vinyl reductases for (bacterio)chlorophyll biosynthesis occur in many green sulfur bacteria. J. Bacteriol. 193, 4996–4998 [DOI] [PMC free article] [PubMed] [Google Scholar]
- 19. Saunders A. H., Golbeck J. H., and Bryant D. A. (2013) Characterization of BciB: a ferredoxin-dependent 8-vinyl-protochlorophyllide reductase from the green sulfur bacterium Chloroherpeton thalassium. Biochemistry 52, 8442–8451 [DOI] [PubMed] [Google Scholar]
- 20. Mills D. J., Vitt S., Strauss M., Shima S., and Vonck J. (2013) De novo modeling of the F420-reducing [NiFe]-hydrogenase from a methanogenic archaeon by cryo-electron microscopy. eLife 2, e00218. [DOI] [PMC free article] [PubMed] [Google Scholar]
- 21. Vitt S., Ma K., Warkentin E., Moll J., Pierik A. J., Shima S., and Ermler U. (2014) The F420-reducing [NiFe]-hydrogenase complex from Methanothermobacter marburgensis, the first x-ray structure of a group 3 family member. J. Mol. Biol. 426, 2813–2826 [DOI] [PubMed] [Google Scholar]
- 22. Allegretti M., Mills D. J., McMullan G., Kühlbrandt W., and Vonck J. (2014) Atomic model of the F420-reducing [NiFe] hydrogenase by electron cryo-microscopy using a direct electron detector. eLife 3, e01963. [DOI] [PMC free article] [PubMed] [Google Scholar]
- 23. Pryor K. D., and Leiting B. (1997) High-level expression of soluble protein in Escherichia coli using a His6-tag and maltose-binding-protein double-affinity fusion system. Protein Expr. Purif. 10, 309–319 [DOI] [PubMed] [Google Scholar]
- 24. Terwilliger T. C., Adams P. D., Read R. J., McCoy A. J., Moriarty N. W., Grosse-Kunstleve R. W., Afonine P. V., Zwart P. H., and Hung L. W. (2009) Decision-making in structure solution using Bayesian estimates of map quality: the PHENIX AutoSol wizard. Acta Crystallogr. D Biol. Crystallogr. 65, 582–601 [DOI] [PMC free article] [PubMed] [Google Scholar]
- 25. Adams P. D., Afonine P. V., Bunkóczi G., Chen V. B., Davis I. W., Echols N., Headd J. J., Hung L. W., Kapral G. J., Grosse-Kunstleve R. W., McCoy A. J., Moriarty N. W., Oeffner R., Read R. J., Richardson D. C., et al. (2010) PHENIX: a comprehensive Python-based system for macromolecular structure solution. Acta Crystallogr. D Biol. Crystallogr. 66, 213–221 [DOI] [PMC free article] [PubMed] [Google Scholar]
- 26. Terwilliger T. C., Grosse-Kunstleve R. W., Afonine P. V., Moriarty N. W., Zwart P. H., Hung L. W., Read R. J., and Adams P. D. (2008) Iterative model building, structure refinement and density modification with the PHENIX AutoBuild wizard. Acta Crystallogr. D Biol. Crystallogr. 64, 61–69 [DOI] [PMC free article] [PubMed] [Google Scholar]
- 27. Emsley P., Lohkamp B., Scott W. G., and Cowtan K. (2010) Features and development of Coot. Acta Crystallogr. D Biol. Crystallogr. 66, 486–501 [DOI] [PMC free article] [PubMed] [Google Scholar]
- 28. Afonine P. V., Grosse-Kunstleve R. W., Echols N., Headd J. J., Moriarty N. W., Mustyakimov M., Terwilliger T. C., Urzhumtsev A., Zwart P. H., and Adams P. D. (2012) Towards automated crystallographic structure refinement with phenix.refine. Acta Crystallogr. D Biol. Crystallogr. 68, 352–367 [DOI] [PMC free article] [PubMed] [Google Scholar]
- 29. Chen V. B., Arendall W. B. 3rd, Headd J. J., Keedy D. A., Immormino R. M., Kapral G. J., Murray L. W., Richardson J. S., and Richardson D. C. (2010) MolProbity: all-atom structure validation for macromolecular crystallography. Acta Crystallogr. D Biol. Crystallogr. 66, 12–21 [DOI] [PMC free article] [PubMed] [Google Scholar]
- 30. Trott O., and Olson A. J. (2010) AutoDock Vina: improving the speed and accuracy of docking with a new scoring function, efficient optimization, and multithreading. J. Comput. Chem. 31, 455–461 [DOI] [PMC free article] [PubMed] [Google Scholar]
- 31. Morris G. M., Huey R., Lindstrom W., Sanner M. F., Belew R. K., Goodsell D. S., and Olson A. J. (2009) AutoDock4 and AutoDockTools4: Automated docking with selective receptor flexibility. J. Comput. Chem. 30, 2785–2791 [DOI] [PMC free article] [PubMed] [Google Scholar]
- 32. Holt A. S. (1959) Reduction of chlorophyllides, chlorophylls and chlorophyll derivatives by sodium borohydride. Plant Physiol. 34, 310–314 [DOI] [PMC free article] [PubMed] [Google Scholar]
- 33. Porra R. J., Thompson W. A., and Kriedemann P. E. (1989) Determination of accurate extinction coefficients and simultaneous equations for assaying chlorophylls a and b extracted with four different solvents: verification of the concentration of chlorophyll standards by atomic absorption spectroscopy. Biochim. Biophys. Acta 975, 384–394 [Google Scholar]
- 34. Ito H., Ohtsuka T., and Tanaka A. (1996) Conversion of chlorophyll b to chlorophyll a via 7-hydroxymethyl chlorophyll. J. Biol. Chem. 271, 1475–1479 [DOI] [PubMed] [Google Scholar]
- 35. Sievers F., Wilm A., Dineen D., Gibson T. J., Karplus K., Li W., Lopez R., McWilliam H., Remmert M., Söding J., Thompson J. D., and Higgins D. G. (2011) Fast, scalable generation of high-quality protein multiple sequence alignments using Clustal Omega. Mol. Syst. Biol. 7, 539. [DOI] [PMC free article] [PubMed] [Google Scholar]
- 36. Touw W. G., Baakman C., Black J., te Beek T. A., Krieger E., Joosten R. P., and Vriend G. (2015) A series of PDB-related databanks for everyday needs. Nucleic Acids Res. 43, D364–D368 [DOI] [PMC free article] [PubMed] [Google Scholar]
- 37. Robert X., and Gouet P. (2014) Deciphering key features in protein structures with the new ENDscript server. Nucleic Acids Res. 42, W320–W324 [DOI] [PMC free article] [PubMed] [Google Scholar]
- 38. Tamura K., Dudley J., Nei M., and Kumar S. (2007) MEGA4: Molecular Evolutionary Genetics Analysis (MEGA) software version 4.0. Mol. Biol. Evol. 24, 1596–1599 [DOI] [PubMed] [Google Scholar]
- 39. Hendrickson W. A. (1991) Determination of macromolecular structures from anomalous diffraction of synchrotron radiation. Science 254, 51–58 [DOI] [PubMed] [Google Scholar]
- 40. Beinert H. (2000) Iron-sulfur proteins: ancient structures, still full of surprises. J. Biol. Inorg. Chem. 5, 2–15 [DOI] [PubMed] [Google Scholar]
- 41. Dym O., and Eisenberg D. (2001) Sequence-structure analysis of FAD-containing proteins. Protein Sci. 10, 1712–1728 [DOI] [PMC free article] [PubMed] [Google Scholar]
- 42. Page C. C., Moser C. C., Chen X., and Dutton P. L. (1999) Natural engineering principles of electron tunnelling in biological oxidation-reduction. Nature 402, 47–52 [DOI] [PubMed] [Google Scholar]
- 43. Thauer R. K., Kaster A. K., Goenrich M., Schick M., Hiromoto T., and Shima S. (2010) Hydrogenases from methanogenic archaea, nickel, a novel cofactor, and H2 storage. Annu. Rev. Biochem. 79, 507–536 [DOI] [PubMed] [Google Scholar]
- 44. Ito H., and Tanaka A. (2014) Evolution of a new chlorophyll metabolic pathway driven by the dynamic changes in enzyme promiscuous activity. Plant Cell Physiol. 55, 593–603 [DOI] [PubMed] [Google Scholar]
- 45. Cotruvo J. A., and Stubbe J. (2011) Class I ribonucleotide reductases: metallocofactor assembly and repair in vitro and in vivo. Annu. Rev. Biochem. 80, 733–767 [DOI] [PMC free article] [PubMed] [Google Scholar]
- 46. Peters J. W., Schut G. J., Boyd E. S., Mulder D. W., Shepard E. M., Broderick J. B., King P. W., and Adams M. W. (2015) [FeFe]- and [NiFe]-hydrogenase diversity, mechanism, and maturation. Biochim. Biophys. Acta 1853, 1350–1369 [DOI] [PubMed] [Google Scholar]
- 47. Belevich I., Verkhovsky M. I., and Wikström M. (2006) Proton-coupled electron transfer drives the proton pump of cytochrome c oxidase. Nature 440, 829–832 [DOI] [PubMed] [Google Scholar]
- 48. Umena Y., Kawakami K., Shen J. R., and Kamiya N. (2011) Crystal structure of oxygen-evolving photosystem II at a resolution of 1.9 Å. Nature 473, 55–60 [DOI] [PubMed] [Google Scholar]
- 49. Weinberg D. R., Gagliardi C. J., Hull J. F., Murphy C. F., Kent C. A., Westlake B. C., Paul A., Ess D. H., McCafferty D. G., and Meyer T. J. (2012) Proton-coupled electron transfer. Chem. Rev. 112, 4016–4093 [DOI] [PubMed] [Google Scholar]
- 50. Folly P., and Engel N. (1999) Chlorophyll b to chlorophyll a conversion precedes chlorophyll degradation in Hordeum vulgare L. J. Biol. Chem. 274, 21811–21816 [DOI] [PubMed] [Google Scholar]
- 51. Migliore A., Polizzi N. F., Therien M. J., and Beratan D. N. (2014) Biochemistry and theory of proton-coupled electron transfer. Chem. Rev. 114, 3381–3465 [DOI] [PMC free article] [PubMed] [Google Scholar]
- 52. Dekker J. P., and Boekema E. J. (2005) Supramolecular organization of thylakoid membrane proteins in green plants. Biochim. Biophys. Acta 1706, 12–39 [DOI] [PubMed] [Google Scholar]
- 53. Liu Z., Yan H., Wang K., Kuang T., Zhang J., Gui L., An X., and Chang W. (2004) Crystal structure of spinach major light-harvesting complex at 2.72 Å resolution. Nature 428, 287–292 [DOI] [PubMed] [Google Scholar]
- 54. Kunugi M., Takabayashi A., and Tanaka A. (2013) Evolutionary changes in chlorophyllide a oxygenase (CAO) structure contribute to the acquisition of a new light-harvesting complex in micromonas. J. Biol. Chem. 288, 19330–19341 [DOI] [PMC free article] [PubMed] [Google Scholar]


