Abstract
Sphingosine-1-phosphate (S1P) is a sphingolipid metabolite that regulates basic cell functions through metabolic and signaling pathways. Intracellular metabolism of S1P is controlled, in part, by two homologous S1P phosphatases (SPPases), 1 and 2, which are encoded by the Sgpp1 and Sgpp2 genes, respectively. SPPase activity is needed for efficient recycling of sphingosine into the sphingolipid synthesis pathway. SPPase 1 is important for skin homeostasis, but little is known about the functional role of SPPase 2. To identify the functions of SPPase 2 in vivo, we studied mice with the Sgpp2 gene deleted. In contrast to Sgpp1−/− mice, Sgpp2−/− mice had normal skin and were viable into adulthood. Unexpectedly, WT mice expressed Sgpp2 mRNA at high levels in pancreatic islets when compared with other tissues. Sgpp2−/− mice had normal pancreatic islet size; however, they exhibited defective adaptive β-cell proliferation that was demonstrated after treatment with either a high-fat diet or the β-cell-specific toxin, streptozotocin. Importantly, β-cells from untreated Sgpp2−/− mice showed significantly increased expression of proteins characteristic of the endoplasmic reticulum stress response compared with β-cells from WT mice, indicating a basal islet defect. Our results show that Sgpp2 deletion causes β-cell endoplasmic reticulum stress, which is a known cause of β-cell dysfunction, and reveal a juncture in the sphingolipid recycling pathway that could impact the development of diabetes.
Keywords: beta cell, diabetes, endoplasmic reticulum stress (ER stress), lysophospholipid, pancreatic islet, sphingosine-1-phosphate (S1P)
Introduction
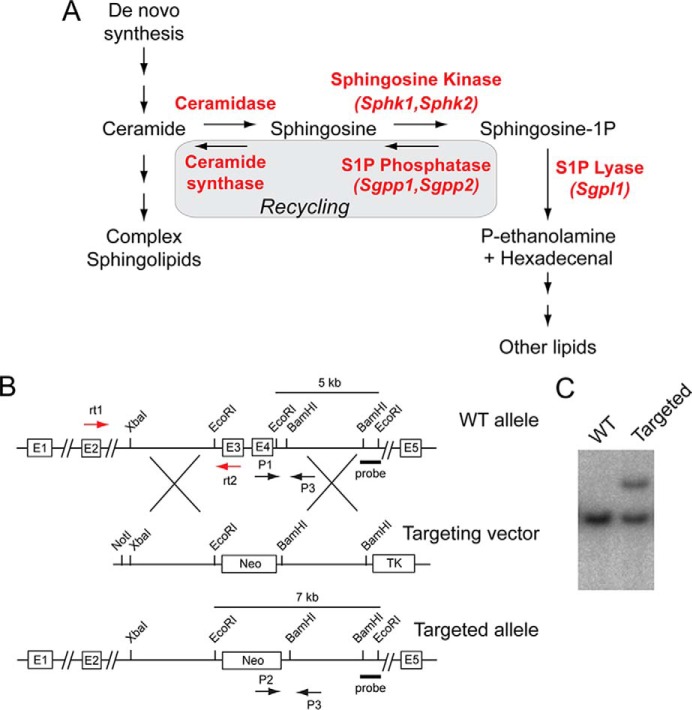
Sphingosine 1-phosphate (S1P)3 is a potent bioactive lipid produced from the degradation of plasma membrane sphingolipids (1–3). As a signaling molecule, S1P exerts effects in a variety of biological processes through interactions with both extracellular receptors and intracellular targets. As an intracellular metabolic intermediate, S1P is readily metabolized to other bioactive sphingolipids, such as ceramide and sphingosine, as well as to other lipids (Fig. 1A).
FIGURE 1.
Generation of Sgpp2−/− mice by Sgpp2 disruption. A, intracellular S1P metabolism pathway. B, schematic representation of the Sgpp2 targeting strategy. The structure of the Sgpp2 locus is shown at the top, the targeting vector is shown in the middle, and the predicted structure of the Sgpp2 targeted allele is shown at the bottom. The black arrows P1, P2, and P3 represent the primers used for genotyping. The red arrows rt1 and rt2 represent the primers used in semiquantitative real-time PCR. The BamHI-EcoRI fragment used as the 3′ external probe is marked. C, Southern blot analysis of EcoRI-digested genomic DNA from targeted embryonic stem cells hybridized with the indicated probe, showing a correctly targeted clone (Targeted) and a non-targeted clone (WT).
S1P and its metabolites control basic cell functions, such as proliferation, apoptosis, and migration, and are involved in several pathologic conditions, including inflammation, metabolic disease, and cancer (1, 2). Thus, insight into S1P metabolism and how this regulates its functional activity is of key importance in understanding the role of S1P in biology and disease.
S1P is produced by the sphingosine kinase-dependent phosphorylation of sphingosine, which is created as a degradation product of ceramide (4). Within cells, S1P is degraded through two pathways, either by irreversible cleavage by S1P lyase (5) or by dephosphorylation by specific S1P phosphatases (SPPases) (also known as S1P phosphohydrolases) (6). When cleaved by S1P lyase (Sgpl1), phosphoethanolamine and hexadecenal are produced, which are then transferred as substrates from the sphingolipid pathway to the glycerophospholipid pathway.
In an alternative catabolic route catalyzed by S1P phosphatases, the resulting sphingosine product can be derivatized with a fatty acid by ceramide synthase to produce ceramide by the sphingolipid salvage or recycling pathway (7). The metabolism of S1P constitutes a key point in the sphingolipid pathway in which substrate may either leave or be retained within the pathway, thus regulating the homeostatic flux of three bioactive sphingolipid metabolites: S1P, sphingosine, and ceramide.
In mammals, two homologous genes, Sgpp1 and Sgpp2, encode the specific S1P phosphastases (8, 9) that belong to the superfamily of lipid phosphatases (6, 10, 11). Unlike the other lipid phosphatases in the family, which have broad substrate specificity, the SPPases are unique in that they are highly specific for sphingoid base phosphates. Both isozymes reside in the endoplasmic reticulum (ER) and have similar activities and substrate specificities, although they are differentially expressed in tissues (8, 9). Deletion of the Sgpp1 gene encoding SPPase 1 in mice has been found to elevate S1P specifically in keratinocytes, triggering premature keratinocyte differentiation and leading to ichthyosis and death within a few days after birth (12). Little is known about the in vivo function of SPPase 2.
To identify physiologic functions of SPPase 2, we have generated and studied mice with a deletion of the Sgpp2 gene. Unexpectedly, these mutant mice exhibited decreased adaptive β-cell proliferation. In addition, the β-cells in Sgpp2−/− mice were found to display significantly increased expression of markers of ER stress, which is known to cause β-cell dysfunction and is thought to contribute to the pathogenesis of diabetes (13, 14). These results reveal for the first time that SPPase 2 is an important factor in regulating β-cell ER stress and proliferation.
Experimental Procedures
Generation of Sgpp2−/− Mice
A genomic bacterial artificial chromosome clone containing the mouse Sgpp2 locus was isolated from the RPCI-22 (129S6/SvEvTac) mouse bacterial artificial chromosome library (Children's Hospital Oakland Research Institute, Oakland, CA). Mouse Sgpp2 consists of five exons (Fig. 1B). A 5.6-kb XbaI and EcoRI fragment upstream of exon 3 (5′-arm) and a 4.3-kb BamHI fragment downstream of exon 4 (3′-arm) were used to construct the targeting vector. This targeting strategy deletes a portion of the Sgpp2 gene that includes the three conserved lipid phosphatase motifs encoded within exons 3 and 4. A neomycin gene cassette was placed between both arms, and the HSV thymidine kinase expression gene was located outside of the homologous sequence to prevent random integration. TC-1 embryonic stem cells were electroporated with the linearized targeting vector. G418- and FIAU (1-(2′-deoxy-2′-fluoro-1-β-d-arabinofuranosyl)-5-iodouracil)-resistant clones were screened for proper integration of the targeting construct via Southern blotting, using EcoRI-digested DNA and an external 3′ probe (shown in Fig. 1B). Properly targeted embryonic stem cell clones (Fig. 1C) were microinjected into C57BL/6 mouse blastocysts to generate chimeric mice. Highly chimeric males were mated with WT C57BL/6 females to obtain F1 offspring. Heterozygous male mice were back-crossed to WT female C57BL/6 mice for seven generations. Mice were genotyped by PCR of tail snip DNA using three primers (shown in Fig. 1B): P1 (5′-TCACCTTGGGTCACTCCTGA-3′), P2 (5′-ATCGCCTTCTATCGCCTTCTTG-3′), and P3 (5′-ATGGTGTTCCTGTGGCAAAC-3′). The following conditions were used: denaturation, 94 °C for 10 min; amplification, 94 °C for 1 min, 57 °C for 1 min, 72 °C for 1.5 min; and extension, 72 °C for 7 min (35 cycles). The expected product size for the WT allele is 366 bp, and that for the targeted allele is 638 bp.
Mice were given ad libitum access to normal chow or, when indicated, placed on a high-fat diet (HFD) (45% fat; D12451, Research Diets, Inc. (New Brunswick, NJ)) at 4 weeks of age for 20 weeks. Sgpp1−/− mice have been described previously (12). Streptozotocin (STZ)-induced islet regeneration experiments were performed as described (15). All mouse experiments were approved by the Animal Care and Use Committee of the NIDDK, National Institutes of Health.
Biochemical and Metabolic Determinations
Blood glucose levels were determined from tail vein blood using a glucometer (Accu-Chek, Roche Applied Science). Blood insulin levels were measured in serum (obtained from tail vein blood) by radioimmunoassay (Linco Research Inc., St. Charles, MO).
For glucose tolerance testing, mice fasted overnight were injected intraperitoneally with glucose (1 g/kg body weight), and tail vein blood glucose and insulin were measured immediately before and 2, 5, 15, and 30 min after injection. For insulin tolerance testing, mice fasted overnight were injected intraperitoneally with insulin (0.75 units/kg body weight), and tail vein blood glucose was measured immediately before and 15, 30, 45, 60, and 90 min after injection. Mouse islets were isolated as described (16).
Gene Expression
Total RNA from islets (100 isolated islets), brain, kidney, small intestine, colon, and lung was purified using TRIzol (Life Technologies, Inc.). Total RNA (1 μg) was digested with DNase I and then subsequently reverse-transcribed with the SuperScript First-Strand Synthesis System (Life Technologies) according to the manufacturer's instructions.
For semiquantitative RT-PCR, the forward primer (rt1, 5′-CTATTACCTGTTCCGGTTTTCAGC-3′) was located on exon 2 of the Sgpp2 transcript, and the reverse primer (rt2, 5′-CTCTTTTCAAGTCTCACAACGGG-3′) was located on exon 3 (Fig. 1B). The following conditions were used: denaturation, 95 °C for 5 min; amplification, 95 °C for 1 min, 55 °C for 1 min, 72 °C for 1 min; and extension, 72 °C for 7 min (35 cycles). For amplification of Gapdh mRNA, the forward primer was at the exon 4–5 junction (5′-ACCACAGTCCATGCCATCAC-3′), and the reverse primer was in exon 7 (5′-CACCACCCTGTTGCTGTAGCC-3′). The following conditions were used: denaturation, 95 °C for 5 min; amplification, 95 °C for 1 min, 65 °C for 1 min, 72 °C for 1 min; and extension, 72 °C for 7 min (35 cycles). PCR products were visualized on a 1.2% agarose gel.
Alternatively, mRNA expression levels were determined by real-time quantitative PCR using predesigned Assay-on-Demand probes and primers (Applied Biosystems, Foster City, CA) on an ABI Prism 7700 sequence detection system (Applied Biosystems) for mouse Sgpp2 (Mm01158866_m1), Sgpp1 (Mm00473016_m1), Sphk1 (Mm00448841_g1), Sphk2 (Mm00445020_m1), Sgpl1 (Mm00473016_m1), and Gapdh (Mm99999915_g1).
For microarray analysis, total RNA purified from isolated islets of 2-month-old mice was analyzed on Affymetrix GeneChip Mouse Genome 430 2.0 arrays (Affymetrix, Santa Clara, CA) as described previously (17). The National Center for Biotechnology Information Gene Expression Omnibus (GEO) accession number for the microarray data is GSE73131.
SPPase Assay
The assay was adapted from Maceyka et al. (18) and Mechtcheriakova et al. (19). Briefly, HEK293 cells were infected with adenovirus encoding either SGPP2 (VH813592, Vigene, Rockville, MD) or GFP (CV10001, Vigene). After 48 h, cells were scraped and lysed in Phosphatase Buffer (100 mm HEPES, pH 7.5, 10 mm EDTA, 1 mm DTT, and protease inhibitor mixture (Roche Applied Science)) by freeze-thaw cycles. After removal of cellular debris by centrifugation at 1,500 × g for 5 min at 4 °C, the membrane fraction was obtained by centrifugation of the supernatant at 100,000 × g for 1 h at 4 °C. The membrane pellet was resuspended in Phosphatase Buffer. Alternatively, lungs from Sgpp2+/+ and Sgpp2−/− mice were disrupted, and membrane fractions were prepared as described above. Membrane fractions (10 μg for HEK293 cells or 1 μg for lungs) were mixed with 5 μm ω(7-nitro-2–1,3-benzoxadiazol-4-yl)-S1P (NBD-S1P) (810207X, Avanti (Alabaster, AL)) and incubated at 37 °C for 25 or 10 min, respectively. To stop the reaction, 400 μl of PBS and 700 μl of chloroform, methanol, HCl, 5 m NaCl (300:300:7:100, v/v/v/v) were added. After centrifugation, organic phases were separated, dried, and resolved by TLC on silica gel 60, high performance TLC plates (EMD-Millipore, Billerica, MA) with 1-butanol/acetic acid/water (3:1:1, v/v/v). NBD-S1P and NBD-sphingosine (810205, Avanti) were visualized using the LAS-1000 Plus luminescent image analyzer (Fujifilm, Japan) and quantified using Image Gauge (FujiFilm).
Immunohistochemistry
Mouse pancreas tissue was dissected, fixed with 10% formalin solution at 4 °C overnight, and embedded in paraffin. For immunostaining, deparaffinized sections were incubated with the following antibodies: mouse anti-human insulin (clone E11D7, EMD-Millipore), anti-glucagon (Dako, Glostrup, Denmark), anti-mouse Ki67 (MIB-1, Dako), rabbit anti-Bip (NB100-56411, Novusbio, Littleton, CO), or rabbit anti-Dnajc3 (bs-1863R, BiossAntibodies, Woburn, MA), followed by the appropriate conjugated secondary antibodies. For BrdU immunodetection, a BrdU staining kit was used (93-3943, Invitrogen).
A pancreatic morphometric analysis was performed as described (20, 21). Pancreas tissue was dissected, weighed, and embedded into two paraffin blocks. Sections from two random layers, at least 150 μm apart, from each block were stained with H&E, for a total of 4 sections/mouse. Whole islets were recognized by their distinctive morphology after H&E staining. Images (×5) of whole pancreas (>20 images/section) were captured from each mouse. β-Cells and α-cells were detected by double immunostaining using anti-insulin and anti-glucagon antibodies. Images (×40) were captured (>10 images/section). The area corresponding to whole pancreas, total islets, β-cells, and α-cells was determined from images using ImageJ software (version 1.56, National Institutes of Health, Bethesda, MD). Mass was calculated as the area corresponding to the following: (total islets, β-cells, or α-cells (mm2)/whole pancreas area (mm2)) × pancreas weight (mg). An Axio-Imager A1 microscope equipped with digital camera (Carl Zeiss, Tokyo) was used to capture the images.
To identify proliferating cells among the β-cells, we performed immunohistochemical double staining of Ki67 or BrdU and insulin. The percentage of proliferating cells was determined by counting the number of clearly stained nuclei among 300–400 β-cells.
For apoptosis detection by TUNEL staining, sections were labeled with the Apoptag apoptosis detection kit (Millipore), and 300–400 β-cells/section were examined for TUNEL-positive nuclei.
Fluorescently stained sections were examined using a confocal laser-scanning microscope (LSM 780, Carl Zeiss, Inc., Thornwood, NY). Images were acquired using the Zen 2012 software (Carl Zeiss).
Sphingolipid Analysis
S1P, sphingosine, and ceramides were measured by HPLC-tandem MS by the Lipidomics Core at the Medical University of South Carolina on a Thermo Finnigan TSQ 7000 triple quadrupole mass spectrometer (Thermo Fisher Scientific), operating in a multiple-reaction monitoring-positive ionization mode as described (22).
Statistical Analysis
Statistical significance for two-way comparisons was determined using Student's t test. For multiple comparisons, one-way analysis of variance followed by Tukey's multiple-comparisons test was used. In all cases, p < 0.05 was considered statistically significant.
Results
Targeted Disruption of Sgpp2
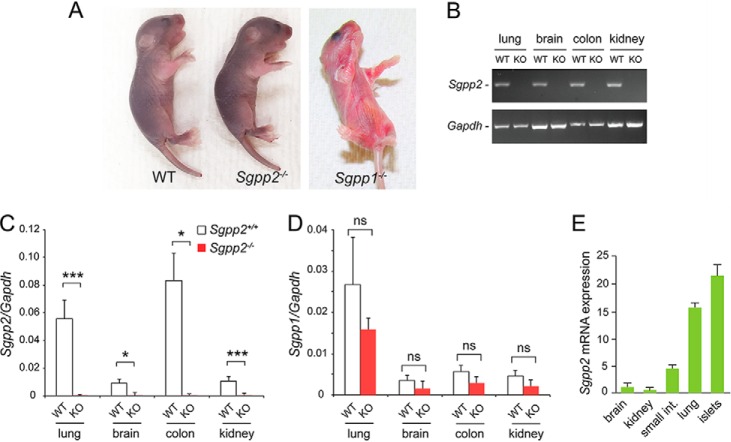
The Sgpp2 gene was targeted in mouse embryonic stem cells by homologous recombination, and exons 3 and 4, containing the conserved phosphatase motif (6), were deleted (Fig. 1, B and C). Sgpp2+/− mice were obtained, and, after cross-breeding, homozygotes were obtained in the expected Mendelian ratio. Unlike Sgpp1−/− mice, which have ichthyotic skin and generally survived for a few days after birth (12), the Sgpp2−/− mice had normal skin appearance (Fig. 2A). Further, the homozygous Sgpp2−/− mice were fertile and lived for >1 year.
FIGURE 2.
Sgpp2 mRNA is differentially expressed in tissues. A, Sgpp2−/− mice at 4 days after birth showed normal skin appearance and morphology (middle mouse) similar to WT mice (mouse on the left). In contrast, Sgpp1−/− mice (mouse on the right) displayed severe ichthyosis. B, mRNA expression for Sgpp2 (top gel) and Gapdh (bottom gel) determined by semiquantitative real-time PCR of various tissues from Sgpp2+/+ (WT) and Sgpp2−/− (KO) mice. C and D, relative mRNA expression, normalized to Gapdh mRNA expression, for Sgpp2 (C) and Sgpp1 (D) was determined by quantitative real-time PCR of various tissues from Sgpp2+/+ (WT) and Sgpp2−/− (KO) mice. Bars, mean ± S.D. (error bars); Student's t test, n = 4 for each genotype. *, p < 0.05; **, p < 0.01; ***, p < 0.001; ns, not significant. E, Sgpp2 mRNA expression was determined by quantitative real-time PCR in various tissues from WT mice. Values are shown as the relative level of Sgpp2 mRNA normalized to Gapdh mRNA expression with brain Sgpp2 set to 1. Bars, mean ± S.D.; n = 3.
Tissues of the Sgpp2−/− mice failed to express detectable Sgpp2 mRNA, indicating that the targeting procedure resulted in a null Sgpp2 allele (Fig. 2, B and C). A significant compensatory increase of Sgpp1 expression was not observed in the tissues from the Sgpp2−/− mice (Fig. 2D). Because Sgpp2 RNA has been reported to be differentially expressed among tissues (9), we examined Sgpp2 mRNA in brain, kidney, small intestine, lung, and pancreatic islets of WT mice (Fig. 2E) to identify tissues in which Sgpp2 might have a functional role. Notably, pancreatic islets had the highest level of Sgpp2 mRNA expression, representing more than 20 times the levels observed in brain (Fig. 2E).
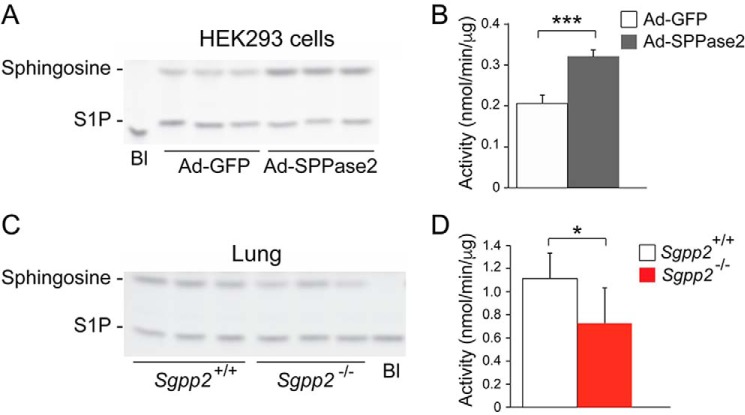
For the detection of SPPase enzymatic activity, an in vitro assay utilizing NBD-S1P as substrate was validated by showing significantly increased SPPase activity in the membrane fraction of adenovirus-infected HEK293 cells overexpressing SPPase 2 compared with membranes from adenovirus-infected cells overexpressing GFP (Fig. 3, A and B). Using this assay on the membrane fraction from lung tissue, an ∼30% decrease in total SPPase activity in Sgpp2−/− mice compared with Sgpp2+/+ mice was detected (Fig. 3, C and D).
FIGURE 3.
SPPase activity in Sgpp2+/+ and Sgpp2−/− mice. Membrane fractions prepared from HEK293 cells infected with Ad-SPPase2 or Ad-GFP (A and B) or from lungs of Sgpp2+/+ and Sgpp2−/− mice (C and D) were incubated with NBD-S1P as described under “Experimental Procedures.” Lipids were extracted and resolved by high performance TLC. NBD-S1P and NBD-sphingosine were visualized using a Fuji luminescent image analyzer and quantified. Shown are representative images of the reaction products (A and C) and activity levels (B and D). Bl, blank; reaction without membrane fraction. n = 3. *, p < 0.05; ***, p < 0.001. Error bars, S.D.
Analysis of circulating sphingolipid levels in the plasma of Sgpp2+/+ and Sgpp2−/− mice by MS revealed similar levels of total ceramide, S1P, dihydro-S1P, sphingosine, dihydrosphingosine, and various ceramide species with different fatty acid chain lengths (Fig. 4, A and B).
FIGURE 4.
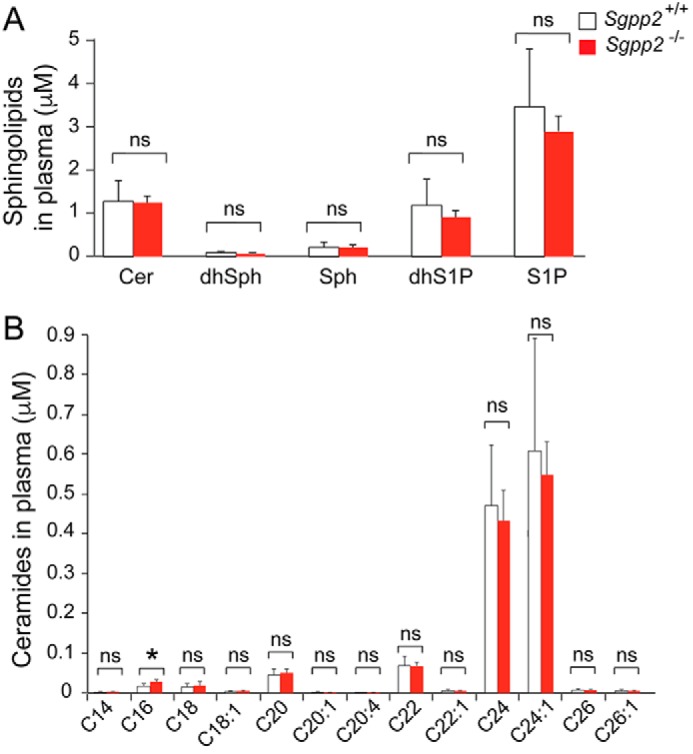
Sphingolipid profiles of Sgpp2+/+ and Sgpp2−/− mouse plasma are similar. The sphingolipid profile was determined by HPLC-tandem MS on plasma obtained from Sgpp2+/+ and Sgpp2−/− mice. Levels of total ceramide (Cer), dihydrosphingosine (dhSph), sphingosine (Sph), dihydro-S1P, and S1P (A) and individual ceramide species with different fatty acid chain lengths (B) were determined. Bars, mean ± S.D. (error bars); Student's t test, n = 5 for each genotype. *, p < 0.05; ns, not significant.
HFD-treated Sgpp2−/− Mice Exhibited Smaller Islets and Reduced β-Cell Proliferation
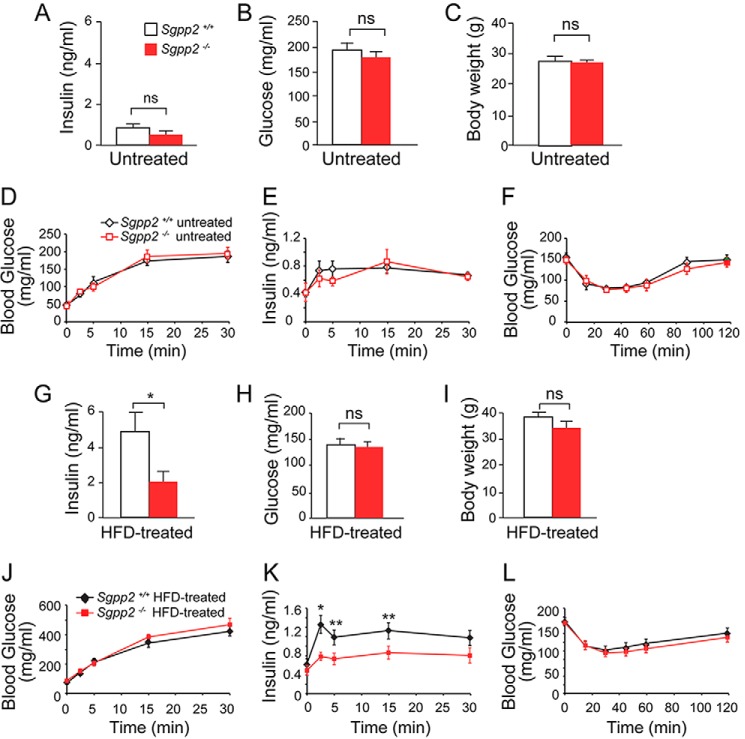
Because of the relatively high levels of Sgpp2 mRNA expression in pancreatic islets, we focused our attention on a possible islet-related phenotype. Fed blood insulin and glucose levels in Sgpp2+/+ and Sgpp2−/− mice were found not to be significantly different (Fig. 5, A and B). The mean body weight of the two genotypes was also similar (Fig. 5C). In glucose tolerance tests, the glucose and insulin responses were similar for the two genotypes (Fig. 5, D and E). Insulin tolerance tests demonstrated that insulin sensitivity was also similar in the two genotypes (Fig. 5F).
FIGURE 5.
Altered insulin levels in HFD treated Sgpp2−/− mice. Shown are blood insulin (A and G), glucose (B and H), and body weight (C and I) in untreated (A–C) and HFD-treated (G–I) mice; blood glucose (D and J) and insulin (E and K) levels in overnight fasted untreated (D and E) or HFD-treated (J and K) mice subjected to glucose tolerance tests; and blood glucose levels in overnight fasted untreated (F) and HFD-treated (L) mice subjected to insulin tolerance tests. Data represent mean ± S.D. (error bars); Student's t test; n = 5 for untreated mice of each genotype; n = 10–12 for HFD-treated mice of each genotype. *, p < 0.05; **, p < 0.01; ns, not significant.
However, after Sgpp2+/+ and Sgpp2−/− mice were placed on an HFD for 20 weeks, differences between the two groups were observed. The HFD-induced increase of fed blood insulin levels seen in the Sgpp2+/+ mice was significantly blunted in the Sgpp2−/− mice (Fig. 5G). Blood glucose and body weight remained similar between the two groups after the HFD treatment (Fig. 5, H and I).
Glucose tolerance testing of HFD-treated mice demonstrated similar blood glucose levels in the two genotypes (Fig. 5J). However, insulin responses to glucose challenge were significantly different between the two groups of HFD-treated mice, with the Sgpp2+/+ mice exhibiting significantly higher blood insulin levels than the Sgpp2−/− mice (Fig. 5K).
Last, when we performed insulin tolerance tests on HFD-treated groups of mice, no significant difference in insulin sensitivity between Sgpp2+/+ and Sgpp2−/− mice was observed (Fig. 5L). These data suggest that the lower level of insulin release upon glucose challenge in Sgpp2−/− mice was not due to heightened insulin sensitivity and pointed to a possible islet defect.
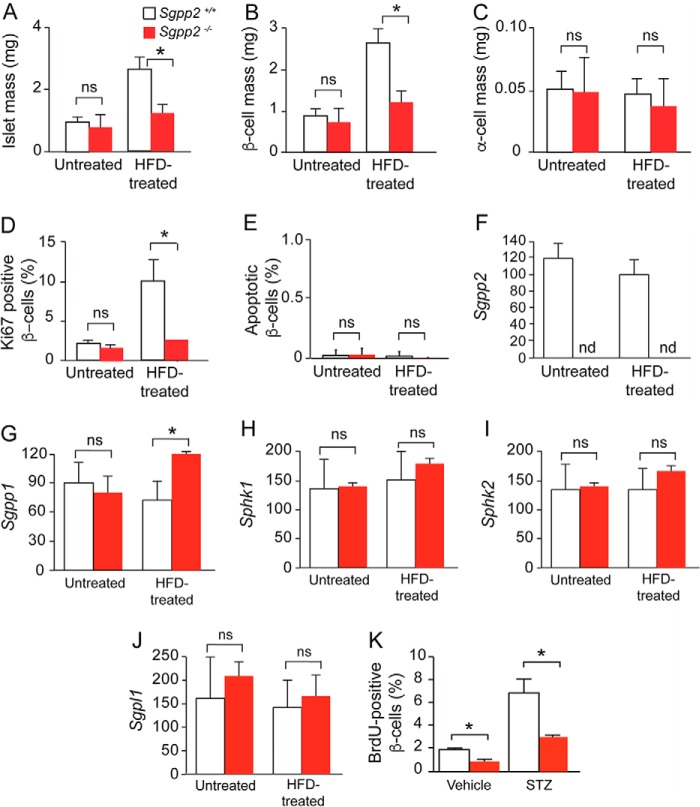
We next examined pancreatic islet mass in Sgpp2+/+ and Sgpp2−/− mice (Fig. 6, A–C). Mean islet mass of Sgpp2+/+ and Sgpp2−/− mice fed a normal diet was not significantly different (Fig. 6A). After administration of an HFD, which in known to promote adaptive β-cell proliferation (23), both genotypes showed an increase of islet mass; however, the mean islet mass for Sgpp2+/+ mice was ∼2-fold greater than that of the Sgpp2−/− mice (Fig. 6A). We next determined the mass of β-cells and α-cells by staining islets with anti-insulin and anti-glucagon antibodies, respectively. In untreated mice, neither mean β-cell mass nor α-cell mass was significantly different between Sgpp2+/+ and Sgpp2−/− mice (Fig. 6, B and C). However, after HFD treatment, the mean β-cell mass of Sgpp2+/+ mice was ∼2-fold greater than that of Sgpp2−/− mice, whereas mean α-cell mass was not significantly different between the two genotypes (Fig. 6, B and C).
FIGURE 6.
Decreased mass and proliferation of β-cells in Sgpp2−/− mice is in response to HFD treatment. A–C, total islet mass (A), β-cell mass (B), and α-cell mass (C) in untreated and HFD-treated Sgpp2+/+ and Sgpp2−/− mice. The area corresponding to total islets, β-cells, and α-cells per pancreas section was determined using ImageJ software and expressed in mg. D, proliferative marker Ki67 expression in islet β-cells from untreated and HFD-treated Sgpp2+/+ and Sgpp2−/− mice. Results are shown as a percentage of Ki67-positive/insulin-positive cells. E, apoptosis was detected by TUNEL staining. Results are shown as a percentage of TUNEL-positive/insulin-positive cells. Bars, mean ± S.D.; Student's t test; n = 4 for each genotype under each treatment. F–J, islet mRNA expression for Sgpp2 (F), Sgpp1 (G), Sphk1 (H), Sphk2 (I), and Sgpl1 (J) was determined by quantitative real-time PCR from Sgpp2+/+ and Sgpp2−/− mice. Bars, mean relative to that of untreated Sgpp2−/− expression ± S.D. (error bars); n = 3 for each genotype; one-way analysis of variance followed by Tukey's multiple-comparison test. ns, not significant; *, p < 0.05. K, decreased proliferation of β-cells in Sgpp2−/− mice in response to STZ-induced islet damage. Sgpp2+/+ and Sgpp2−/− mice were intraperitoneally injected with vehicle or 150 mg/kg STZ, followed by two injections of BrdU. After 2 days, pancreata were dissected, sectioned, and stained with anti-BrdU and anti-insulin antibodies. The number of BrdU-positive, insulin-positive cells were quantified and expressed as percentage of total insulin-positive cells. Bars, mean ± S.D.; Student's t test; n = 3 mice for each genotype. *, p < 0.05.
Cell proliferation and cell death are key factors influencing β-cell mass (23, 24). To examine the contribution of these factors to the changes in β-cell mass observed, we first determined the proliferative index of β-cells by immunostaining with an antibody against the proliferation marker, Ki67 (Fig. 6D). No significant difference was seen in the proliferative index of β-cells between untreated Sgpp2+/+ and Sgpp2−/− mice (Fig. 6D). After HFD treatment, both the Sgpp2+/+ and Sgpp2−/− mice demonstrated increased β-cell hyperplasia, with the proliferative index of the Sgpp2+/+ mice being significantly higher than that of the Sgpp2−/− mice (Fig. 6D).
Next, we determined whether apoptosis was different in β-cells before and after HFD treatment using TUNEL assays. Apoptotic cells were rarely found in either genotype, and the percentage of apoptotic cells was not significantly different between the genotypes under either treatment (Fig. 6E). Together, these results suggest that Sgpp2 deletion controls islet size by reducing β-cell proliferation in response to HFD rather than by increasing apoptosis.
The relative mRNA levels of enzymes directly involved in S1P metabolism were determined in Sgpp2+/+ and Sgpp2−/− islets from untreated and HFD-treated mice (Fig. 6, F–J). Sgpp2 mRNA was undetectable in Sgpp2−/− islets, confirming the null allele (Fig. 6F). Sgpp1 mRNA levels were similar between the untreated Sgpp2+/+ and Sgpp2−/− mice and significantly increased in Sgpp2−/− islets relative to the Sgpp2+/+ islets after HFD treatment (Fig. 6G). Relative mRNA levels of the sphingosine kinases (Sphk1 and Sphk2) and S1P lyase (Sgpl1) were similar between the two genotypes under untreated or HFD-treated conditions (Fig. 6, H–J).
Sgpp2−/− Mice Have Reduced β-Cell Proliferation in Response to STZ Treatment
To determine whether the β-cell proliferation defect in Sgpp2−/− mice was independent of HFD conditions, we induced adaptive β-cell proliferation by triggering islet regeneration after damage with STZ, a β-cell-specific toxin (Fig. 6K). β-Cell proliferation is rapidly stimulated during regeneration of the STZ-damaged islets. Sgpp2+/+ and Sgpp2−/− mice were treated with a single dose of STZ or vehicle, and proliferating cells were labeled by administration of BrdU to the mice. The pancreata were harvested 3 days after STZ treatment, and the islets were stained for insulin and BrdU. STZ treatment increased the numbers of BrdU-positive β-cells in both genotypes; however, the Sgpp2+/+ islets contained significantly more proliferating β-cells than the Sgpp2−/− islets (Fig. 6K).
β-Cells from Sgpp2−/− Mice Expressed Increased ER Stress Markers
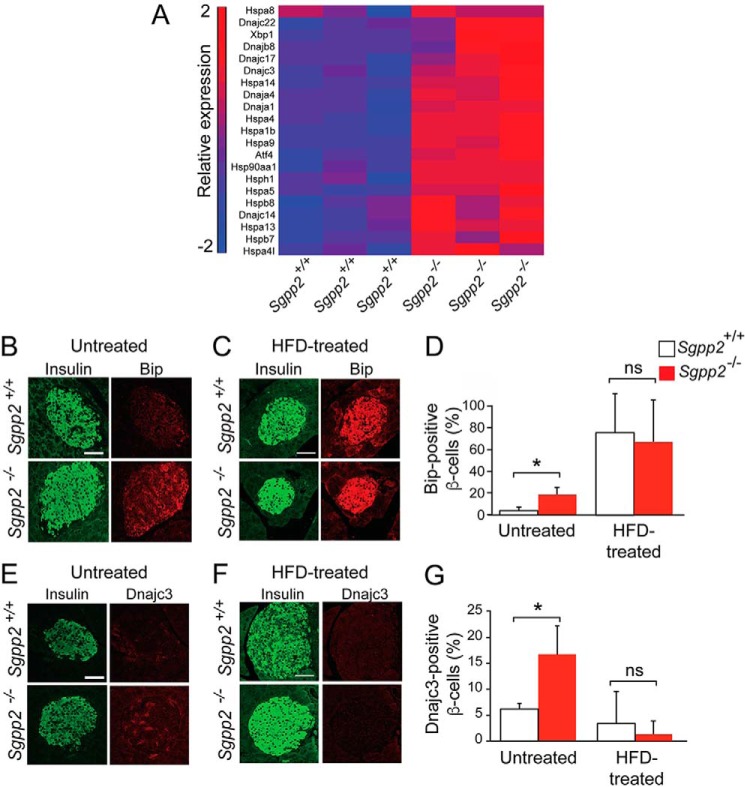
The reduction in adaptive proliferation of Sgpp2−/− β-cells after both HFD and STZ treatments suggests that the Sgpp2−/− β-cells have an intrinsic defect that limits adaptive proliferation. To identify the underlying nature of the defect, transcriptional profiling of islets from untreated 8-week-old Sgpp2+/+ and Sgpp2−/− mice was performed. The analysis revealed a substantial number of significantly elevated genes encoding transcription factors, heat shock proteins, and chaperones involved in cellular stress responses (Fig. 7A). These included some genes characterized to be up-regulated during the unfolded protein response (UPR) initiated by ER stress, such as Hspa5 (GRP70 and Bip) and Dnajc3 (25). To confirm that an ER stress response was indeed increased in Sgpp2−/− β-cells, we co-immunostained pancreas sections with antibodies directed against Hspa5 or Dnajc3, together with an anti-insulin antibody to identify islet β-cells. A significantly higher percentage of β-cells in Sgpp2−/− islets were positive for Hspa5 and Dnajc3 than in Sgpp2+/+ islets (Fig. 7, B, D, E, and G), suggesting that Sgpp2 deletion stimulates ER stress. Differences in the expression of these stress markers between Sgpp2−/− and Sgpp2−/− β-cells were not found after HFD treatment (Fig. 7, C, D, F, and G).
FIGURE 7.
ER stress response marker expression is increased in β-cells from Sgpp2−/− mice. A, microarray gene expression analysis was performed with RNA from islets isolated from untreated Sgpp2+/+ and Sgpp2−/− mice (n = 3 for each genotype). The heat map shows the raw signal values of genes encoding for UPR markers that are significantly increased in Sgpp2−/− mice, using a cut-off of p < 0.05 and a -fold change of 1.2. B–G, expression of Hspa5 (Bip) and Dnajc3 in β-cells. Sections from pancreas of untreated Sgpp2+/+ and Sgpp2−/− mice (B and E) or HFD-treated mice (C and F) were stained with anti-Hspa5 (Bip) (B and C) or Dnajc3 (E and F) and anti-insulin antibodies. Representative images of islets from Sgpp2+/+ (top panels) and Sgpp2−/− (bottom panels) mice are shown. The number of Hspa5 (Bip)- or Dnajc3-positive β-cells were quantified and expressed as a percentage of total insulin-positive cells per islet (D and G). Bars, mean ± S.D. (error bars); Student's t test; n = 3 mice for each genotype. *, p < 0.05. Scale bar, 50 μm.
Islet Sphingolipid Levels
Sphingolipid levels of pancreatic islets from untreated Sgpp2+/+ and Sgpp2−/− mice were determined (Fig. 8). S1P, sphingosine, and dihydrosphingosine levels were not significantly different (Fig. 8A). Most ceramide species were also similar between the two groups of mice; however, the very long chain ceramide species containing C26 and C26:1 fatty acids were significantly lower in Sgpp2−/− islets compared with Sgpp2+/+ islets (Fig. 8B).
FIGURE 8.
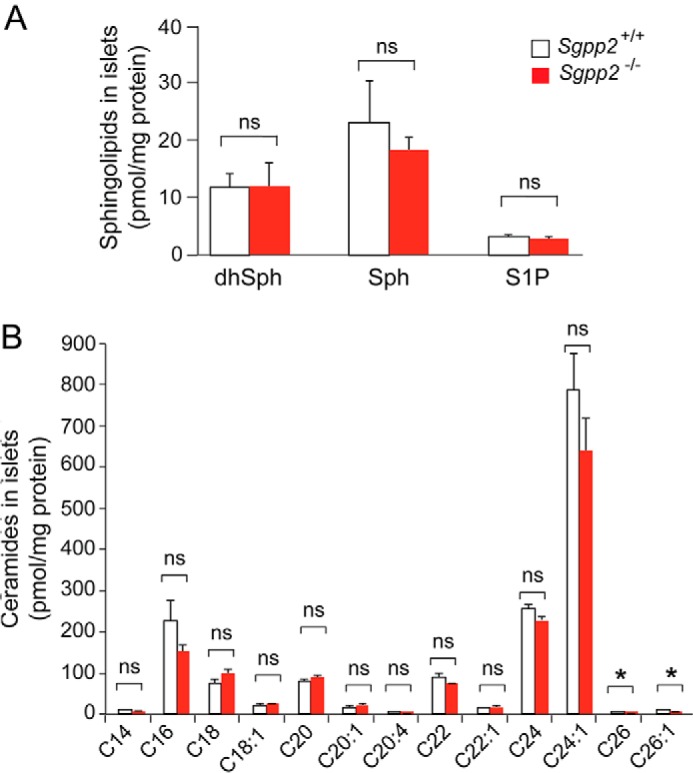
Sphingolipid profile of Sgpp2+/+ and Sgpp2−/− mouse islets. The sphingolipid profile was determined by HPLC-tandem MS on three pooled islet samples, each obtained from Sgpp2+/+ and Sgpp2−/− mice. Each pool contained the islets isolated from 10 mice. Levels of dihydrosphingosine (dhSph), sphingosine (Sph), and S1P (A) and of individual ceramide species with different fatty acid chain lengths (B) were determined. Bars, mean ± S.D. (error bars); Student's t test; n = 3 for each genotype. *, p < 0.05; ns, not significant.
Discussion
Our understanding of how the regulation of intracellular S1P metabolism affects biological processes is limited, prompting us to examine the consequences of Sgpp2 deletion in mice. In contrast to the newborn lethality and skin abnormalities found with the deletion of the homologous Sgpp1 gene (12), Sgpp2−/− mice were viable and without any apparent skin defects at birth or during adulthood. However, we identified an unexpected pancreatic islet defect in Sgpp2−/− mice. Because the two S1P phosphatase enzymes are catalytically very similar and have the same subcellular location (9, 26), this divergence in the phenotypes may point to alternative regulation of the two genes, depending on physiological context. This notion is in line with the differential tissue mRNA expression of Sgpp1 and Sgpp2 (8, 9) and the highly divergent expression of the two genes in response to inflammatory stimuli (27).
Although Sgpp2 was deleted globally in the Sgpp2−/− mice that we developed, no difference was observed in the bulk circulating levels of its substrate, S1P, in their plasma or islets compared with those of WT mice. The normal S1P levels would indicate that extracellular S1P signaling in the Sgpp2−/− mice was not altered. The lack of detectable accumulation of S1P in the absence of Sgpp2 in vivo may be a result of the multiple pathways available for S1P degradation. Excess S1P may be shunted into the alternative lyase degradation pathway or degraded through compensatory mechanisms involving the catalytically similar SPPase 1 or other lipid phosphatase activities that are present in the Sgpp2−/− mice.
Mice adaptively respond with heightened proliferation of β-cells after treatment with an HFD diet or STZ-induced islet damage (23). The Sgpp2−/− mice were defective under both conditions, suggesting the presence of a basal defect in Sgpp2−/− mice affecting the ability of their β-cells to adaptively proliferate. Importantly, in the absence of any treatment, β-cells from Sgpp2−/− mice exhibited markers indicating an elevated basal ER stress response. Higher levels of ER stress compromise β-cell function, survival, and proliferation (21, 28, 29). Thus, the lack of an enzyme thought to negatively regulate the levels of a pro-proliferative lipid signal, S1P, causes ER stress and, instead, compromises proliferation. How might the lack of Sgpp2 induce ER stress in β-cells? Depletion of SPPase activity through knockdown of the homologous Sgpp1 gene has previously been shown to elevate ER stress responses in diverse types of cultured cells (30). In that study, the major pathways of the UPR (via IREα, ATF6, and PERK) were activated by the depletion of SPPase. Concomitantly, AKT was also activated, possibly countering ER stress-induced pro-apoptotic signaling. These effects were attributed directly to elevated intracellular S1P levels. Our results indicate that a similar ER stress response to that observed subsequent to Sgpp1 knockdown in cultured cells (30) may occur in β-cells in vivo when Sgpp2 is deleted. We did not observe an elevated level of S1P in Sgpp2−/− mouse islets when compared with those of WT mice, which may reflect a rapid flux of substrate through the metabolic pathway.
The ER is the site of sphingolipid de novo synthesis and sphingolipid recycling pathways (4). Dysregulation of sphingolipid metabolism is known to induce ER stress. For example, in yeast, dysregulation of de novo sphingolipid synthesis by depletion of the Orm proteins, which regulate the first step in the de novo synthesis pathway, causes constitutive activation of the UPR (31). Disruption of ceramide synthesis, by depletion of ceramide synthase 2, also leads to activation of the UPR (32). SPPase activity is required for efficient recycling of sphingoid bases into the ceramide synthesis pathway (7). In some mammalian cells, recycling can account for more than half of complex sphingolipid synthesis (33). Because sphingolipid levels are tightly regulated, disabling the recycling pathway by deletion of Sgpp2 may elevate the activity of the de novo pathway in order to maintain sphingolipid homeostasis. Elevation of the de novo sphingolipid pathway in β-cells can lead to lipotoxicity (34), a source of elevated ER stress (28).
Our results show that disabling an enzyme within the sphingolipid recycling pathway provokes a stress response in β-cells, indicating that they are extremely sensitive to perturbations in the sphingolipid metabolism pathway. Type 2 diabetes is characterized by peripheral insulin resistance, β-cell dysfunction, and loss of β-cell mass. Dysfunctional sphingolipid metabolism is known to cause peripheral insulin resistance (35–37). The present study now extends our understanding of the importance of sphingolipid metabolism in diabetes susceptibility by identifying Sgpp2 as a gene controlling adaptive β-cell mass expansion.
Author Contributions
Y. T. and R. L. P. conceived the project. Y. T., M. L. A., H. M., E. K. C., O. G., G. T., and A. O. contributed to experimental data acquisition and interpretation. B. A. C. and W. C. performed data analysis and interpretation. Y. T., M. L. A., and R. L. P. wrote the manuscript. All authors reviewed the results and approved the final version of the manuscript.
Acknowledgments
We thank Chuxia Deng and Cuiling Liu (NIDDK, National Institutes of Health (NIH), Mouse Knock-out Core Laboratory) for production of the chimeric mice and Shalini Jain (NIDDK, NIH, Mouse Metabolism Core Laboratory) for islet isolation.
This research was supported by the Intramural Research Programs of NIDDK and NIAID, National Institutes of Health; the Lipidomics Shared Resource, Hollings Cancer Center, Medical University of South Carolina (Grant P30 CA138313); and the Lipidomics Core in the SC Lipidomics and Pathobiology COBRE (Grant P20 RR017677). The authors declare that they have no conflicts of interest with the contents of this article. The content is solely the responsibility of the authors and does not necessarily represent the official views of the National Institutes of Health.
- S1P
- sphingosine-1-phosphate
- SPPase
- S1P phosphatase
- STZ
- streptozotocin
- ER
- endoplasmic reticulum
- HFD
- high-fat diet
- UPR
- unfolded protein response
- NBD
- ω(7-nitro-2-1,3-benzoxadiazol-4-yl).
References
- 1. Proia R. L., and Hla T. (2015) Emerging biology of sphingosine-1-phosphate: its role in pathogenesis and therapy. J. Clin. Invest. 125, 1379–1387 [DOI] [PMC free article] [PubMed] [Google Scholar]
- 2. Maceyka M., and Spiegel S. (2014) Sphingolipid metabolites in inflammatory disease. Nature 510, 58–67 [DOI] [PMC free article] [PubMed] [Google Scholar]
- 3. Hannun Y. A., and Obeid L. M. (2008) Principles of bioactive lipid signalling: lessons from sphingolipids. Nat. Rev. Mol. Cell Biol. 9, 139–150 [DOI] [PubMed] [Google Scholar]
- 4. Merrill A. H., Jr. (2011) Sphingolipid and glycosphingolipid metabolic pathways in the era of sphingolipidomics. Chem. Rev. 111, 6387–6422 [DOI] [PMC free article] [PubMed] [Google Scholar]
- 5. Zhou J., and Saba J. D. (1998) Identification of the first mammalian sphingosine phosphate lyase gene and its functional expression in yeast. Biochem. Biophys. Res. Commun. 242, 502–507 [DOI] [PubMed] [Google Scholar]
- 6. Mandala S. M. (2001) Sphingosine-1-phosphate phosphatases. Prostaglandins Other Lipid Mediat. 64, 143–156 [DOI] [PubMed] [Google Scholar]
- 7. Le Stunff H., Giussani P., Maceyka M., Lépine S., Milstien S., and Spiegel S. (2007) Recycling of sphingosine is regulated by the concerted actions of sphingosine-1-phosphate phosphohydrolase 1 and sphingosine kinase 2. J. Biol. Chem. 282, 34372–34380 [DOI] [PubMed] [Google Scholar]
- 8. Mandala S. M., Thornton R., Galve-Roperh I., Poulton S., Peterson C., Olivera A., Bergstrom J., Kurtz M. B., and Spiegel S. (2000) Molecular cloning and characterization of a lipid phosphohydrolase that degrades sphingosine-1-phosphate and induces cell death. Proc. Natl. Acad. Sci. U.S.A. 97, 7859–7864 [DOI] [PMC free article] [PubMed] [Google Scholar]
- 9. Ogawa C., Kihara A., Gokoh M., and Igarashi Y. (2003) Identification and characterization of a novel human sphingosine-1-phosphate phosphohydrolase, hSPP2. J. Biol. Chem. 278, 1268–1272 [DOI] [PubMed] [Google Scholar]
- 10. Sigal Y. J., McDermott M. I., and Morris A. J. (2005) Integral membrane lipid phosphatases/phosphotransferases: common structure and diverse functions. Biochem. J. 387, 281–293 [DOI] [PMC free article] [PubMed] [Google Scholar]
- 11. Le Stunff H., Peterson C., Thornton R., Milstien S., Mandala S. M., and Spiegel S. (2002) Characterization of murine sphingosine-1-phosphate phosphohydrolase. J. Biol. Chem. 277, 8920–8927 [DOI] [PubMed] [Google Scholar]
- 12. Allende M. L., Sipe L. M., Tuymetova G., Wilson-Henjum K. L., Chen W., and Proia R. L. (2013) Sphingosine-1-phosphate phosphatase 1 regulates keratinocyte differentiation and epidermal homeostasis. J. Biol. Chem. 288, 18381–18391 [DOI] [PMC free article] [PubMed] [Google Scholar]
- 13. Engin F., Nguyen T., Yermalovich A., and Hotamisligil G. S. (2014) Aberrant islet unfolded protein response in type 2 diabetes. Sci. Rep. 4, 4054. [DOI] [PMC free article] [PubMed] [Google Scholar]
- 14. Engin F., Yermalovich A., Nguyen T., Hummasti S., Fu W., Eizirik D. L., Mathis D., and Hotamisligil G. S. (2013) Restoration of the unfolded protein response in pancreatic beta cells protects mice against type 1 diabetes. Sci. Transl. Med. 5, 211ra156. [DOI] [PMC free article] [PubMed] [Google Scholar]
- 15. Krishnamurthy J., Ramsey M. R., Ligon K. L., Torrice C., Koh A., Bonner-Weir S., and Sharpless N. E. (2006) p16INK4a induces an age-dependent decline in islet regenerative potential. Nature 443, 453–457 [DOI] [PubMed] [Google Scholar]
- 16. Gotoh M., Maki T., Kiyoizumi T., Satomi S., and Monaco A. P. (1985) An improved method for isolation of mouse pancreatic islets. Transplantation 40, 437–438 [DOI] [PubMed] [Google Scholar]
- 17. Allende M. L., Bektas M., Lee B. G., Bonifacino E., Kang J., Tuymetova G., Chen W., Saba J. D., and Proia R. L. (2011) Sphingosine-1-phosphate lyase deficiency produces a pro-inflammatory response while impairing neutrophil trafficking. J. Biol. Chem. 286, 7348–7358 [DOI] [PMC free article] [PubMed] [Google Scholar]
- 18. Maceyka M., Milstien S., and Spiegel S. (2007) Measurement of mammalian sphingosine-1-phosphate phosphohydrolase activity in vitro and in vivo. Methods Enzymol. 434, 243–256 [DOI] [PubMed] [Google Scholar]
- 19. Mechtcheriakova D., Wlachos A., Sobanov J., Bornancin F., Zlabinger G., Baumruker T., and Billich A. (2007) FTY720-phosphate is dephosphorylated by lipid phosphate phosphatase 3. FEBS Lett. 581, 3063–3068 [DOI] [PubMed] [Google Scholar]
- 20. Kamata K., Mizukami H., Inaba W., Tsuboi K., Tateishi Y., Yoshida T., and Yagihashi S. (2014) Islet amyloid with macrophage migration correlates with augmented beta-cell deficits in type 2 diabetic patients. Amyloid 21, 191–201 [DOI] [PMC free article] [PubMed] [Google Scholar]
- 21. Mizukami H., Takahashi K., Inaba W., Tsuboi K., Osonoi S., Yoshida T., and Yagihashi S. (2014) Involvement of oxidative stress-induced DNA damage, endoplasmic reticulum stress, and autophagy deficits in the decline of beta-cell mass in Japanese type 2 diabetic patients. Diabetes Care 37, 1966–1974 [DOI] [PubMed] [Google Scholar]
- 22. Bielawski J., Szulc Z. M., Hannun Y. A., and Bielawska A. (2006) Simultaneous quantitative analysis of bioactive sphingolipids by high-performance liquid chromatography-tandem mass spectrometry. Methods 39, 82–91 [DOI] [PubMed] [Google Scholar]
- 23. Sachdeva M. M., and Stoffers D. A. (2009) Minireview: Meeting the demand for insulin: molecular mechanisms of adaptive postnatal beta-cell mass expansion. Mol. Endocrinol. 23, 747–758 [DOI] [PMC free article] [PubMed] [Google Scholar]
- 24. Rhodes C. J. (2005) Type 2 diabetes: a matter of beta-cell life and death? Science 307, 380–384 [DOI] [PubMed] [Google Scholar]
- 25. Walter P., and Ron D. (2011) The unfolded protein response: from stress pathway to homeostatic regulation. Science 334, 1081–1086 [DOI] [PubMed] [Google Scholar]
- 26. Le Stunff H., Galve-Roperh I., Peterson C., Milstien S., and Spiegel S. (2002) Sphingosine-1-phosphate phosphohydrolase in regulation of sphingolipid metabolism and apoptosis. J. Cell Biol. 158, 1039–1049 [DOI] [PMC free article] [PubMed] [Google Scholar]
- 27. Mechtcheriakova D., Wlachos A., Sobanov J., Kopp T., Reuschel R., Bornancin F., Cai R., Zemann B., Urtz N., Stingl G., Zlabinger G., Woisetschläger M., Baumruker T., and Billich A. (2007) Sphingosine 1-phosphate phosphatase 2 is induced during inflammatory responses. Cell. Signal. 19, 748–760 [DOI] [PubMed] [Google Scholar]
- 28. Biden T. J., Boslem E., Chu K. Y., and Sue N. (2014) Lipotoxic endoplasmic reticulum stress, beta cell failure, and type 2 diabetes mellitus. Trends Endocrinol. Metab. 25, 389–398 [DOI] [PubMed] [Google Scholar]
- 29. Papa F. R. (2012) Endoplasmic reticulum stress, pancreatic beta-cell degeneration, and diabetes. Cold Spring Harb. Perspect. Med. 2, a007666. [DOI] [PMC free article] [PubMed] [Google Scholar]
- 30. Lépine S., Allegood J. C., Park M., Dent P., Milstien S., and Spiegel S. (2011) Sphingosine-1-phosphate phosphohydrolase-1 regulates ER stress-induced autophagy. Cell Death Differ. 18, 350–361 [DOI] [PMC free article] [PubMed] [Google Scholar]
- 31. Han S., Lone M. A., Schneiter R., and Chang A. (2010) Orm1 and Orm2 are conserved endoplasmic reticulum membrane proteins regulating lipid homeostasis and protein quality control. Proc. Natl. Acad. Sci. U.S.A. 107, 5851–5856 [DOI] [PMC free article] [PubMed] [Google Scholar]
- 32. Spassieva S. D., Mullen T. D., Townsend D. M., and Obeid L. M. (2009) Disruption of ceramide synthesis by CerS2 down-regulation leads to autophagy and the unfolded protein response. Biochem. J. 424, 273–283 [DOI] [PMC free article] [PubMed] [Google Scholar]
- 33. Schulze H., and Sandhoff K. (2014) Sphingolipids and lysosomal pathologies. Biochim. Biophys. Acta 1841, 799–810 [DOI] [PubMed] [Google Scholar]
- 34. Bikman B. T., and Summers S. A. (2011) Ceramides as modulators of cellular and whole-body metabolism. J. Clin. Invest. 121, 4222–4230 [DOI] [PMC free article] [PubMed] [Google Scholar]
- 35. Raichur S., Wang S. T., Chan P. W., Li Y., Ching J., Chaurasia B., Dogra S., Öhman M. K., Takeda K., Sugii S., Pewzner-Jung Y., Futerman A. H., and Summers S. A. (2014) CerS2 haploinsufficiency inhibits beta-oxidation and confers susceptibility to diet-induced steatohepatitis and insulin resistance. Cell Metab. 20, 687–695 [DOI] [PubMed] [Google Scholar]
- 36. Holland W. L., Brozinick J. T., Wang L. P., Hawkins E. D., Sargent K. M., Liu Y., Narra K., Hoehn K. L., Knotts T. A., Siesky A., Nelson D. H., Karathanasis S. K., Fontenot G. K., Birnbaum M. J., and Summers S. A. (2007) Inhibition of ceramide synthesis ameliorates glucocorticoid-, saturated-fat-, and obesity-induced insulin resistance. Cell Metab. 5, 167–179 [DOI] [PubMed] [Google Scholar]
- 37. Holland W. L., Miller R. A., Wang Z. V., Sun K., Barth B. M., Bui H. H., Davis K. E., Bikman B. T., Halberg N., Rutkowski J. M., Wade M. R., Tenorio V. M., Kuo M. S., Brozinick J. T., Zhang B. B., et al. (2011) Receptor-mediated activation of ceramidase activity initiates the pleiotropic actions of adiponectin. Nat. Med. 17, 55–63 [DOI] [PMC free article] [PubMed] [Google Scholar]


