

Abstract
Background
This study sought to assess cross-sectional associations of aortic stiffness assessed by magnetic resonance imaging (MRI) with left ventricular (LV) remodeling and myocardial deformation in the Multi-Ethnic Study of Atherosclerosis (MESA).
Methods and Results
Aortic arch pulse wave velocity (PWV) was measured with phase contrast cine MRI. LV circumferential strain (Ecc), torsion, and early diastolic strain rate (EDSR) were determined by tagged MRI. Multivariable linear regression models were used to adjust for demographics and cardiovascular risk factors. Of 2093 participants, multivariable linear regression models demonstrated that higher arch PWV was associated with higher LV mass index (B=0.53 per 1 SD increase for log-transformed PWV, p<0.05) and LV mass to volume ratio (LVMVR) (B=0.015, p<0.01), impaired LV ejection fraction (LVEF) (B=−0.84, p<0.001), Ecc (B=0.55, p<0.001), torsion (B=−0.11, p<0.001), and EDSR (B=−0.003, p<0.05). In sex stratified analysis, higher arch PWV was associated with higher MVR (B=0.02, p<0.05), impaired Ecc (B=0.60, p<0.001) and LVEF (B=−0.45, p<0.05), but with maintained torsion in women, whereas higher PWV was associated with impaired Ecc (B=0.49, p<0.001) and LVEF (B=−1.21, p<0.001) with lower torsion (B=−0.17, p<0.001) in men.
Conclusions
Higher arch PWV is associated with LV remodeling and reduced LV systolic and diastolic function in a large multi-ethnic population. Greater aortic arch stiffness is associated with concentric LV remodeling, relatively preserved LVEF with maintained torsion in women, whereas greater aortic arch stiffness is associated with greater LV dysfunction demonstrated as impaired Ecc, torsion and LVEF with less concentric LV remodeling in men.
Keywords: aortic stiffness, pulse wave velocity, left ventricle, epidemiology, magnetic resonance imaging
The central aorta serves as a conduit to deliver blood to peripheral organs and also as a cushion to buffer the pulsatile pressure and flow from the heart. A stiffened aorta has less buffering effect on pulsatile pressure leading to increased left ventricular (LV) afterload1. Therefore, arterial stiffness is associated with the incidence of cardiovascular disease1–3.
Magnetic resonance imaging (MRI) has the unique ability to combine in a single exam the assessment of ventricular geometry, myocardial function, and central aortic stiffness. Regional pulse wave velocity (PWV) in the thoracic aorta can be assessed by MRI with a great level of accuracy and reproducibility4, 5. PWV measured by MRI has several advantages, such as full 3-dimensional visualization of the vessel, allowing for accurate measurements compared to standard carotid-femoral PWV (cf-PWV)6. Cardiovascular magnetic resonance (CMR) is currently considered as the gold standard for assessing myocardial structure and tagged CMR provides precise quantification of myocardial deformation parameters including myocardial strain and torsion7,8.
The impact of aortic stiffness on LV geometry and performance is very important from public health and therapeutic viewpoints. Identifying an association between increased aortic stiffness and impaired myocardial deformation parameters may elucidate potential mechanisms for impaired vascular-ventricular coupling in the pathogenesis of HF. Although several studies have explored the association of aortic stiffness and global ventricular dysfunction in hypertension participants9 and the general population10, no studies have explored the association between aortic stiffness assessed by MRI and myocardial deformation in a large general population cohort. Thus, in the present study, we aim to determine the relationship of aortic arch PWV with LV remodeling (LV mass and volume) and LV function including myocardial deformation parameters (LVEF, circumferential strain, torsion, early diastolic strain rate) in a large multi-ethnic cohort. We also aim to determine whether any of these associations are sex-specific because previous studies have shown that there are sex differences in LV structure and function as well as in arterial stiffness11, 12.
Methods
Study population
The Multi-Ethnic Study of Atherosclerosis has been previously described13. In summary, it is a population-based sample of 6814 men and women aged 45 to 84 years without clinical CVD at the time of enrollment who identified themselves as white, African-American, Hispanic, or Chinese from 6 US communities (Baltimore, New York, Minneapolis, Winston-Salem, Los Angeles, and Chicago). In the longitudinal follow-up (fifth examination) of subjects in the MESA study from 2010 to 2012, a total of 3026 participants underwent CMR imaging. Of these, 2227 participants had aortic MRI and CMR imaging performed as part of the scans. After excluding 134 participants due to bad image quality mainly by motion artifact, 2093 participants (94% of all available aortic MRI) were included for this study. All participants gave informed consent for the study protocol, which was approved by the institutional review boards of all MESA field centers and the CMR reading center.
Aortic and CMR imaging
CMR images were acquired with 1.5T scanners as previously described. Gradient echo phase-contrast cine MRI (PC-CMR) with ECG gating was performed to evaluate aorta area and through plane flow. Images of the ascending and descending aorta were obtained in the transverse plane perpendicular to the aortic lumen at the level of the right pulmonary artery. Imaging parameters for PC-CMR were the following: field of view: 300 × 300 mm, slice thickness: 8 mm, repetition time: 5.8 ms, echo time: 3.5 ms, flip angle: 20 degree, bandwidth: 245Hz/pixel, encoding velocity: 100cm/s, acquisition matrix size: 128 × 128 interpolated to 256 × 256, spatial resolution: 1.2 × 1.2 × 8 mm according to post processing by interpolation. The number of images was 50 per cardiac cycle.
To visualize the thoracic aorta, images in the sagittal planes were acquired using electrocardiogram-gated Steady State Free Precession (SSFP) acquisition with breath hold. These images allow us to measure the distance between the ascending and descending aorta.
By providing an automated segmentation of the modulus and velocity images acquired by PC-CMR, ARTFUN software (INSERM U678) allowed us to obtain the flow wave transit time between the ascending to descending aorta14, 15. The transit time was calculated as the average time difference using the least squares estimate between all data points on the systolic upslope of the ascending and descending aortic flow curves after peak flow normalization. Using the oblique sagittal image through the thoracic aorta, the distance between ascending and descending aorta were measured at precise locations where the through velocities were measured (Figure 1). Aortic arch PWV was then calculated as follows:
PWV (m/s) = distance (mm) / transit time between ascending to descending (ms).
Higher aortic arch PWV represents greater aortic stiffness. Intra- and inter-observer reproducibility of arch PWV was excellent with an intraclass correlation coefficient ranging 0.94 to 0.995
Figure 1.
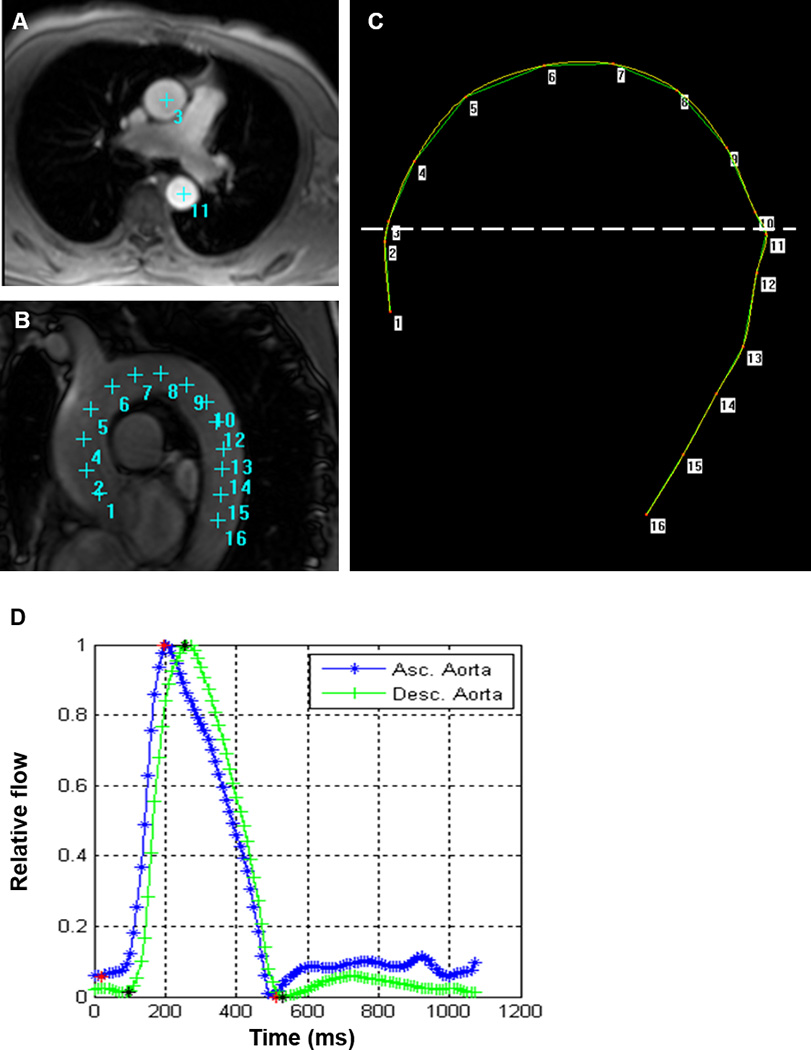
Measurement for aortic arch PWV. A: Phase contrast cine transverse view. B: Aortic arch view with SSFP sequence. C: Measurement of the transit distance in the aortic arch. Numbers correspond to those in A and B. Arch length is measured as the distance from 3 to 11 in this case. D: Flow wave curves of ascending (Asc.) aorta and descending (Desc.) aorta after peak flow normalization. Transit time is measured as the average time difference using the least squares estimate between all data points on the systolic upslope of the ascending and descending aortic flow curves. PWV is calculated as transit distance divided by transit time.
CMR cine and tagging imaging were performed to assess LV mass, volumes, LVEF, and deformation parameters as previously described16. LV mass and LV volumes were indexed to height1.7 17. Average peak midventricular mid-wall circumferential strain (Ecc) is a negative value and more negative values indicate greater circumferential shortening. Ecc was calculated by averaging the corresponding mid-ventricular peak segmental strain values from 4 ventricular segments18 (Figure 2). LV torsion was defined by LV twist normalized by slice distance12. Early diastolic strain rate (EDSR) was identified as the first peak in the diastolic phase of the circumferential strain rate curve19.
Figure 2.
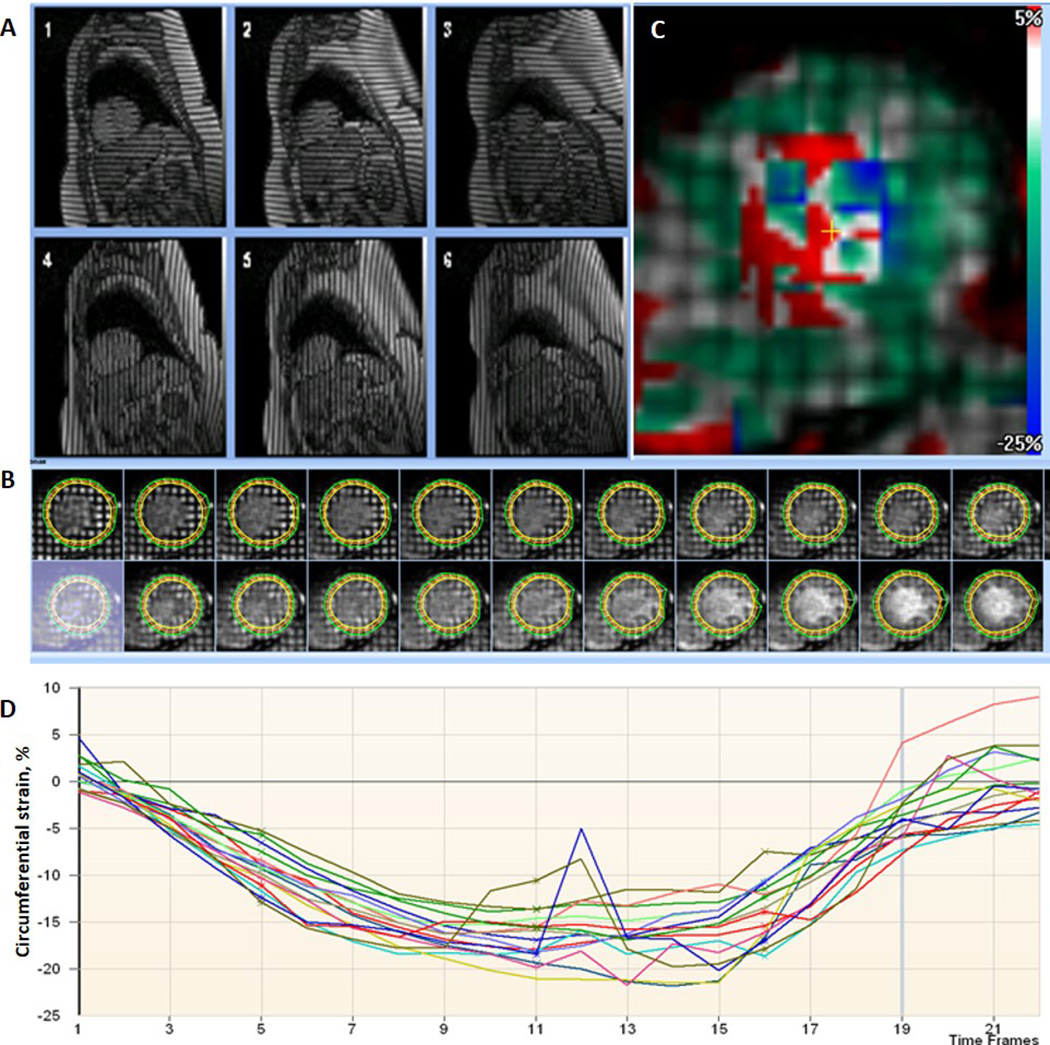
Analysis for the tagged cardiovascular magnetic resonance imaging with a sample circumferential strain curve. A: Tagged short-axis images with 2 orthogonally oriented parallel striped tags at basal (1,4), midventricular (2, 5), and apical (3,6) levels. B: Imaging analysis–epicardial, endocardial and midwall borders of tagged LV wall image through an entire cardiac cycle. C: Color map showing pixelwise distribution of circumferential strain – more negative values indicate greater contraction. The values from the blood pool are extremely noise. D: Circumferential strain curves with each curve representing a segment.
CVD risk factors assessment
During the fifth examination follow-up period in MESA, participants completed standardized questionnaires to provide information about demographic variables, smoking history, and medication usage. Resting systolic (SBP) and diastolic blood pressures (DBP) were measured in the seated position using an automated osillometric sphygmomanometer. Mean blood pressure (MBP) was calculated as: (2 × DBP + SBP)/3. Pulse pressure (PP) was calculated as (SBP − DBP). Hypertension was defined as SBP ≥140 mmHg, DBP ≥90 mmHg, or current use of antihypertensive medications. Glucose and lipids were measured after a 12-hour fast. Diabetes mellitus was defined as fasting glucose ≥126 mg/dl or use of insulin or oral hypoglycemic medications.
Statistical analysis
Continuous variables are presented as mean ± SD for normally distributed data and median (25%ile, 75%ile) for non-normally distributed data. Categorical variables are presented as frequencies and percentages. Comparisons of LV data and PWV between genders were performed using Student’s t test and Mann-Whitney U test for normally and non-normally distributed data, respectively. PWV was logarithmically transformed for linear regression models and figure due to non-normally distribution.
The associations of aortic arch PWV with LV structure (LV mass index, LV end-diastolic volume index, LV end-systolic volume index, LV mass to volume ratio (LVMVR)) and function (LVEF, Ecc, torsion, EDSR) variables were assessed using multivariable linear regression analysis, with LV variables as dependent variables. The models adjusted for the following covariates: demographics (age, sex, and ethnicity), traditional cardiovascular risk factors— systolic blood pressure, antihypertensive medication use, diabetes mellitus, obesity (BMI>30), heart rate, low-density lipoprotein, high-density lipoprotein and current smoking status—, and the presence of cardiovascular disease. For the LV functional variables, models further adjusted for LV mass and LV end-diastolic volume were repeated. Further adjustment for the ascending aortic area was also done for all measures. Models that alternatively included diastolic or mean blood pressure, and pulse pressure instead of systolic blood pressure, were also evaluated. We examined the interaction of PWV with sex in its association with LV variables using multiplicative interaction terms as well as using stratified analysis by sex. A 2-tailed p value of <0.05 was considered statistically significant. All statistical analyses were performed using Stata version 12.0 (Stata Corp LP, College Station, TX).
Results
MESA Participants’ Characteristics
Table 1 shows baseline the study participants’ demographics and clinical and MRI variables. The study population was 47% male, 40% Caucasian, 14% Chinese American, 26% African American, and 20% Hispanic; 59% were hypertensive, 18% had diabetes, and 7% were active smokers with mean age of 69.5±9.4 years. At the time of the exam, 29 participants had heart failure, 42 had myocardial infarction, and 74 had angina pectoris over the 10 years of follow-up. Median values of arch PWV was 8.0 (6.4, 10.0) m/s (Supplemental Figure).
Table 1.
Population Characteristics
| Total (n=2093) | |
|---|---|
| Age, y | 69.5 ± 9.4 |
| Male, n (%) | 983 (47%) |
| Ethnicity, n (%) | |
| White | 831 (40%) |
| Chinese | 303 (14%) |
| Black | 537 (26%) |
| Hispanic | 422 (20%) |
| Height, cm | 165 ± 10 |
| BMI, kg.m−2 | 27.9 ± 5.2 |
| Heart failure, n (%) | 29 (1%) |
| Myocardial infarction, n (%) | 42 (2%) |
| Angina pectoris, n (%) | 74 (4%) |
| Hypertension, n (%) | 1229 (59%) |
| Antihypertensive medication, n (%) | 1127 (54%) |
| Diabetes mellitus, n (%) | 364 (18%) |
| Current smoking status, n (%) | 140 (7%) |
| LDL cholesterol, mg/dl | 107 ± 32 |
| HDL cholesterol, mg/dl | 56 ± 17 |
| SBP, mmHg | 124 ± 20 |
| DBP, mmHg | 68 ± 10 |
| MBP, mmHg | 87 ± 12 |
| PP, mmHg | 55 ± 17 |
| Heart rate, bpm | 64 ± 10 |
| Aortic arch PWV, m/s | 8.0 (6.4, 10.0) |
| Ascending aortic area, cm2 | 8.5 ± 2.1 |
| Descending aortic area, cm2 | 5.0 ± 1.3 |
| LVMi, g/m1.7 | 52 ± 12 |
| LVEDVi, ml/m1.7 | 50 ± 11 |
| LVESVi, ml/m1.7 | 19 ± 7 |
| LVMVR, g/ml | 1.06 ± 0.23 |
| LVEF, % | 62 ± 7 |
| Ecc, % | −16.2 ± 3.3 |
| Torsion, °/cm | 4.2 ± 1.3 |
| EDSR, 1/s | 0.111 ± 0.052 |
Values are mean ± SD, median (25%tile, 75%ile), or n (%). BMI indicates body mass index; LDL, low density lipoprotein; HDL, high density lipoprotein; SBP, systolic blood pressure; DBP, diastolic blood pressure; MBP, mean blood pressure; PP, pulse pressure; PWV, pulse wave velocity; LVMi, left ventricular mass indexed to height1.7; LVEDVi, left ventricular end-diastolic volume index; LVESVi, left ventricular end-systolic volume; LVMVR, left ventricular mass volume ratio; LVEF, left ventricular ejection fraction; Ecc, circumferential strain; EDSR, early diastolic strain rate.
Association of LV Structure and Function with Aortic Stiffness
Table 2 shows the association of LV structure and function with aortic arch PWV. Higher PWV was associated with lower LV end-diastolic volume index, higher LV mass index and LVMVR in univariate regression analysis. The associations of greater PWV with LV mass index (B=0.53 [95%CI; 0.12 to 0.95] g/m1.7 per 1 SD increase for logPWV; p<0.05) and LVMVR (B=0.015 [0.006 to 0.025] g/ml; p<0.001) remained significant after adjustment for traditional cardiovascular risk factors. With regard to LV functional variables, higher PWV was associated with impaired LVEF (B=−0.84 [−1.16 to −0.52] %; p<0.001), impaired Ecc (B=0.55 [0.40 to 0.69] %; p<0.001), lower torsion (B=−0.11 [−0.17 to −0.06] °/cm; p<0.001) and lower EDSR (B=−0.003 [−0.005 to −0.001]; p<0.05) in multivariable analysis. These associations of PWV with the impaired systolic function (EF, Ecc, torsion) persisted even after adjustment for LV mass and LV end-diastolic volume, whereas the association of PWV with impaired LV diastolic function represented by reduced EDSR was absent after further adjustment for LV structural variables. These associations of PWV with LV measures were also maintained after further adjustment for aortic area as a potential confounder, except for the association with LV mass index that showed non-significant (p=0.30). Similar results were obtained in models using mean or diastolic pressure, or pulse pressure instead of systolic blood pressure (data not shown).
Table 2.
Association of logPWV with LV structural and functional variables
| Response | R2 | Model1 | Model2 | Model3 |
|---|---|---|---|---|
| LVEDVi, ml/m1.7 | 0.22 | −0.75 (−1.22 to −0.28)* | −0.08 (−0.54 to .39) | … |
| LVESVi, ml/m1.7 | 0.19 | 0.27 (−0.01 to 0.55) | 0.46 (0.18 to 0.74)* | … |
| LVMi, g/m1.7 | 0.46 | 0.92 (0.41 to 1.42)* | 0.53 (0.12 to 0.95)† | … |
| LVMVR, g/ml | 0.24 | 0.039 (0.030 to 0.049)** | 0.015 (0.006 to 0.025)* | … |
| LVEF, % | 0.23 | −0.93 (−1.24 to −0.61)** | −0.84 (−1.16 to −0.52)** | −0.86 (−1.17 to −0.55)** |
| Ecc, % | 0.25 | 0.69 (0.55 to 0.83)** | 0.55 (0.40 to 0.69)** | 0.48 (0.34 to 0.63)** |
| Torsion, °/cm | 0.27 | −0.07 (0.12 to −0.01)† | −0.11 (−0.17 to −0.06)** | −0.11 (−0.16 to −0.06)** |
| EDSR, 1/s | 0.12 | −0.007 (−0.009 to −0.005)** | −0.003 (−0.005 to −0.001)† | −0.002 (0.005 to 0.0002) |
Coefficients and 95%CI (in brackets) were estimated using multivariable linear regression models to assess the association of logPWV (per 1 SD) with LV structural and functional variables as dependent variables.
Model 1: unadjusted.
Model 2: adjusted for age, sex, race, smoking, diabetes mellitus, antihypertensive medication, obesity, SBP, heart rate, LDL, HDL, and CVD
Model 3: adjusted for Model2 + LVMi and LVEDVi
CVD indicates cardiovascular disease; other abbreviation as in Table 1.
if p<0.001,
if p<0.01,
if p<0.05
Sex-Specific Changes in LV Structure and Function with Increasing Aortic PWV
There was no significant difference in arch PWV between men and women. Men had significantly higher LV mass index, LV end-diastolic volume index, LV end-systolic volume index, and LVMVR (all p<0.001) than women. LV systolic function analysis showed impaired Ecc, torsion, EDSR, and LVEF (all p<0.001) in men compared to women (Supplemental Table). There was a significant interaction with sex in the association of aortic PWV with LV torsion (B for interaction = −0.13 [−0.23 to −0.02] °/cm; p=0.013) and LVEF (B for interaction = −0.77 [−1.36 to −0.19] %; p=0.009).
Table 3 shows the sex-specific associations between arch PWV and LV structural and functional variables. Higher arch PWV was associated with higher LV mass index (B=0.53 [0.03 to 1.03] g/m1.7; p<0.05) and LVMVR (B=0.020 [0.009 to 0.032] g/ml; p<0.01) after adjustment for traditional risk factors in women only, whereas no association with LV remodeling variables was found in men. In men, higher PWV was associated with impaired Ecc (B=0.49 [0.27 to 0.70] %p<0.001), LV torsion (B=−0.17 [−0.24 to −0.09] °/cm; p<0.001), and LVEF (B=−1.21 [−1.70 to −0.73] %; p<0.001) after adjustment for traditional risk factors. In women, higher PWV was associated with impaired Ecc (B=0.60 [0.39 to 0.80] %; p<0.001), but torsion remained unchanged. Higher PWV was associated with reduced LVEF but was not pronounced in women (B=−0.45 [−0.88 to −0.02] %; p<0.05) compared with men. These associations of PWV with systolic functional variables persisted in both sexes after further adjustment for LV structural variables. In addition, higher PWV was associated with lower EDSR only in women after adjustment for traditional risk factors, but this relationship was absent after adjustment for LV remodeling factor. Further adjustment for aortic area showed similar results except the association of PWV with LV mass index in women that was absent in this model. Figure 3 represents sex differences in the correlation between arch PWV and LV function.
Table 3.
Sex-Specific changes in LV Structure and Function with logPWV
| Response | R2 | Model1 | Model2 | Model3 |
|---|---|---|---|---|
| Women | ||||
| LVEDVi, ml/m1.7 | 0.25 | −0.98 (−1.55 to −0.41)** | −0.27 (−0.81 to 0.28) | … |
| LVESVi, ml/m1.7 | 0.13 | −0.10 (−0.42 to 0.21) | 0.17 (−0.15 to 0.49) | … |
| LVMi, g/m1.7 | 0.38 | 0.75 (0.17 to 1.33)† | 0.53 (0.03 to 1.03)† | … |
| LVMVR, g/ml | 0.24 | 0.042 (0.030 to 0.054)** | 0.020 (0.009 to 0.032)** | … |
| LVEF, % | 0.10 | −0.41 (−0.82 to −0.002)† | −0.45 (−0.88 to −0.02)† | −0.52 (−0.95 to −0.10)† |
| Ecc, % | 0.23 | 0.72 (0.52 to 0.91)** | 0.60 (0.39 to 0.80)** | 0.50 (0.31 to 0.70)** |
| Torsion, °/cm | 0.17 | −0.001 (−0.08 to 0.08) | −0.06 (−0.14 to 0.03) | −0.06 (−0.14 to 0.02) |
| EDSR, 1/s | 0.11 | −0.007 (−0.010 to −0.004)** | −0.0035 (−0.0068 to −0.0001)† | −0.002 (−0.006 to 0.001) |
| Men | ||||
| LVEDVi, ml/m1.7 | 0.15 | −0.80 (−1.51 to −0.08)† | 0.19 (−0.59 to 0.97) | … |
| LVESVi, ml/m1.7 | 0.11 | 0.42 (−0.03 to 0.86) | 0.79 (0.30 to 1.28)* | … |
| LVMi, g/m1.7 | 0.28 | 0.51 (−0.18 to 1.20) | 0.61 (−0.08 to 1.30) | … |
| LVMVR, g/ml | 0.16 | 0.030 (0.016 to 0.045)** | 0.010 (−0.005 to 0.026) | … |
| LVEF, % | 0.23 | −1.22 (−1.67 to −0.77)** | −1.21 (−1.70 to −0.73)** | −1.17 (−1.64 to −0.70)** |
| Ecc, % | 0.25 | 0.62 (0.42 to 0.82)** | 0.49 (0.27 to 0.70)** | 0.44 (0.24 to 0.65)** |
| Torsion, °/cm | 0.19 | −0.09 (0.15 to −0.02)* | −0.17 (−0.24 to −0.09)** | −0.16 (−0.23 to −0.09)** |
| EDSR, 1/s | 0.10 | −0.006 (−0.009 to −0.003)** | −0.002 (−0.006 to 0.001) | −0.002 (−0.005 to 0.002) |
Coeffcients and 95%CI (in brackets) were estimated using multivariable linear regression models to assess the association of logPWV (per 1 SD) with LV structural and functional variables as dependent variables.
Model 1: unadjusted.
Model 2: adjusted for age, race, smoking, diabetes mellitus, antihypertensive medication, obesity, SBP, heart rate, LDL, HDL, and CVD
Model 3: adjusted for Model2 + LVMi and LVEDVi
if p<0.001,
if p<0.01,
if p<0.05
Figure 3.
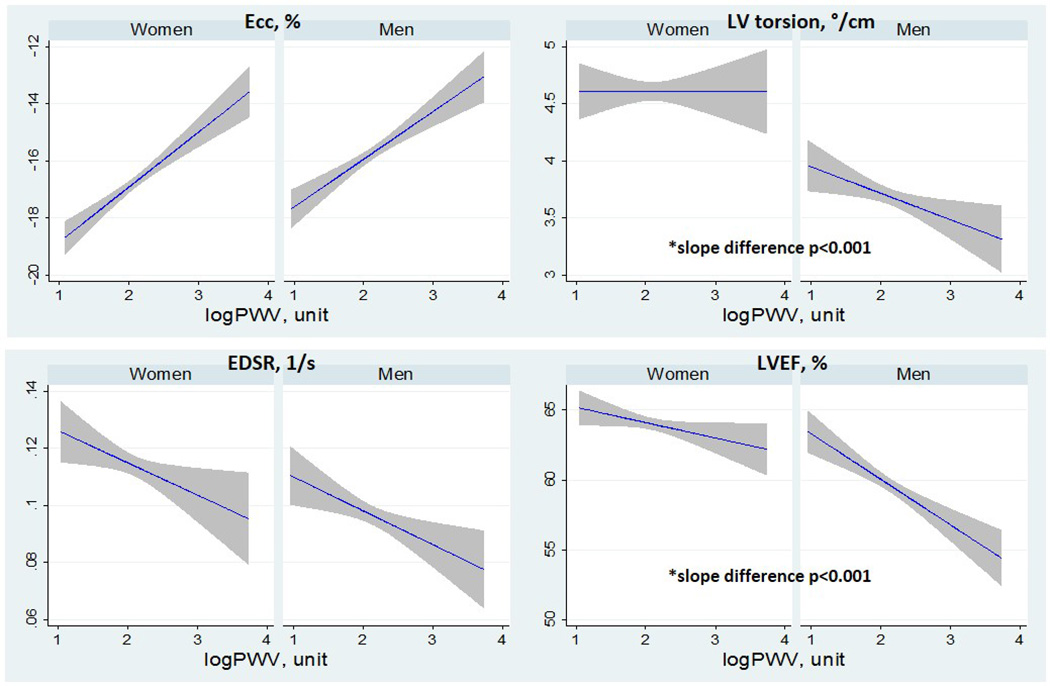
Plots showing linear regression fits with 95%CI for women and men with left ventricular (LV) function variables on the y axis and logPWV on the x. Abbreviation as Table 1.
Discussion
The present study demonstrates that higher aortic arch stiffness is associated with greater LV concentric remodeling, as demonstrated by the positive relationship with higher LV mass index and LVMVR. Furthermore, higher aortic arch PWV is associated with impaired LV systolic function as demonstrated by impaired Ecc and LV torsion as well as by impaired LVEF in a large multi-ethnic population. The association of PWV with lower EDSR, a marker of early diastolic dysfunction, was also demonstrated. These associations of PWV with altered myocardial deformation variables persisted after adjustment for traditional cardiovascular risk factors and measures of LV remodeling. In women, increasing arch PWV is associated with LV concentric remodeling, worse diastolic function, and relatively preserved systolic function, whereas progressive LV systolic dysfunction with less concentric remodeling was seen in men. To the best of our knowledge, the relationships of aortic stiffness by MRI with LV structure and function including myocardial deformation variables derived from MRI tagging have not been demonstrated previously, particularly in a large general population cohort.
The relationship between PWV and LV geometry has been explored extensively in hypertensive patients9, 20. Increased aortic stiffness results in increased cardiac afterload, inducing concentric remodeling. We found that arch PWV was positively correlated with both LV mass and LVMVR independent of blood pressure and other cardiovascular risk factors. These results are inconsistent with previous reports, which found that higher aortic PWV assessed by tonometry was associated with concentric remodeling as demonstrated by higher relative wall thickness using echocardiography, without a significant increase in LV mass9, 20. The difference in findings between previous studies might be a result of improved precision in both aortic and LV parameter assessment by MRI, the advantage of a larger population allowing for greater statistical power, and the difference in participants’ characteristics.
With the progressive stiffening of the elastic arteries, cardiac afterload increases because accelerated reflected wave returns earlier, during late systole, which augments the SBP and adds extra stress to the left ventricle21. Arterial stiffness is also associated with lower diastolic blood pressure and reduced coronary perfusion22. Higher systolic work and a mismatch in the ratio between myocardial supply and oxygen demand could result in reduced cardiac systolic and diastolic performance. In addition, the recent study demonstrated that greater aortic stiffness is associated with reduced longitudinal stretch-related aortic work that might lead to lower early diastolic filling10. In the present study, increased aortic arch PWV was associated with LV systolic and diastolic dysfunction. This finding is consistent with the previous study from MESA that showed the association of increased carotid artery stiffness assessed by ultrasound with impaired LV function23. Compared to the previous study, the present study highlights the association of aortic arch stiffness with myocardial deformation variables including Ecc and LV torsion as measures for systolic function, adding to LVEF which is a marker for global systolic function. Increased PWV was accompanied by impaired Ecc and LV torsion, leading to depressed LV global systolic function. Arch PWV was independently associated with LV systolic and diastolic dysfunction after adjustment for age, blood pressure and other cardiovascular risk factors, supporting the hypothesis of a direct effect of increased aortic stiffness on LV function. The association of increased PWV with reduced EDSR was attenuated after adjustment for LV geometric measures, indicating that the development of concentric remodeling with increased aortic stiffness might induce LV diastolic dysfunction.
Sex differences seem to exist in the vascular-ventricular interaction measured at the population level, with men developing greater global LV systolic dysfunction than women even though impaired Ecc was seen in both sexes with greater PWV. Previous studies demonstrated sex differences in cardiac remodeling with women having higher LV torsion than men. Torsion may act as a compensatory mechanism to maintain LVEF in the face of worse Ecc12. In the present study, the maintained torsion in women would help to maintain LVEF with increasing PWV. Several previous studies have demonstrated that women are more likely to develop concentric remodeling with pressure overload compared with men24, 25. Congruent with previous studies, the present study identified that higher LVMVR, as an indicator of concentric remodeling, related to increasing PWV was pronounced only in women after adjustment for cardiovascular risk factors. In accordance with the lever-arm theory, a greater radius difference between the endocardium and epicardium would result in increased torsion due to a helical contraction effect26. Greater LVMVR with greater PWV may contribute to maintain systolic function through maintained torsion among women in this study population. Studies have shown that greater LV fibrosis assessed by T1 mapping is associated with impaired Ecc and preserved LVEF in women, whereas in men, greater fibrosis is associated with impaired Ecc, LV torsion, and LVEF in the MESA population16. Thus, aortic stiffness in association with LV fibrosis may also contribute to the difference in the association of PWV with LV deformation variables.
Previous studies have also demonstrated that women are more vulnerable to the development of HFPEF27. Whether the impact of arterial stiffness on diastolic function is different in men and women is also debated. In the present study, aortic arch PWV was associated with EDSR as an indicator of LV diastolic dysfunction only in women, independent of cardiovascular risk factors. The development of concentric LV geometry with increasing PWV in women might also induce lower relaxation because the relationship between PWV and EDSR was attenuated after adjustment for LV mass and LVEDV. Since both arterial stiffness and diastolic dysfunction have been proposed as possible factors involved in the pathogenesis of HFPEF28, impaired LV diastolic function as well as maintained systolic function with increasing PWV in woman may be a preclinical finding in the pathway to HFPEF.
Study Limitations
The cross-sectional design of the study does not allow for the detection of cause-effect relationships, but only of associations between the studied variables. A causal link between aortic PWV and LV structure and function is suggested, but longitudinal studies are needed to confirm this hypothesis. Because our sample group was composed of older adults (52 to 92 years of age), it is not possible to generalize these results to younger adults. We might have inflated type I error due to multiple testing. We did not assess other variables such as augmentation index or reflected magnitude that represents wave reflections, besides PWV. Future studies should be conducted to assess whether other factors related to aortic stiffness influence LV structure and function. The strength of the present study is the large, community-based multi-ethnic sample of participants with detailed risk factor data and sophisticated MRI imaging data.
Conclusion
In our cross-sectional, community-based cohort study, greater aortic stiffness as demonstrated by increased aortic arch PWV was associated with reduced LV systolic and diastolic function and LV remodeling. With greater arch PWV, LV concentric remodeling, reduced LV diastolic function and relatively preserved EF accompanied with preserved torsion were seen in women, whereas reduced LV systolic function accompanied with reduced torsion and less LV remodeling were seen in men. Investigations are needed to assess the risk of future heart failure associated with increased arterial stiffness and the possible impact of therapeutic strategies aimed at improving arterial elasticity on the risk of subsequent heart failure.
Supplementary Material
Clinical Perspective.
The present study demonstrates a consistent association between aortic arch PWV, as a marker of aortic stiffness and impaired LV function in a large multiethnic cohort. The present study also demonstrates sex-specific changes in LV structure and function with increasing arch PWV. By elucidating the presence of early vascular dysfunction in the setting of subclinical left ventricular dysfunction, this study provides evidence in support of novel paradigms for understanding the pathogenesis and the progression of heart failure.
Acknowledgments
We thank the other investigators, staff, and participants of the MESA study for their valuable contributions. A full list of participating MESA investigators and institutions can be found at http://www.mesa-nhlbi.org.
Sources of Funding
This research was supported by contracts N01-HC-95159, N01-HC-95160, N01-HC-95161, N01-HC-95162, N01-HC-95163, N01-HC-95164, N01-HC-95165, N01-HC-95166, and N01-HC-95168 from the National Heart, Lung, and Blood Institute.
Footnotes
Disclosures
None.
References
- 1.Laurent S, Boutouyrie P, Asmar R, Gautier I, Laloux B, Guize L, Ducimetiere P, Benetos A. Aortic Stiffness Is an Independent Predictor of All-Cause and Cardiovascular Mortality in Hypertensive Patients. Hypertension. 2001;37:1236–1241. doi: 10.1161/01.hyp.37.5.1236. [DOI] [PubMed] [Google Scholar]
- 2.Vlachopoulos C, Aznaouridis K, Stefanadis C. Prediction of cardiovascular events and all-cause mortality with arterial stiffness: a systematic review and meta-analysis. Journal of the American College of Cardiology. 2010;55:1318–1327. doi: 10.1016/j.jacc.2009.10.061. [DOI] [PubMed] [Google Scholar]
- 3.Redheuil A, Wu CO, Kachenoura N, Ohyama Y, Yan RT, Bertoni AG, Hundley GW, Duprez DA, Jacobs DR, Jr, Daniels LB, Darwin C, Sibley C, Bluemke DA, Lima JA. Proximal Aortic Distensibility Is an Independent Predictor of All-Cause Mortality and Incident CV Events: The MESA Study. Journal of the American College of Cardiology. 2014;64:2619–2629. doi: 10.1016/j.jacc.2014.09.060. [DOI] [PMC free article] [PubMed] [Google Scholar]
- 4.Grotenhuis HB, Westenberg JJ, Steendijk P, van der Geest RJ, Ottenkamp J, Bax JJ, Jukema JW, de Roos A. Validation and reproducibility of aortic pulse wave velocity as assessed with velocity-encoded MRI. Journal of magnetic resonance imaging : JMRI. 2009;30:521–526. doi: 10.1002/jmri.21886. [DOI] [PubMed] [Google Scholar]
- 5.Noda C, Ambale Venkatesh B, Ohyama Y, Liu CY, Chamera E, Redheuil A, Teixido-Tura G, Chugh AR, Wu CO, Hundley GW, Bluemke DA, Lima JA. Reproducibility of functional aortic analysis using magnetic resonance imaging: the MESA. European heart journal cardiovascular Imaging. 2015 doi: 10.1093/ehjci/jev215. jev215. [DOI] [PMC free article] [PubMed] [Google Scholar]
- 6.Redheuil A. Cardiovascular aging: Insights from local and regional measures of aortic stiffness using magnetic resonance imaging. Artery Research. 2014;8:66–72. [Google Scholar]
- 7.Gotte MJ, Germans T, Russel IK, Zwanenburg JJ, Marcus JT, van Rossum AC, van Veldhuisen DJ. Myocardial strain and torsion quantified by cardiovascular magnetic resonance tissue tagging: studies in normal and impaired left ventricular function. Journal of the American College of Cardiology. 2006;48:2002–2011. doi: 10.1016/j.jacc.2006.07.048. [DOI] [PubMed] [Google Scholar]
- 8.Castillo E, Osman NF, Rosen BD, El-Shehaby I, Pan L, Jerosch-Herold M, Lai S, Bluemke DA, Lima JA. Quantitative assessment of regional myocardial function with MR-tagging in a multi-center study: interobserver and intraobserver agreement of fast strain analysis with Harmonic Phase (HARP) MRI. Journal of cardiovascular magnetic resonance : official journal of the Society for Cardiovascular Magnetic Resonance. 2005;7:783–791. doi: 10.1080/10976640500295417. [DOI] [PubMed] [Google Scholar]
- 9.Schillaci G, Mannarino MR, Pucci G, Pirro M, Helou J, Savarese G, Vaudo G, Mannarino E. Age-specific relationship of aortic pulse wave velocity with left ventricular geometry and function in hypertension. Hypertension. 2007;49:317–321. doi: 10.1161/01.HYP.0000255790.98391.9b. [DOI] [PubMed] [Google Scholar]
- 10.Bell V, Sigurdsson S, Westenberg JJ, Gotal JD, Torjesen AA, Aspelund T, Launer LJ, Harris TB, Gudnason V, de Roos A, Mitchell GF. Relations between aortic stiffness and left ventricular structure and function in older participants in the Age, Gene/Environment Susceptibility--Reykjavik Study. Circulation Cardiovascular imaging. 2015;8:e003039. doi: 10.1161/CIRCIMAGING.114.003039. [DOI] [PMC free article] [PubMed] [Google Scholar]
- 11.Russo C, Jin Z, Palmieri V, Homma S, Rundek T, Elkind MS, Sacco RL, Di Tullio MR. Arterial stiffness and wave reflection: sex differences and relationship with left ventricular diastolic function. Hypertension. 2012;60:362–368. doi: 10.1161/HYPERTENSIONAHA.112.191148. [DOI] [PMC free article] [PubMed] [Google Scholar]
- 12.Yoneyama K, Gjesdal O, Choi EY, Wu CO, Hundley WG, Gomes AS, Liu CY, McClelland RL, Bluemke DA, Lima JA. Age, sex, and hypertension-related remodeling influences left ventricular torsion assessed by tagged cardiac magnetic resonance in asymptomatic individuals: the multi-ethnic study of atherosclerosis. Circulation. 2012;126:2481–2490. doi: 10.1161/CIRCULATIONAHA.112.093146. [DOI] [PMC free article] [PubMed] [Google Scholar]
- 13.Bild DE, Bluemke DA, Burke GL, Detrano R, Diez Roux AV, Folsom AR, Greenland P, Jacob DR, Jr, Kronmal R, Liu K, Nelson JC, O'Leary D, Saad MF, Shea S, Szklo M, Tracy RP. Multi-ethnic study of atherosclerosis: objectives and design. Am J Epidemiol. 2002;156:871–881. doi: 10.1093/aje/kwf113. [DOI] [PubMed] [Google Scholar]
- 14.Redheuil A, Yu WC, Wu CO, Mousseaux E, de Cesare A, Yan R, Kachenoura N, Bluemke D, Lima JA. Reduced ascending aortic strain and distensibility: earliest manifestations of vascular aging in humans. Hypertension. 2010;55:319–326. doi: 10.1161/HYPERTENSIONAHA.109.141275. [DOI] [PMC free article] [PubMed] [Google Scholar]
- 15.Dogui A, Redheuil A, Lefort M, DeCesare A, Kachenoura N, Herment A, Mousseaux E. Measurement of aortic arch pulse wave velocity in cardiovascular MR: comparison of transit time estimators and description of a new approach. Journal of magnetic resonance imaging : JMRI. 2011;33:1321–1329. doi: 10.1002/jmri.22570. [DOI] [PubMed] [Google Scholar]
- 16.Donekal S, Venkatesh BA, Liu YC, Liu CY, Yoneyama K, Wu CO, Nacif M, Gomes AS, Hundley WG, Bluemke DA, Lima JA. Interstitial fibrosis, left ventricular remodeling, and myocardial mechanical behavior in a population-based multiethnic cohort: the Multi-Ethnic Study of Atherosclerosis (MESA) study. Circulation Cardiovascular imaging. 2014;7:292–302. doi: 10.1161/CIRCIMAGING.113.001073. [DOI] [PMC free article] [PubMed] [Google Scholar]
- 17.Gjesdal O, Bluemke DA, Lima JA. Cardiac remodeling at the population level--risk factors, screening, and outcomes. Nature reviews Cardiology. 2011;8:673–685. doi: 10.1038/nrcardio.2011.154. [DOI] [PubMed] [Google Scholar]
- 18.Cerqueira MD, Weissman NJ, Dilsizian V, Jacobs AK, Kaul S, Laskey WK, Pennell DJ, Rumberger JA, Ryan T, Verani MS. Standardized myocardial segmentation and nomenclature for tomographic imaging of the heart. A statement for healthcare professionals from the Cardiac Imaging Committee of the Council on Clinical Cardiology of the American Heart Association. Circulation. 2002;105:539–542. doi: 10.1161/hc0402.102975. [DOI] [PubMed] [Google Scholar]
- 19.Donekal S, Ambale-Venkatesh B, Berkowitz S, Wu CO, Choi EY, Fernandes V, Yan R, Harouni AA, Bluemke DA, Lima JA. Inter-study reproducibility of cardiovascular magnetic resonance tagging. Journal of cardiovascular magnetic resonance : official journal of the Society for Cardiovascular Magnetic Resonance. 2013;15:37. doi: 10.1186/1532-429X-15-37. [DOI] [PMC free article] [PubMed] [Google Scholar]
- 20.Roman MJ, Ganau A, Saba PS, Pini R, Pickering TG, Devereux RB. Impact of Arterial Stiffening on Left Ventricular Structure. Hypertension. 2000;36:489–494. doi: 10.1161/01.hyp.36.4.489. [DOI] [PubMed] [Google Scholar]
- 21.Murgo JP, Westerhof N, Giolma JP, Altobelli SA. Aortic input impedance in normal man: relationship to pressure wave forms. Circulation. 1980;62:105–116. doi: 10.1161/01.cir.62.1.105. [DOI] [PubMed] [Google Scholar]
- 22.Watanabe H, Ohtsuka S, Kakihana M, Sugishita Y. Coronary circulation in dogs with an experimental decrease in aortic compliance. Journal of the American College of Cardiology. 1993;21:1497–1506. doi: 10.1016/0735-1097(93)90330-4. [DOI] [PubMed] [Google Scholar]
- 23.Fernandes VR, Polak JF, Cheng S, Rosen BD, Carvalho B, Nasir K, McClelland R, Hundley G, Pearson G, O'Leary DH, Bluemke DA, Lima JA. Arterial stiffness is associated with regional ventricular systolic and diastolic dysfunction: the Multi-Ethnic Study of Atherosclerosis. Arteriosclerosis, thrombosis, and vascular biology. 2008;28:194–201. doi: 10.1161/ATVBAHA.107.156950. [DOI] [PubMed] [Google Scholar]
- 24.Hayward CS, Kelly RP. Gender-related differences in the central arterial pressure waveform. Journal of the American College of Cardiology. 1997;30:1863–1871. doi: 10.1016/s0735-1097(97)00378-1. [DOI] [PubMed] [Google Scholar]
- 25.Krumholz HM, Larson M, Levy D. Sex differences in cardiac adaptation to isolated systolic hypertension. The American journal of cardiology. 1993;72:310–313. doi: 10.1016/0002-9149(93)90678-6. [DOI] [PubMed] [Google Scholar]
- 26.Ingels NB, Jr, Hansen DE, Daughters GT, 2nd, Stinson EB, Alderman EL, Miller DC. Relation between longitudinal, circumferential, and oblique shortening and torsional deformation in the left ventricle of the transplanted human heart. Circulation research. 1989;64:915–927. doi: 10.1161/01.res.64.5.915. [DOI] [PubMed] [Google Scholar]
- 27.Scantlebury DC, Borlaug BA. Why are women more likely than men to develop heart failure with preserved ejection fraction? Current opinion in cardiology. 2011;26:562–568. doi: 10.1097/HCO.0b013e32834b7faf. [DOI] [PubMed] [Google Scholar]
- 28.Kawaguchi M. Combined Ventricular Systolic and Arterial Stiffening in Patients With Heart Failure and Preserved Ejection Fraction: Implications for Systolic and Diastolic Reserve Limitations. Circulation. 2003;107:714–720. doi: 10.1161/01.cir.0000048123.22359.a0. [DOI] [PubMed] [Google Scholar]
Associated Data
This section collects any data citations, data availability statements, or supplementary materials included in this article.