

Abstract
Objectives
A small but significant number of patients make frequent emergency department (ED) visits to multiple EDs within a region. We have a unique health information exchange (HIE) that includes every ED encounter in all hospital systems in our region. Using our HIE we were able to characterize all frequent ED users in our region, regardless of hospital visited or payer class. The objective of our study was to use data from an HIE to characterize patients in a region who are frequent ED users (FEDUs).
Methods
We constructed a database from a cohort of adult patients (18 years old or older) with information in a regional HIE for a 1-year period beginning March 2012.A Patients were defined as FEDUs (those who made four or more visits during the study period) and non-FEDUs (those who made fewer than four ED visits during the study period). Predictor variables included age, race, sex, payer class, county of residence, and International Classification of Diseases, Ninth Revision (ICD-9) codes. Bivariate (χ2) and multivariate (logistic regression) analyses were performed to determine associations between predictor variables and the outcome of being an FEDU.
Results
The database contained 127,672 patients, 12,293 (9.6%) of whom were FEDUs. Logistic regression showed the following patient characteristics to be significantly associated with the outcome of being an FEDU: age 35 to 44 years; African American race; Medicaid, Medicare, and dual-pay payer class; and ICD-9 codes 630 to 679 (complications of pregnancy, childbirth, and puerperium), 780 to 799 (ill-defined conditions), 280 to 289 (diseases of the blood), 290–319 (mental disorders), 680 to 709 (diseases of the skin and subcutaneous tissue), 710 to 739 (musculoskeletal and connective tissueB disease), 460 to 519 (respiratory disease), and 520 to 579 (digestive disease). No significant differences were noted between men and women.
Conclusions
Data from an HIE can be used to describe all of the patients within a region who are FEDUs, regardless of the hospital system they visited. This information can be used to focus care coordination efforts and link appropriate patients to a medical home. Future studies can be designed to learn the reasons why patients become FEDUs, and interventions can be developed to address deficiencies in health care that result in frequent ED visits.
Keywords: health information exchange, physician adoption, information sharing, electronic medical record, information technology
People in the United States visit emergency departments (EDs) more than 136 million times per year, and up to 28% of visits in certain areas have been made by frequent ED users (FEDUs).1–3 The definition of an FEDU varies from study to study; for the purposes of this study. we accepted the criterion of four or more ED visits per year.4,5 There is a consensus that FEDUs tend to have more substantial health problems, increased mortality, more chronic conditions, and more mental health issues.4–17 Health information exchange (HIE) has provided the first opportunity to describe FEDUs by assembling data from patients visiting all EDs within a region.
Notifying busy emergency physicians about FEDUs can inform them when it is worthwhile to query the HIE, avoiding unnecessary logons. Use of an HIE in the ED has been shown to reduce healthcare spending and time spent by healthcare providers per patient without changing treatment outcomes by eliminating or reducing duplicate testing, decreasing lengths of stay, and helping to address overcrowding in the ED.8,18–20
Improving accommodations for FEDUs may address their episodic, fragmented patterns of health care and transition them from an ED-based medical home to one that provides the benefits of a primary care provider.16 The ED is not poised to offer the benefits of primary care as espoused by the Framingham Heart Study and a large Department of Veterans Affairs cooperative study.21,22C Transfer to a medical home designed to provide longitudinal care could improve patients’ health by addressing cardiovascular risk factors and screening for cancer.
In this study, we used data from an HIE to describe all ED patients in the region of a mid-sized southeastern US city during a 1-year period beginning in March 2012.D Our dataset was comprehensive and had two advantages over the use of data from a single ED. First, every ED in our region participated in the HIE during the study period. Second, we had an “opt-out” method of registration for our HIE, which meant that unless the patient declined participation at the time of registration, he or she was included. This led to a much greater enrollment than an “opt-in” methodology, which requires patients to provide separate consent to be included in the HIE.23 In an opt-in situation participation tends to drop precipitously. No one opted out of our HIE during the study period, making it a comprehensive dataset that included every patient who visited an ED in our region during the study period. We are not aware of another HIE with such a complete dataset. We must acknowledge, however, the possibility that some patients accepted the HIE without reading the “fine print” during the registration process. This is because all four disparate hospital systems that participated in the HIE, including 11 separate EDs, reported 100% enrollment; therefore, we believe the dominant reason was that the HIE was presented in a positive manner and that patients considered the idea of HIE to be a positive one and a natural, expected next step in the evolution of electronic medical records. Furthermore, all of the patients were recorded using the same methodology, so there was no change in content when comparing and combining data from different EDs. We used this information to define the parameters that made someone more likely to be an FEDU than a non-FEDU and compared our findings with published reports. The comprehensiveness of our dataset is especially important given previous work that showed that FEDUs visited different EDs within a region to a greater extent than non-FEDUs.6
Finally, we investigated whether certain designations from the International Classification of Diseases, Ninth Edition (ICD-9) were independently associated with being FEDUs. This allowed us to identify new directions of study to better characterize FEDUs and in the future will allow us to develop ways to better meet the needs of these patients.
Methods
We constructed a database from a cohort of adult patients (18 years old or older) whose information was in a regional HIE, described previously by this group, for a 1-year period beginning March 2012.20E Patients were defined as FEDUs (those who made four or more visits during the study period) and non-FEDUs (those who made fewer than four ED visits during the study period). Predictor variables included age, race, sex, payer class, county of residence, and ICD-9 codes. Bivariate (χ2) and multivariate (logistic regression) analyses were performed to determine associations between predictor variables and the outcome of being an FEDU. Payer class was divided into self-pay (no insurance), Medicaid, Medicare, dual payer (Medicaid and Medicare), and commercial insurance. Diagnostic codes were taken from the ICD-9. Internal validation of our prediction model for FEDUs was performed using receiver operating characteristic analyses. All of the statistical computations were performed using SASF (SAS Institute, Cary, NC). As described above, our HIE used an opt-out method of registration. During the study period no patients opted out of the HIE, making our database comprehensive with respect to ED visits within the region. The study was approved by the Medical University of South Carolina’s institutional review board and by the institutional review boards of all four hospital systems participating in our HIE.
Results
The region captured by our HIE included the three counties that make up the greater Charleston area (Charleston, Dorchester, and Berkeley), with a total population of 727,689 people. Of those, 51.1% were female patients, 77.6% were older than 18 years, 13.3% were older than 65 years, 27.1% were African American, and 5.3% were Hispanic.24
The database contained 127,672 patients who made ED visits during the 1-year period beginning in April 2012G (Table 1). In all, 9.6% (12,293) of the total sample were classified as FEDUs. Average age of the total sample was 45.5 ± 19.0 (standard deviation) years old, 58.2% of the sample were female patients, and 55.2% were white; 66.5% of FEDUs were female patients, and 46.2% of FEDUs were white; 20.6% of FEDUs had primary commercial insurance and 21.1% were considered self-pay or status unknown. Of the total population from which our sample was drawn, 34% had primary commercial insurance and 25.2% were considered self-pay or status unknown.
Table 1.
Subject characteristics
| FEDUs | Total sample | ||
|---|---|---|---|
| FEDU | Non-FEDU | ||
| No. subjects (%) | 12,293 (9.6) | 115,379 (90.4) | 127,672 (100) |
| Age, y (mean, SD) | 41.5 ± 18.0 | 46.0 ± 19.1 | 45.5 ± 19.0 |
| Age group, n (%) | |||
| 18–34 | 5575 (45.4) | 41,194 (35.7) | 46,769 (36.6) |
| 35–44 | 2063 (16.8) | 17,662 (15.3) | 19,725 (15.5) |
| 45–54 | 1838 (14.9) | 18,282 (15.9) | 20,120 (15.8) |
| 55–64 | 1243 (10.1) | 15,709 (13.6) | 16,952 (13.3) |
| ≥65 | 1574 (12.8) | 22,532 (19.5) | 24,106 (18.8) |
| Sex, n (%) | |||
| Male | 4116 (33.5) | 49,190 (42.6) | 53,306 (41.8) |
| Female | 8177 (66.5) | 66,189 (57.4) | 74,366 (58.2) |
| Race, n (%) | |||
| African American | 6377 (51.9) | 45,236 (39.2) | 51,613 (40.4) |
| White | 5683 (46.2) | 64,764 (56.1) | 70,447 (55.2) |
| Other | 233 (1.9) | 5379 (4.7) | 5612 (4.4) |
| Payer, n (%) | |||
| Dual (Medicaid and Medicare) | 1015 (8.3) | 3141 (2.7) | 4156 (3.3) |
| Medicaid | 3857 (31.4) | 14,009 (12.1) | 17,866 (14.0) |
| Medicare | 1898 (15.4) | 21,816 (18.9) | 23,714 (18.6) |
| Military | 392 (3.2) | 6400 (5.6) | 6792 (5.3) |
| Commercial | 2533 (20.6) | 40,505 (35.1) | 43,038 (33.7) |
| Self-pay or status unknowna | 2598 (21.1) | 29,508 (25.6) | 32,106 (25.2) |
| Resident county, n (%) | |||
| Charleston | 6313 (51.3) | 52,098 (45.1) | 58,411 (45.8) |
| Berkeley | 3133 (25.5) | 26,335 (22.8) | 29,468 (23.1) |
| Dorchester | 2382 (19.4) | 23,481 (20.4) | 25,863 (20.2) |
| Other | 465 (3.8) | 13,465 (11.7) | 13,930 (10.9) |
| ICD-9 category (code) | |||
| Ill-defined conditions (780–799) | 9069 (73.8) | 39,854 (34.5) | 48,923 (38.3) |
| Musculoskeletal and connective tissue disease (710–739) | 4618 (37.6) | 14,457 (12.5) | 19,075 (14.9) |
| Digestive disease (460–519) | 2707 (22.0) | 8015 (6.9) | 10,722 (8.4) |
| Respiratory disease (V01–V91)A | 2589 (21.1) | 5624 (4.9) | 8213 (6.4) |
| Skin and subcutaneous tissue (680–709) | 1749 (14.2) | 3920 (3.4) | 5669 (4.4) |
| Complications of pregnancy, childbirth, and puerperium (630–679) | 1317 (10.7) | 3561 (3.1) | 4878 (3.8) |
| Mental disorders (290–319) | 1250 (10.2) | 3032 (2.6) | 4282 (3.4) |
| Diseases of the blood (280–289) | 189 (1.5) | 312 (0.3) | 501 (0.4) |
ED, emergency department; FEDUs, frequent ED users; ICD-9, International Classification of Diseases, Ninth Revision; SD, standard deviation.
Includes 492 (0.4%) with unknown payer classification.
This category was not included in the text. Is this OK? Add to text?
Table 2 shows the results of our logistic regression and includes patient characteristics found to be significantly associated with the outcome of being an FEDU. Patients aged 35 to 44 years were 16% more likely to be FEDUs than those aged 65 years and older (odds ratio [OR] 1.16, 95% confidence interval [CI] 1.02–1.32). African Americans were 9% more likely than whites to be FEDUs (OR 1.09, 95% CI 1.03–1.25). Dual-pay (Medicaid and Medicare) patients were almost three times more likely than those with commercial insurance to be FEDUs (OR 2.81, 95% CI 2.47–3.21). Patients with Medicare were 77% more likely (OR 1.77, 95% CI 1.57–1.99) and those with Medicaid were 71% more likely (OR 1.71, 95% CI 1.57–1.86) than those with commercial insurance to be FEDUs. No significant differences were noted between men and women.
Table 2.
Multivariable logistic regression
| OR (95% CI)a | |
|---|---|
| Age group, y | |
| 18–34 | 1.09 (0.96–1.23) |
| 35–44 | 1.16 (1.02–1.32)b |
| 45–54 | 1.10 (0.97–1.25) |
| 55–64 | 1.01 (0.89–1.14) |
| ≥65 (reference) | |
| Sex | |
| Male (reference) | |
| Female | 0.96 (0.90–1.02) |
| Race | |
| White (reference) | |
| African American | 1.09 (1.03–1.25)b |
| Other | 0.61 (0.51–0.73)b |
| Payer | |
| Commercial (reference) | |
| Dual (Medicaid and Medicare) | 2.81 (2.47–3.21)b |
| Medicaid | 1.71 (1.57–1.86)b |
| Medicare | 1.77 (1.57–1.99)b |
| Military | 0.97 (0.84–1.13) |
| Uninsured/status unknown | 1.07 (0.99–1.16) |
| Resident county | |
| Charleston (reference) | |
| Berkeley | 0.97 (0.91–1.04) |
| Dorchester | 0.92 (0.86–1.00) |
| Other | 0.63 (0.55–0.71)b |
| ICD-9 category (code)c | |
| Complications of pregnancy, childbirth, and puerperium (630–679) | 29.50 (26.06–33.40)b |
| Ill-defined conditions (780–799) | 19.11 (17.90–20.39)b |
| Diseases of the blood (280–289) | 15.24 (11.39–20.40)b |
| Mental disorders (290–319) | 12.82 (11.36–14.46)b |
| Skin and subcutaneous tissue (680–709) | 12.22 (11.03–13.54)b |
| Musculoskeletal and connective tissue disease (710–739) | 11.63 (10.87–12.45)b |
| Respiratory disease (V01–V91)A | 10.64 (9.77–11.59)b |
| Digestive disease (460–519) | 10.25 (9.44–11.13)b |
CI, confidence interval; ED, emergency department; FEDU, frequent ED users; ICD-9, International Classification of Diseases, Ninth Revision; OR, odds ratio.
Dependent variable: FEDU.
Statistically significant odds ratio.
In order of decreasing odds ratios.
This category was not included in the text. Is this OK? Add to text?
The associations of specific ICD-9 diagnostic categories with the outcome of being an FEDU were as follows (diagnostic category [ICD-9 codes]: OR, 95% CI): complications of pregnancy, childbirth, and the puerperium (ICD-9 630–679): OR 29.50, 95% CI 26.06–33.40; ill-defined conditions (ICD-9 780–799): OR 19.11, 95% CI 17.90–20.39; diseases of the blood (ICD-9 280–289): OR 15.24, 95% CI 11.39–20.40; mental disorders (ICD-9 290–319): OR 12.82, 95% CI 11.36–14.46; skin and subcutaneous tissue (ICD-9 680–709): OR 12.22, 95% CI 11.03–13.54; musculoskeletal and connective tissue disease (ICD-9 710–739): OR 11.63, 95% CI 10.87–12.45; respiratory disease (ICD-9 460–519): OR 10.64, 95% CI 9.77–11.59; digestive disease (ICD-9 520–579): OR 10.25, 95% CI 9.44–11.13. The Figure shows the receiver operating characteristic curve used for internal validation of our predictive model for FEDUs, with an area under the curve of 94%, which is considered to be excellent.
Discussion
The use of HIE offers many benefits to ED patients and to the emergency physicians caring for them, many of which have yet to be realized. Health information technology has provided the first opportunity to use data to characterize patients who made frequent ED visits across a region, rather than to a single institution. It also has enabled the identification of patients who visit EDs belonging to different hospital systems, which we refer to as multisystem users.25 In a previous study, we showed the advantages of cost reduction through avoidance of duplication and decreased put-through times that can result from HIE use.20 Beyond that, we believed that analysis of the data from our HIE could provide the basis for interventions designed to benefit certain patient populations within our region and improve HIE adoption by emergency physicians at the point of care.
Using the accepted definition of an FEDU as a patient with four or more ED visits per year, we were able to define an array of characteristics that made a patient significantly more likely to be an FEDU.4 Previous studies and practice experience have suggested that factors that led patients to make frequent ED visits included refractory symptoms, the diagnosis of a chronic or complicated disease, lack of a medical home, convenience issues, financial need, cultural reasons, and personal choices.4,7–11,15 We hypothesized that identifying FEDUs was important because these individuals deserve targeted interventions to improve their health. Furthermore, such patients were more likely to have visited multiple EDs, making an emergency physician’s efforts to query the HIE more successful.20,25
Our HIE used an opt-out system of registration that produced an extremely fortunate situation: no patients opted out during the study period, making our data comprehensive and removing the uncertainty that results from missing data. We are not aware of another HIE with such a complete dataset. Although our findings apply most accurately to the population from which our sample was drawn, they can be generalized with greater confidence because of this.
Although many emergency physicians would agree that some of our findings seem obvious, most notably the ICD-9 codes that showed the greatest ORs of being FEDUs, our data dictionary provided the first opportunity to demonstrate this objectively. Furthermore, some of the predictors of being FEDUs were not intuitive, most notably that self-pay patients were only 7% more likely than commercially insured patients to be FEDUs. Although it is commonly suspected that uninsured minorities make up the bulk of the patients who frequently use the ED, analysis of our data showed that this was not the case; in fact, the greatest predictor, outside of specific medical complaints, of a patient being an FEDU was having a dual Medicare and Medicaid payer classification. This supported the contention by Ragin et al that for many patients the ED is their preferred place to seek health care for any reason, rather than being a place of last resort.26
In our data, the diagnostic code with the greatest odds of being associated with the outcome of being an FEDU was “complications of pregnancy, childbirth, and the puerperium.” Upon investigating the reason for this, we retrospectively learned that those visits were explained by a practice of labor and delivery to use emergency medicine evaluation and management codes. Our study group discussed this finding and chose to retain these patients in our analysis because we could not differentiate patients who had been seen in the ED from those who had been seen in the labor and delivery departments of the various institutions. This finding also reflected the high frequency with which pregnant women sought emergency care during and after their pregnancies. Following this code was the code for those with “chronic or poorly defined disease,” suggesting that periodic, acute worsening of chronic conditions or refractory symptoms associated with them were important factors that led these patients to become FEDUs. Patients with complaints of this type are the ones most commonly believed to be FEDUs, those with general, nonspecific health issues looking for a physician assessment as quickly as possible, who are unable to wait for an appointment, or who are looking for a particular medication such as narcotics. Following that code was “diseases of the blood,” likely reflecting the large number of patients with sickle cell disease (SCD) in our region. As a result of the rapid onset and often unpredictable nature of the painful vaso-occlusive crises to which they are prone, patients with SCD often seek treatment in the ED. In the southeastern United States, patients with SCD are prevalent, and they may be overrepresented in our data. Next was the code for patients with “mental disorders,” a consequence of the ED’s role as safety net for people with mental illness. Many patients with mental disorders lack the skills to navigate the healthcare system and frequently do not have regular healthcare providers. These patients often are unable to obtain their medications, have difficulties with transportation, and have difficulty keeping doctor’s appointments. Poor coping skills may lead these patients to use the ED even for minor health issues.
Other diagnostic categories highly associated with FEDUs included “diseases of the skin and subcutaneous tissue,” which included the numerous patients with wounds, soft tissue infections, and cellulitis, a not surprising cause of frequent ED visits. Patients with “musculoskeletal and connective tissue diseases” included those with chronic orthopedic injuries, back pain, and chronic mechanical body pain, a well-known category of FEDU. Patients with chronic autoimmune disease affecting the musculoskeletal system also could be represented here. The diagnostic category of “respiratory diseases” included people with asthma, chronic obstructive pulmonary disease, and other chronic lung diseases who visited the ED regularly as a consequence of frequent, unpredictable decompensations. Patients with “digestive diseases” included those with irritable bowel syndrome, inflammatory bowel disease, and acute and chronic pancreatitis, many of whom have chronic pain and refractory symptoms. All of these conditions may, like SCD, result in unexpected and acute complications that drive patients to seek immediate relief at an ED.
In our data, African American patients were slightly but significantly more likely to be FEDUs than whites. Although previous studies have found a similarly increased likelihood in African American patients being FEDUs,2,15,27 other studies have found either no difference or a reduced likelihood that these patients are FEDUs.4,14,19 Because there was only a small increase in the chance that an African American patient was an FEDU (OR 1.09) and because of the conflicting reports on this variable in the literature, it is possible that some factor other than race is influencing this difference. One study suggested that factors such as socioeconomic status, chronic disease prevalence (ie, SCD), availability of care, and cultural attitudes about where to seek care influence the racial difference noted in ED use.15
The increased odds of the 35- to 44-year-old age group being FEDUs may be explained by their desire for convenient care that fits around work schedules and other obligations. Gindi et al showed that patients in this age group were more likely to visit the ED because of their need to seek care outside regular business hours.28 They also reported that this age group was less likely to report a lack of regular health care as a reason for choosing the ED; this may indicate that they preferred care that fit around their work schedule and other obligations. This age group contains a large proportion of the working-age public who do not have Medicare or Medicaid, who tend to be in generally good health, and who often choose not to seek routine primary care in a society that promotes immediate solutions.28,29
Finally, patients from more rural counties were less likely to be FEDUs than those from urban and suburban areas. We suspect this was the result of geographic factors. Availability of transportation is a likely contributor in that those who live further away simply cannot get a ride to the ED. Although transport via emergency medical services can overcome this obstacle, most patients do not present by this mode of transportation. It seems obvious that the less of a barrier there is to accessing the ED, the greater would be the willingness of patients to seek care there. When an ED is closer and easier to access, patients may be more likely to visit for less emergent reasons.
There are many opportunities to use HIE as a tool by which to improve healthcare delivery for FEDUs. Once identified, strategic targeting of limited resources can be directed to FEDUs to improve the coordination of their health care. Healthcare navigators could be assigned to FEDUs with the goal of identifying deficiencies that resulted in their use of the ED instead of a primary care clinic for ambulatory care–sensitive conditions, improving health care, and reducing costs.30,31 We believe that many FEDUs do not understand the difference between acute and longitudinal care. As such, these patients do not seek primary care and therefore go lacking in the management of cardiovascular risk factors and screening for cancer.
The limitations of our study included those inherent in the retrospective nature of a database study and the limited number of available variables. The reasons that patients chose to make frequent ED visits were not available to us. The social, cultural, and behavioral aspects that may have influenced our patients to become FEDUs were not identified. The criterion by which FEDUs were defined, four or more ED visits per year, may have been overly sensitive. Our data reflect the prevalence of disease in the region from which it was drawn and may not be generalizable to other regions.
Conclusions
ED volumes in the United States are increasing, and a growing population of patients are admitted exclusively through the ED.32 Overcrowding and costs continue to increase while, despite the best attempts of policymakers, many Americans continue to seek unscheduled care. One result of these negative developments has been the creation of a subset of ED patients we refer to as FEDUs. Although a distinct minority of ED patients, FEDUs account for a substantial number of visits out of proportion to their numbers. Our establishment of a comprehensive database from an HIE containing every ED visit within the region during the study period enabled us to describe these patients using their demographics, payer classifications, ZIP codes, and diagnostic categories.
Figure 1.
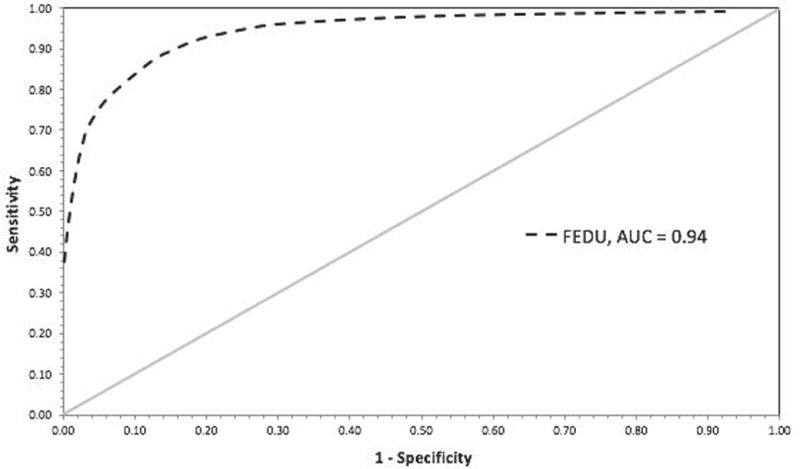
ROC curve used for internal validation of predictive model for FEDUs. AUC, area under the curve; FEDU, frequent emergency department user; ROC, receiver operating characteristic.
Key Points.
A small but significant number of patients make frequent emergency department (ED) visits within a region. Such patients are considered to be frequent ED users and are defined in the literature as those who make four or more ED visits per year.
We have a unique health information exchange (HIE) with an “opt-out” method of registration. Using our data dictionary we constructed an algorithm that characterized patients who made four or more ED visits during the study period.
Identifying frequent ED users in advance can direct an emergency physician’s use of an HIE, making the time spent logging on and viewing records more beneficial. Physicians who successfully find records in the HIE may be more likely to use it, increasing adoption of HIE.
Care coordination efforts can link appropriate patients to a medical home, where they can receive the benefits of longitudinal care, including cardiovascular risk factor modification and cancer screening.
Acknowledgments
The study was supported by the Duke Endowment and the South Carolina Clinical and Translational Research Institute, with an academic home at the Medical University of South Carolina, through National Institutes of Health Grant No. UL1 TR000062, National Center for Advancing Translational Science, Clinical and Translational Science Award Grant No. UL1TR001450.
L.L. has received compensation from Roche Pharmaceuticals, has ongoing relationships with the National Institutes of Health and Health Sciences South Carolina, with payment to the institution, and has received grant funding from the Patient Centered Outcomes Research Institute. W.P.M. has received compensation from the Continuing Medical Education Company and has minor equity holding and board membership in DDI Inc.
Footnotes
The content is solely the responsibility of the authors and does not necessarily represent the official views of the Duke Endowment Foundation or the National Institutes of Health.
The remaining authors have no financial relationships to disclose and no conflicts of interest to report.B
Pls check COI statement for accuracy.
The text says April 2012. Which is correct?
Correct expansion of MSK and CT?
References must be cited in numerical order, per SMJ style. As received, they were not, so references were renumbered/reordered consecutively.
The abstract says April. Which is correct?
The abstract says April. Which is correct?
Pls indicate which version of SAS.
Other mentions in the text are March. Which is correct?
No link to the summary could be found, only to the tables: http://www.cdc.gov/nchs/data/ahcd/nhamcs_outpatient/2011_opd_web_tables.pdf. Pls provide URL for the summary.
References
- 1.Centers for Disease Control and Prevention. National Hospital Ambulatory Medical Care Survey: 2011 emergency department summary. FastStats; 2011. [Google Scholar]
- 2.LaCalle E, Rabin E. Frequent users of emergency departments: the myths, the data, and the policy implications. Ann Emerg Med. 2010;56:42–48. doi: 10.1016/j.annemergmed.2010.01.032. [DOI] [PubMed] [Google Scholar]
- 3.Fuda KK, Immekus R. Frequent users of Massachusetts emergency departments: a statewide analysis. Ann Emerg Med. 2006;48:9–16. doi: 10.1016/j.annemergmed.2006.03.001. [DOI] [PubMed] [Google Scholar]
- 4.Hunt KA, Weber EJ, Showstack JA, et al. Characteristics of frequent users of emergency departments. Ann Emerg Med. 2006;48:1–8. doi: 10.1016/j.annemergmed.2005.12.030. [DOI] [PubMed] [Google Scholar]
- 5.Locker TE, Baston S, Mason SM, et al. Defining frequent use of an urban emergency department. Emerg Med J. 2007;24:398–401. doi: 10.1136/emj.2006.043844. [DOI] [PMC free article] [PubMed] [Google Scholar]
- 6.Chang G, Weiss AP, Orav EJ, et al. Predictors of frequent emergency department use among patients with psychiatric illness. Gen Hosp Psychiatry. 2014;36:716–720. doi: 10.1016/j.genhosppsych.2014.09.010. [DOI] [PubMed] [Google Scholar]
- 7.Shapiro JS, Johnson SA, Angiollilo J, et al. Health information exchange improves identification of frequent emergency department users. Health Aff (Millwood) 2013;32:2193–2198. doi: 10.1377/hlthaff.2013.0167. [DOI] [PubMed] [Google Scholar]
- 8.Castillo EM, Brennan JJ, Killeen JP, et al. Identifying frequent users of emergency department resources. J Emerg Med. 2014;47:343–347. doi: 10.1016/j.jemermed.2014.03.014. [DOI] [PubMed] [Google Scholar]
- 9.Rooney KD, Schilling UM. Point-of-care testing in the overcrowded emergency department—can it make a difference? Crit Care. 2014;18:692. doi: 10.1186/s13054-014-0692-9. [DOI] [PMC free article] [PubMed] [Google Scholar]
- 10.Doupe MB, Palatnick W, Day S, et al. Frequent users of emergency departments: developing standard definitions and defining prominent risk factors. Ann Emerg Med. 2012;60:24–32. doi: 10.1016/j.annemergmed.2011.11.036. [DOI] [PubMed] [Google Scholar]
- 11.Castner J, Wu YW, Mehrok N, et al. Frequent emergency department utilization and behavioral health diagnoses. Nurs Res. 2015;64:3–12. doi: 10.1097/NNR.0000000000000065. [DOI] [PubMed] [Google Scholar]
- 12.Sun BC, Burstin HR, Brennan TA. Predictors and outcomes of frequent emergency department users. Acad Emerg Med. 2003;10:320–328. doi: 10.1111/j.1553-2712.2003.tb01344.x. [DOI] [PubMed] [Google Scholar]
- 13.Sandoval E, Smith S, Walter J, et al. A comparison of frequent and infrequent visitors to an urban emergency department. J Emerg Med. 2010;38:115–121. doi: 10.1016/j.jemermed.2007.09.042. [DOI] [PubMed] [Google Scholar]
- 14.Milbrett P, Halm M. Characteristics and predictors of frequent utilization of emergency services. J Emerg Nurs. 2009;35:191–198. doi: 10.1016/j.jen.2008.04.032. [DOI] [PubMed] [Google Scholar]
- 15.Mandelberg JH, Kuhn RE, Kohn MA. Epidemiologic analysis of an urban, public emergency department’s frequent users. Acad Emerg Med. 2000;7:637–646. doi: 10.1111/j.1553-2712.2000.tb02037.x. [DOI] [PubMed] [Google Scholar]
- 16.Vinton DT, Capp R, Rooks SP, et al. Frequent users of US emergency departments: characteristics and opportunities for intervention. Emerg Med J. 2014 Jan 28; doi: 10.1136/emermed-2013-202407. [Epub ahead of print] [DOI] [PubMed] [Google Scholar]
- 17.Liu SW, Nagurney JT, Chang Y, et al. Frequent ED users: are most visits for mental health, alcohol, and drug-related complaints? Am J Emerg Med. 2013;31:1512–1515. doi: 10.1016/j.ajem.2013.08.006. [DOI] [PubMed] [Google Scholar]
- 18.Weinick RM, Burns RM, Mehrotra A. Many emergency department visits could be managed at urgent care centers and retail clinics. Health Aff (Millwood) 2010;29:1630–1636. doi: 10.1377/hlthaff.2009.0748. [DOI] [PMC free article] [PubMed] [Google Scholar]
- 19.Ondler C, Hegde GG, Carlson JN. Resource utilization and health care charges associated with the most frequent ED users. Am J Emerg Med. 2014;32:1215–1219. doi: 10.1016/j.ajem.2014.07.013. [DOI] [PubMed] [Google Scholar]
- 20.Saef SH, Melvin CL, Carr CM. Impact of a health information exchange on resource use and Medicare-allowable reimbursements at 11 emergency departments in a midsized city. West J Emerg Med. 2014;15:777–785. doi: 10.5811/westjem.2014.9.21311. [DOI] [PMC free article] [PubMed] [Google Scholar]
- 21.Framingham Heart Study. http://www.framinghamheartstudy.org. Accessed September 27, 2015.
- 22.Effects of treatment on morbidity in hypertension. Results in patients with diastolic blood pressures averaging 115 through 129 mm Hg. JAMA. 1967;202:1028–1034. [PubMed] [Google Scholar]
- 23.Shapiro JS, Crowley D, Hoxhaj S, et al. Health information exchange in emergency medicine. Ann Emerg Med. 2016;67:216–226. doi: 10.1016/j.annemergmed.2015.06.018. [DOI] [PubMed] [Google Scholar]
- 24.US Census Bureau. QuickFacts. http://www.census.gov/quickfacts/table/PST045215/45015,45035,45019,00. Accessed January 29, 2016.
- 25.Carr CM, Saef SH, Zhang J, et al. Can data from a health information exchange be used to describe patients who visit multiple emergency departments within a region? Acad Emerg Med. 2014;21(5 Suppl 1):137. [Google Scholar]
- 26.Ragin DF, Hwang U, Cydulka RK, et al. Reasons for using the emergency department: results of the EMPATH Study. Acad Emerg Med. 2005;12:1158–1166. doi: 10.1197/j.aem.2005.06.030. [DOI] [PubMed] [Google Scholar]
- 27.Lucas RH, Sanford SM. An analysis of frequent users of emergency care at an urban university hospital. Ann Emerg Med. 1998;32:563–568. doi: 10.1016/s0196-0644(98)70033-2. [DOI] [PubMed] [Google Scholar]
- 28.Gindi RM, Cohen RA, Kirzinger WK. Emergency room use among adults aged 18–64: early release of estimates from the National Health Interview Survey. 2011 Jan-Jun; http://www.cdc.gov/nchs/data/nhis/earlyrelease/emergency_room_use_january-june_2011.pdf. Published May 2012. Accessed July 3, 2015.
- 29.Schiller JS, Ward BW, Freeman G. Early release of selected estimates based on data from the 2013 National Health Interview Survey. http://www.cdc.gov/nchs/data/nhis/earlyrelease/earlyrelease201406.pdf. Published June 2014. Accessed July 3, 2015.
- 30.McWilliams A, Tapp H, Barker J, et al. Cost analysis of the use of emergency departments for primary care services in Charlotte, North Carolina. N C Med J. 2011;72:265–271. [PubMed] [Google Scholar]
- 31.Navigator reduces readmissions, inappropriate ED visits. Hosp Case Manag. 2014;22:166. [PubMed] [Google Scholar]
- 32.Morganti KG, Bauhoff S, Blanchard JC, et al. The evolving role of emergency departments in the United States. http://www.rand.org/content/dam/rand/pubs/research_reports/RR200/RR280/RAND_RR280.pdf. Published 2013. Accessed May 9, 2016. [PMC free article] [PubMed]