

Abstract
Although the p46Shc isoform has been known to be mitochondrially localized for 11 years, its function in mitochondria has been a mystery. We confirmed p46Shc to be mitochondrially localized and showed that the major mitochondrial partner of p46Shc is the lipid oxidation enzyme 3-ketoacylCoA thiolase ACAA2, to which p46Shc binds directly and with a strong affinity. Increasing p46Shc expression inhibits, and decreasing p46Shc stimulates enzymatic activity of thiolase in vitro. Thus, we suggest p46Shc to be a negative mitochondrial thiolase activity regulator, and reduction of p46Shc expression activates thiolase. This is the first demonstration of a protein that directly binds and controls thiolase activity. Thiolase was thought previously only to be regulated by metabolite balance and steady-state flux control. Thiolase is the last enzyme of the mitochondrial fatty acid beta-oxidation spiral, and thus is important for energy metabolism. Mice with reduction of p46Shc are lean, resist obesity, have higher lipid oxidation capacity, and increased thiolase activity. The thiolase-p46Shc connection shown here in vitro and in organello may be an important underlying mechanism explaining the metabolic phenotype of Shc-depleted mice in vivo.
Keywords: aging, diet, insulin, lipid metabolism, mitochondria, Shc, high fat diet resistance, longevity, p46Shc, thiolase
Introduction
Shc proteins have three isoforms: p46, p52, and p66, and have major effects on metabolism (1–4). p52Shc contacts the insulin receptor and regulates the signaling between the IRS1 and Ras pathway (5). In 2004, it was demonstrated that the major mitochondrial Shc isoform is p46Shc (6), but since that time the mitochondrial partner and physiological function of p46Shc has been a mystery. Here we show the mitochondrial partner and function of p46Shc, and suggest how this could contribute to the obesity-resistance observed in ShcKO mice.
There are three isoforms at the mammalian Shc locus, the highly expressed isoforms p46Shc and p52Shc, and the minor p66Shc. All three Shc isoforms are derived from a single DNA locus. First, two mRNA are produced: p66Shc and p52/46Shc by means of trans-splicing. The p66Shc mRNA has start codons for all three Shc isoforms. The p52/46Shc-mRNA does not have a start codon for p66Shc and only produces p52Shc and p46Shc (7). For this reason, knockdowns of either p66Shc, or all three Shc isoforms together have been achieved to date. There are two mouse models of Shc depletion produced to date: ShcL, also known as p66ShcKO developed by the Tom Prolla group (ShcProlla, Ref. 4), and Shc mice developed by the Pelicci group (ShcP or ShcPelicci, also known as p66Shc(−/−, Refs. 3, 4, 8, 9). Names in literature for these two models can be described by these definitions: ShcL, ShcProlla; ShcKO, ShcP = ShcPelicci = p66Shc(−/−).
Briefly, ShcL or ShcProlla mice have a deletion of only the minor p66Shc isoform and have no health benefits: ShcL mice are not lean, do not resist weight gain on high fat diets (HFD),2 and are not longer-lived on HFD, and do not have improved insulin sensitivity (4). Thus p66Shc deletion by itself does not result in health benefits.
By contrast, ShcKO have in addition to the deletion of minor p66Shc isoform, a major reduction of p46Shc and p52Shc expression in main energy-expending tissues: muscles (cardiac and skeletal), brown fat, and liver (3, 4). ShcKO have several health benefits, including a lean phenotype (10), resistance to genetic obesity (11), resistance to high fat diets (HFD) (4) and higher capacity for mitochondria to oxidize lipid iv vitro and iv vivo (2–4), and a metabolic shift toward increasing mitochondrial lipid oxidation (1, 2). Enzymatic activity of mitochondrial thiolase is significantly increased in these ShcKO tissues, which have reduced expression of mitochondrial p46Shc isoform (2).
We carried out mass spectrometry, two-dimensional gel electrophoresis, and bio-layer interferometry (BLI) (12–14) assays to identify the major mitochondrial partner of p46Shc. These assays identified mitochondrial 3-ketoacylCoA thiolase (ACAA2) as the p46Shc major partner. Furthermore, p46Shc modulation iv vitro and iv vivo modulates ACAA2 activity.
Mitochondrial lipid oxidation is a stepwise pathway resulting in the production of acetoacetylCoA and acetylCoA, which enters the TCA cycle to form citrate. ACAA2 thiolase catalyzes the last step of the spiral, to form acetylCoA. Specific small molecule regulators of ACAA2 activity have been shown to regulate flux through the pathway (15–17). Data suggest p46Shc to be an inhibitor of mitochondrial thiolase activity, and that p46Shc depletion activates mitochondrial thiolase and increased lipid oxidation.
Experimental Procedures
Animals
ShcKO mice were originally characterized by Refs. 8, 4; these mice were denoted “ShcP” in Ref. 4. ShcL mice were previously described in Ref. 4. Both strains, ShcKO and ShcL were re-derived using IVF into C57BL6 background. Mice were kept pathogen-free throughout the study in a barrier facility at UC Davis. All experimental procedures were approved by the Institutional Animal Care and Use Committee (IACUC) and were performed in compliance with local, state, and federal regulations. Diet was LM-485 (Teklad 7012) with nutrient composition: protein, 19.9%; carbohydrates, 53.7%; fat, 5.7%. The high fat diet was: protein, 17.7%; carbohydrates, 7.3%; fat, 60.0%. The source of lipid was soybean oil, protein (soybean meal), energy source (ground oats).
Materials
Antibodies were from Cell Signaling Inc. (Danvers, MA) except for rabbit anti-Shc, mouse anti-Shc, and anti-cytochrome c; these antibodies were from BD Biosciences (San Diego, CA). Rabbit anti-PCX and mouse anti-ACADVL antibody were from Novus Biologicals (Littletown, CO), mouse anti-tubulin, and mouse anti-ACAA2 antibody were from Sigma; mouse anti-ACAA1 was from Mito Science Inc. (Eugene, OR). Rabbit anti-CPT2 was from Epitomics Inc. (Burlingame, CA), goat anti-ETFA antibodies were from Everest Biotech (San Diego, CA). The infrared dye 700 and 800 labeled streptavidin and secondary antibody were from Li-Cor Biosciences (Lincoln, NE). The transfection reagent TransIT-LT1 was purchased from Mirus Bio LLC (Madison, WI). Plasmids were purchased from GeneCopoeia (Rockville, MD): EX-H9090-M62 for expression of human C-terminally biotinylated p46Shc, EX-C0702-M48 and EX-T3030-M48 for expression of mouse and human N-terminally biotinylated ACAA2, respectively, EX-EGFP-M48 for expression of N-terminally biotinylated GFP, and EX-T3030-M48 for expression of N-terminally biotinylated p52Shc. ShcδPTB and ShcδSH2 plasmids were constructed based on EX-T3030-M48 and EX-H9090-M62, respectively, using the following primers: 5′-gagttgcgcttcaaacaatacctc-3′, 5′-gtcgttgggatgcagccagcc-3′ to create EX-T3030-M48-p562Shcδ(44–198)PTB, and 5′-gagcggaaactgtacctcgagt-3′, 5′-gagctgctcagccatggacac-3′ to create EX-H9090-M62-p46Shcδ(329–425)SH2, using Phusion Site-Directed Mutagenesis Kit (Thermo Fisher Scientific, Inc., Rockford, IL).
Preparation and Polarographic Analysis of Subcellular Fractions from Mouse Liver
Livers were extracted from 3 m/o C57Bl6 male mice and homogenized in ice-cold fractionation buffer: 250 mm sucrose, 10 mm Tris-HCl, 1 mm EGTA, pH 7.4. Cell debris (P1) was separated from homogenates (Tot) for 5 min at 400 × g, and the supernatant (S1) centrifuged for 10 min at 700 × g for the separation of nuclei or intact unbroken cells (P2) and the supernatant (S2) centrifuged at 7000 × g for 15 min for the isolation of mitochondria (P3) and cytosolic fraction (S3). The pellet containing the mitochondria was washed twice and finally resuspended in 0.2 m mannitol, 50 mm sucrose, 1 mm EDTA, 10 mm HEPES-NaOH, pH 7.4 for the further separation of the heavy mitochondrial fraction (He), the light mitochondrial (Li), and the microsomal (MS) fractions by sequential centrifugation 10 min each at 3000 × g, 15,000 × g, and 100,000 × g, respectively. Polarographic analysis were performed by using Clark type Hansatech Oxygraph in 125 mm KCl, 10 mm MOPS-Tris, 1 mm inorganic phosphate, 100 μm EGTA, pH 7.4 with the addition of 5 mm glutamate/malate, 400 μm ADP or 1–10 mm dinitrophenol to induce, respectively, state 3 or the uncoupled state.
Cell Retroviral Infection
For stable transfection of FL83B cells we used lentiviral vectors pLKO.1 empty, PLKO.1 scramble, pLKO.1 RMM 3981-97976309 (shShc-1), pLKO.1 RMM 3981-9622377 (shShc-2), pLKO.1 RMM 3981-9622378 (shShc-3), pLKO.1 RMM 3981-9622379 (shShc-4), pLKO.1 RMM 3981-9622381 (shShc-5), and pLKO.1 RMM 3981-97076308 (shShc-6) from Open Biosystems, GE Healthcare Dharmacon Inc. (Piscataway, NJ).
Isolation of Mouse Mitochondria
Mitochondria were isolated according to Ref. 18. Briefly, livers from fasted mice were placed into ice-cold isolation medium (220 mm mannitol, 70 mm sucrose, 1 mm EDTA, 20 mm Tris, 0.1% FA-free BSA, pH 7.4), chopped, rinsed from blood, placed in 10% (w/v) isolation medium, and homogenized with six strokes at 1000 rpm. The homogenate was centrifuged at 500 × g for 10 min at 4 °C, and the resulting supernatant was decanted into clean centrifuge tubes and centrifuged at 10,000 × g for 10 min (4 °C). The supernatant was discarded, and the pellet was resuspended and washed in isolation medium with and without BSA, followed by centrifugation at 10,000 × g. The mitochondrial pellet was suspended in isolation medium without BSA (220 mm mannitol, 70 mm sucrose, 1 mm EGTA, 20 mm Tris, pH 7.4).
Bioenergetic Profiling of Mitochondria and Cells with Seahorse XF24
Mitochondria were plated (10 μg/50 μl protein per well), spun at 4 °C for 20 min at 3000 × g, and covered with 450 μm MAS-3 Seahorse assay medium (115 mm KCl, 10 mm KH2PO4, 2 mm MgCl2, 3 mm HEPES, 1 mm EGTA, 0.2% FA-free BSA), supplemented with either 10 mm succinate+2 μm rotenone, 10 mm pyruvate+5 mm malate, or 20 μm palmitoyl-l-carnitine+10 mm malonate to measure fluxes through respective oxidative processes. Oxygen consumption rates (OCR) were measured starting from basal respiration followed by sequential regimens of 2 mm ADP, 1 μm oligomycin, 50 μm FCCP, and 4 μm antimycin A/2 μm rotenone. Basal respiration was assayed in 2 cycles of mix (50 s) and measuring (2 min), ADP in one cycle of mix (50 s) and measuring (8 min), oligomycin in 1 cycle of mix (50 s) and measuring (4 min), FCCP in 1 cycle of mix (50 s) and measuring (4 min), antimycin A/rotenone in 1 cycle of mix (50 s), and measuring (4 min).
Unbuffered DMEM was used for glucose-driven OCR measurements, and KHB (111 mm NaCl, 4.7 mm KCl, 2 mm MgSO4, 1.2 mm Na2HPO4, 0.5 mm carnitine, 0.6% fat-free BSA, pH 7.4) was used to measure palmitate-driven OCR of cultured cells. FL83B cells (200 μl) of DMEM, 25 mm glucose, 10% FBS (50.000/well) onto Seahorse plates and let attach overnight; medium was changed to 2.5 mm glucose DMEM for 24 h and then changed to KHB. Regimens: BSA/sodium palmitate 0.25%/800 μm complex (palmitate), oligomycin, 1 μm; FCCP, 5 μm; rotenone, 0.1 μm; antimycin A, 1 μm. Total protein in each well was used for normalization.
HeLa cells were transfected with p66Shc specific or TotalShc-specific si-RNA as described in Ref. 7, and 150,000 cells were seeded in 200 μl of DMEM, 10% FBS, 25 mm glucose medium, and left to attach overnight. Medium was changed to KHB; cells were equilibrated for 1 h, and OCR was assayed with following regiments concentrations: BSA/sodium palmitate 0.6%/200 μm complex, oligomycin, 1 μm; FCCP, 5 μm; rotenone, 0.1 μm; antimycin A, 1 μm. Total protein in each well was used for normalization.
Co-immunoprecipitation
Mouse liver mitochondria were tested for quality as described, lysed with 4-(2-hydroxyethyl)-1-piperazineethanesulfonic acid (HEPES) lysis buffer (pH 7.5) containing 20 mm HEPES, 150 mm KCl, 0.5% CHAPS, 10% (v/v) glycerol, 1 mm phenylmethylsulfonyl fluoride, and EDTA-free complete protease inhibitor mixture (Roche). 5 mg of lysates were incubated in 600 μl of lysis buffer with 10 μg of rabbit IgG or rabbit polyclonal anti-Shc antibody and 50 μl of Dynabeads Protein G (Invitrogen Inc., Grand Island, NY) at 4 °C for 2 h. Precipitates were analyzed by Western blot with the indicated antibody. Precipitates were separated on 4–12% Bis-Tris PAGE, stained with colloid Coomassie Blue; bands were excised, and sent for mass spectrometry analysis.
Western Blotting Analysis
Proteins were isolated with cell lysis buffer (Cell Signaling Technologies), and Westerns were analyzed with the indicated antibody.
BN gel electrophoresis and second dimension SDS-PAGE followed by Western blotting were performed according to the protocol described by Wittig and Schagger (19). Mitochondria were solubilized with digitonin for 15 min on ice; buffer: 2 mm 6-aminohexanoic acid, 50 mm Bis-Tris, and 0.5 mm EDTA, pH 7.0. A digitonin/protein ratio was 6:1, as empirically determined. Samples were centrifuged 30 min at 20,000 × g at 4 °C, Coomassie Blue G-250 was added to the supernatant with ratio 8:1 (w/w). 100 μg of proteins per line were separated on Native-PAGE Novus 4–16% Bis-Tris gradient gel (Invitrogen). To verify intact protein complexes, in-gel activity of OXPHOS complexes and supercomplexes was performed as described (19–22). For the second dimension, strips of BN gels were denatured in 50 mm TrisHCl (pH 7.0), 10% glycerol, 200 mm DTT, 2% SDS, 0.1% bromphenol blue; Western blots were performed.
Analysis of Real-time Protein-Protein Interaction using BLI
Proteins we expressed in HEK T293 cells: terminally biotinylated p46Shc protein, p46Shc version lacking the PTB domain (p46ShcδPTB), p46Shc lacking the SH2 domain (p46ShcδSH2), GFP, and ACAA2 were produced using the described plasmids. Expression, purity, and biotinylation levels of proteins were verified by Western blotting. Proteins were purified with avidin agarose, and p46Shc or p46ShcδSH2 were loaded onto sets of Octet RED 384 SA biosensors (Pall ForteBio LLC., Menlo Park, CA) to a density of 7 nm followed by blocking of non-occupied streptavidin residues of biosensors with 200 μm biotin. Sensors were tested against titration series of concentrations of purified ACAA2 or GFP as follows: 3.5 μm, 1.7 μm, 0.9 μm, 433.7 nm, 216.9 nm, 108.4 nm, 54.2 nm, and 27.1 nm for both ACAA2 and GFP. Series dilutions were prepared in BLI Kinetic Buffer (Pall ForteBio LLC., Menlo Park, CA) containing 1% BSA.
We tested the full size p46Shc in parallel with p46ShcδPTB, p46ShcδSH2, and GFP against indicated concentrations of ACAA2. GFP sensors were used to compensate for possible signal drifting due to buffer changes or nonspecific bindings of ACAA2 to the sensors. A typical binding sensorgram is presented in Fig. 4a. After a stable baseline was achieved, biosensors were moved into solution that contain ACAA2 or GFP (the association step) for 900 s, then biosensors were moved into a buffer without ACAA2 or GFP (the dissociation step); log plots of responses [nm] were created against log C [nm] of thiolase, and EC50 and Hill slopes were measured.
FIGURE 4.

p46Shc can directly interact with mitochondrial thiolase, and SH2 domain of p46Shc is required for this interaction. a, human p46Shc, p46ShcδSH2, human ACAA2, and GFP were expressed in HEKT293 cells with AVI-tag and terminally biotinylated; p46Shc and p46ShcδSH2 had C-terminal AVI-tag, ACAA2, and GFP had N-terminal AVI-tag. Western blot analysis with IR-800 dye-labeled streptavidin of protein extracts are presented on c. Proteins were purified, p46Shc or p46ShcδSH2 were loaded onto sets of Octet RED 384 SA biosensors. Sensors were tested against titration series of concentrations of purified ACAA2 or GFP as follows: 3.5 μm, 1.7 μm, 0.9 μm, 433.7 nm, 216.9 nm, 108.4 nm, 54.2 nm, and 27.1 nm for both ACAA2 and GFP. Traces for 434 nm ACAA2 association and dissociation with p46Shc and with p46ShcδSH2 are shown; moment of ACAA2 regimen is indicated by arrow, dissociation starts after dashed vertical line. GFP did not interact with p46Shc. Red lines on the traces are fitting curves. The best fitting results are shown, and were obtained using 2:1 model, R2 = 0.997991, p < 0.001. Mean KD obtained from analysis of each binding sensogram was 5.1 × 10⁻⁸ m. b, bars are Octet RED 384 sensogram responses [nm] of indicated concentration of thiolase binding to p46Shc or p46ShcδSH2; responses for 434 nm and 220 nm concentrations of thiolase are shown. d, Octet RED 384 sensogram responses were plotted against log of thiolase concentration. Dose-dependent binding sigmoidal fitting analysis with variable slope reveals KD = 5.46 (±3.49) × 10−8 [m], Hill-slope coefficient: h = 2.041, and R2 = 0.9367, p < 0.001, n = 8. e, HEK cells were co-transfected with Avi-tagged p46Shc, ACAA2, p46ShcδSH2 as indicated; immunoprecipitation was performed with mouse monoclonal anti-ACAA2 antibody (Sigma); gels were Western-analyzed with IR-800 streptavidin (Li-Cor Biosciences). Lanes 1, 4, and 7 are protein extracts before immunoprecipitation; transfection mixtures are indicated. Lanes 2, 5, and 8 are immunoprecipitates with ACAA2 antibody; 3, 6, 9 are immunoprecipitates with control IGG. Bands for biotinylated p46Shc, ACAA2, and p46ShcδSH2 are indicated. The appearance of a p46Shc band in e lane 2 (indicated by a white arrow) has no corresponding Shc band in f, and g, just thiolase alone in lanes 5 and 8, supporting that p46SH2domain is the interaction motif with thiolase. Samples of experiments with p46ShcδSH2 were analyzed twice: on gel f, and loaded 2× as much on gel g.
Activities of Acyl-CoA Dehydrogenase [EC 1.3.99.13], 3-Hydroxyacyl-CoA Dehydrogenase [EC 1.1.1.35], and 3-Oxoacyl-CoA Thiolase [EC 2.3.1.16] Were Measured in Skeletal Muscle and Liver
AcylCoA dehydrogenase activity, using palmitoyl-CoA as substrate, was determined at 600 nm (ϵ = 21 mm−1 cm−1) by measuring the decrease in absorbance due to acylCoA-dependent reduction of 2,6-dichlorophenolindophenol (DCPIP) in the presence of phenazine methosulfate (PMS). The activity of 3-hydroxyacylCoA dehydrogenase, using acetoacetylCoA as substrate, was determined at 340 nm (ϵ = 6.22 mm−1 cm−1) by measuring the oxidation of NADH. The activity of 3-oxoacylCoA thiolase, using acetoacetylCoA as substrate, was determined at 303 nm (ϵ = 16.9 mm−1 cm−1) by measuring the breakdown of the thioester bond.
Statistical analysis was performed with SAS 9.4 and Excel Statistical Data Analysis Tool package 2007. Unless indicated otherwise, p values were determined with one-way ANOVA followed by Scheffe's post hoc planed comparison test; *, p < 0.1; **, p < 0.05. Survival curves were analyzed with Logrank Test using Prizm 4 for Windows Version 4.02 Software.
Results
p46Shc Is the Only Mitochondrial Shc Isoform under Physiological Conditions
p46Shc was previously reported to have cryptic N-terminal mitochondrial signal sequence and to be targeted to the mitochondria (6). p46Shc was fused with RFP and cotransfected with mito-GFP into NIH3T3 cells (Fig. 1a); Mito-GFP and p46Shc::RFP fluorescence overlapped. This is consistent with mitochondrial localization of p46Shc. Moreover, p46Shc::GFP fusion was transfected into NIH3T3 cells. As previously observed (6) p46Shc showed a clear mitochondrial pattern of distribution iv vitro (Fig. 1a). Livers from C57BL6 mice were fractionated: the highest-respiring fractions had more of the p46Shc isoform (Fig. 1b), and only p46Shc, but not p52Shc was very abundant in the purified mitochondrial fraction (He). These results are consistent with mitochondrial localization of p46Shc. This is also consistent with data published earlier by others where p46Shc was noted to be mitochondrially localized (6, 23).
FIGURE 1.

p46Shc is localized in mitochondria; stable and transient p46Shc inhibition, but not p66Shc inhibition, increases rates of beta-oxidation in vitro. a, HEK cells were transfected with constructs harboring mito-GFP and p46Shc::RFP. Confocal images (Leica Sp-2 confocal microscope 800×) are presented. p46Shc was co-localized with mito-GFP. Also, p46Shc::GFP fusion was transfected into NIH3T3 cells; p46Shc and p52Shc fluorescent images are presented (Olympus I×-81 100×). p46Shc had mitochondrial pattern of distribution. b, livers of C57BL6 mice were fractionated, and respiration of fractions was recorded and shown. Then, fractions were Western blot analyzed with mouse monoclonal anti-Shc antibody. Shc isoforms p52Shc and p46Shc are indicated, cell fractions: cell debris (P1), homogenates (Tot), supernatant 1 (S1), nuclei or intact unbroken cells (P2), supernatant 2 (S2), crude mitochondria (P3), cytosolic fraction (S3), purified mitochondrial fraction (He), microsomes and cell membrane fragments (MS) are indicated and obtained as described under “Experimental Procedures.” p46Shc was more abundant in fractions with higher oxygen consumption, and especially in purified mitochondrial fraction. c, mitochondria were isolated from liver of C57BL6 mice and lysed with CHAPS containing buffer as described under “Experimental Procedures.” IP was performed with rabbit polyclonal anti-Shc antibody; rabbit IGG fraction was used for control IP, as indicated. 10 μg of total protein from C57BL6 MEFS and p66Shc(−/−)MEFS (ShcL) was used as a control; lines are indicated. Membranes were probed with the following antibodies: mouse monoclonal anti-Shc, MnSOD, cytochrome c, and tubulin. MnSOD and cytochrome c were present in MEF cell extracts and in mitochondrial extracts but not in IP, indicating good quality of IP; the tubulin signal was present only in MEFs extracts, but not in mitochondrial extracts, nor in IPs, indicating good purity of mitochondria. Only p46Shc, but not p66Shc or p52Shc, were present in Shc-IP, indicating p46Shc localization in mitochondria. d, mouse liver cell line FL83B was transduced with lentiviruses harboring the following shRNAs: shEMPTY, shnon-silencing (NS) shShc1, shShc2, shShc3, shShc4, shShc5, and shShc6; a puromycin marker was utilized to select for stably transformed cells. Western blots for Shc isoforms are shown; shRNAs are indicated, tubulin was used as loading control. e, graph represents bioenergetic profiles of palmitate oxidation by shRNA-transduced FL83B cells shown in d. Cells were first starved in glucose-free medium, and baseline OCR was recorded for 4 cycles using Seahorse FX-24 extracellular flux analyzer. Palmitate was then supplemented to the medium, and OCR recording was continued for five cycles, followed by oligomycin regimen. Rates were normalized to total protein in each well, basal respiration was subtracted, and data were expressed as (pmol of oxygen)/(min × μg); error bars are standard errors of two control cell lines (shEMPTY and shNS) and six shShc cell lines in technical triplicate. Oligomycin inhibited oxygen consumption indicating that cells were using palmitate for mitochondrial ATP production. f, bars represent means of areas under the curves of palmitate oxidation OCR after palmitate supplement and before oligomycin regimen; indicated p value was generated by AUC-ANOVA analysis of rates shown in e. h, representative Western blot for isoform-specific Shc silencing is shown for p66Shc-specific (si-p66Shc), total Shc (si-ShcTot), and nonspecific (si-AllStar) siRNA-transfected HeLa cells. Shc isoforms and tubulin used as loading control are indicated. i, HeLa cells shown on h were tested for palmitate oxidation using the Seahorse XF-24; points are OCR % of change over basal, error bars are standard errors, regimens are indicated. g, bars represent means of OCR AUC for palmitate oxidation, after palmitate supplement and before oligomycin regimen for traces shown on i. p values of AUC-ANOVA analysis and Tukey post-test are indicated. Error bars are standard errors of the means. Four similar independent experiments were performed; each transfection in each experiment was performed in biological triplicate.
We isolated mitochondria from wild type C57Bl6 mouse liver, and tested samples for purity in an effort to isolate only physiologically active mitochondria. Samples were analyzed to be free from cytosolic contamination; Western blot analysis for mitochondrial markers MnSOD, CytC, VDAC, and cytosolic markers such as tubulin is shown (Fig. 1c, Input and Flow through). We additionally confirmed mitochondrial activity by testing for complex and supercomplex integrity and activity (Fig. 2a) and respiratory activity (RCR>4.5) on succinate and pyruvate/malate substrates in the presence/absence of ADP, oligomycin, and FCCP using the Seahorse XF24 extracellular flux analyzer, and only well-coupled, actively respiring mitochondria preparations were used for future analysis. Mitochondria were mildly disrupted, and lysates were immunoprecipitated with rabbit anti-Shc antibody. These precipitates were analyzed via Western blotting with a mouse monoclonal anti-Shc antibody, which is different from the antibody used for IP. The results indicate that p46Shc is the only isoform present in physiologically active mitochondria (Fig. 1c); no other Shc isoforms were observed in the (active) liver mitochondrial fraction.
FIGURE 2.
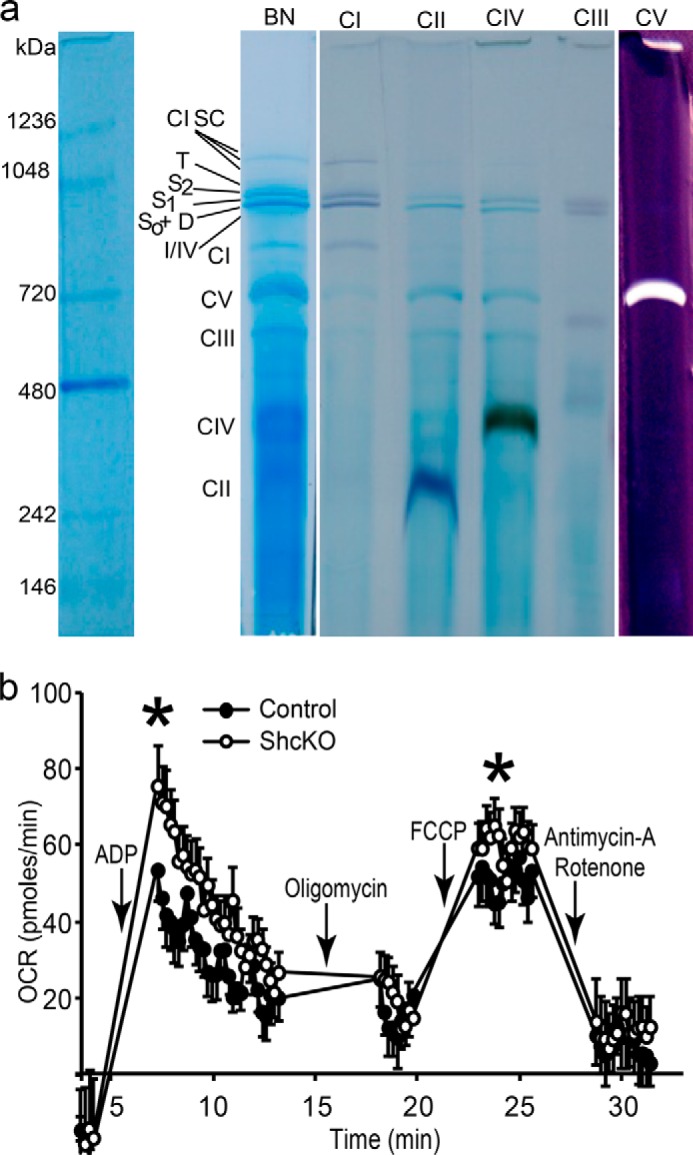
Used in all experiments, mitochondria resemble active complexes and supercomplexes. Mitochondria with reduced p46Shc level oxidize palmitate faster. a, mitochondria were isolated as described under “Experimental Procedures” and tested for quality; proteins were subject to BN gel electrophoresis. Gels were stained for activity of all mitochondrial complexes as described under “Experimental Procedures” (19). Abbreviations for complexes and supercomplexes are as follows: S0, respiratory supercomplex containing monomeric complex I and dimeric complex III; S1, supercomplexes comprising the S0 core complex and one copy of complex IV; S2, supercomplexes comprising the S0 core complex and two copies of complex IV; D, dimeric complex V; I/IV, association of complexes I and IV; T, tetrameric state of complex V; F1, subcomplex of complex V; CI SC, complex I supercomplexes. b, freshly isolated liver mitochondria were diluted and plated in amount of 10 μg/50 μl of mitochondrial protein per well. Palmitoylcarnitine was used as a substrate. Rates are OCR measured with Seahorse XF24 analyzer. Regimens are indicated. ShcKO mitochondria and control mitochondria (wild type) are indicated and were isolated from age/sex-matched mice as described under “Experimental Procedures.” p value was determined by one-way ANOVA followed by Scheffe's post hoc planed comparison test (*), p < 0.05.
Palmitate Oxidation Increases in Cells with Shc Knockdown
Six lentiviral constructs for stable silencing of Shc; all of them efficiently reduced levels of p46Shc, p66Shc, and p52Shc expression (Fig. 1d), non-silencing controls (Fig. 1d, NS) did not change Shc expression compared to “empty plasmid” transfection or un-transfected cells (Fig. 1d, Emp). Palmitate oxidation was compared in knockdowns versus controls. Cells with reduced Shc expression consumed significantly more oxygen in response to palmitate (p = 3.9E-2) (Fig. 1, e and f). This is consistent with previous findings that lipid oxidation is increased in livers of ShcP = ShcKO mice (2), where Shc expression is significantly decreased, and p46Shc is decreased to 20% of wild-type level (3, 4). Thus, the increase in palmitate oxidation is a consequence of Shc reduction.
Specific Knockdown of p66Shc Does Not Affect Palmitate Oxidation
In contrast to p46Shc and p52Shc isoforms that are on the same transcript, p66Shc can be specifically knocked down (7). When p66Shc is knocked down, there is no effect on palmitate oxidation (Fig 1, g, h, and i). The p66Shc silencing did not change the ability of cells to oxidize palmitate, p value = 0.43. By contrast, when the p46 and p52 were knocked down by the si-ShcTot siRNA, palmitate oxidation increased, p = 5.4E-3 (Fig 1, g, h, and i).
Reduction of p46Shc Expression Increases Mitochondrial Palmitate Oxidation IV Organello
ShcKO mice have reduced levels of p46Shc and p52Shc in tissues. However, p46Shc is the only mitochondrial Shc isoform. Thus we compared the capacity of liver mitochondria with WT levels of p46Shc versus 20% residual p46Shc (ShcKO) to oxidize palmitate. We observed that these purified mitochondria from ShcKO mice had a significant increase (∼30%) in palmitate oxidation capacity over controls (Ref. 2 and Fig. 2b). Consistent with this, reduction of p46Shc in brown fat cells caused an increased capacity for palmitate oxidation (3, 4).
Mitochondrial Thiolase Co-immunoprecipitates with p46Shc from Mitochondrial Protein Extracts
Because p46Shc appears to regulate beta-oxidation in mitochondria, we attempted to identify its mitochondrial partner. Shc was immunoprecipitated from mitochondrial protein extracts, and mass spectrometry (MS) analysis was performed. Bands present on Shc-IP lanes but not present in control IGG lanes (Fig. 3a) were excised. Mass spectrometry results were filtered by molecular weight and mitochondrial origin (Fig. 3b). Potential protein partners as identified by MS included: CPS1, PCX, CPT2, VLCAD, ETFA, and ACAA2. All were tested by coimmunoprecipitation with p46Shc from mitochondrial protein extracts, and only ACAA2, or thiolase, immunoprecipitated with p46Shc (Fig. 3c). Mouse thiolase has a band of ∼38 kDa.
FIGURE 3.

p46Shc is interacting with mitochondrial thiolase ACAA2. a, IP of mitochondrial protein extracts were performed as described earlier; Shc and IGG IP were separated on bis-Tris 4–12% polyacrylamide SDS gel, and stained with Coomassie Blue. Image is shown; markers of molecular weight are indicated. Bands shown different staining pattern between Shc and control IP were excited from the gel as indicated by arrows. b, mass spectrometry analysis results filtered by molecular weight of identified proteins to be approximately matching molecular weight of exited band and to be mitochondrially localized is shown; numbers are MS hits for each identified protein. c, Shc and IGG control IP of mitochondrial extracts were separated on 4–12% bis-Tris SDS-polyacrylamide gels; lines are indicated. Membranes were probed with antibody for all proteins shown on b, images for ACAA2, PCX, ETFA, ACDVL, and CPT2 are shown; tubulin, VDAC, MnSOD, and cytochrome c were used for quality control of mitochondrial isolation and purity of IP. IP was performed three times giving similar results; Western images for ACAA2 are presented for two independent experiments with different loading patterns. d, BN PAGE was carried out on purified mitochondrial protein extracted with digitonin to preserve protein complexes and active mitochondrial super-complexes, as described under “Experimental Procedures” and presented on Fig. 2a; Coomassie Blue staining is presented on the top panel, and approximate molecular weights are indicated according to native protein mass standards. BN gels lines were transferred on top of 4–12% bis-Tris SDS-polyacrylamide gel; Western blots with anti-Shc on IR-800 channel of Licor odyssey infrared imager, and anti-ACAA2, ETFA, PCX, and VDAC on IR-700 channel are shown. Analysis of p46Shc and a protein of interest are performed on the same Western blot membrane, but different channels of Licor imager to facilitate identification of proteins, which are co-migrating on BN gel. All of the proteins shown on b were analyzed; only ACAA2 was co-migrating with p46Shc on BN gel; approximate molecular weight of that complex was 120–130 kDa.
Mitochondrial Thiolase Co-migrates with p46Shc under Native Conditions
We took a second approach to identify partners by examining co-migration of p46Shc and other proteins under native conditions, because signal from co-immunoprecipitation might result from the nonspecific reaction of Shc antibody with another protein. Mitochondria were lightly lysed with digitonin in such a way that mitochondrial complexes and supercomplexes were intact and enzymatically active; again, activity was confirmed by in-gel activity staining for all five mitochondrial complexes (Fig. 2a). Mitochondrial extracts were then separated on blue native (BN) gels and transferred in the second dimension SDS-PAGE. Blots were developed with IR800 dye using rabbit anti-Shc antibody and with IR700 dye for ETFA, PCX, VLCAD (not shown), cytC (not shown), MnSOD (not shown), ACAA2, ACAA1 (not shown). VDAC was used as a control (Fig. 3d). Only ACAA2 co-migrated with p46Shc, at approximate molecular mass of 120–140 kDa on the BN gel. The co-migratory patterns of p46Shc and ACAA2 on BN gels suggested a possible interaction between the two proteins.
Mitochondrial Thiolase Directly Interacts with p46Shc with 55 nm KD
We determined that p46Shc and thiolase directly interact in vitro using BLI to detect real-time protein-protein interactions (12–14). We expressed in HEK cells and purified biotinylated ACAA2, p46Shc, p46ShcδSH2 (p46Shc lacking the SH2 domain), and GFP as a non-binding control (Fig. 4). Contact of p46Shc-loaded biosensors with thiolase solutions resulted in classical association and dissociation dose-dependent sensorgrams, whereas p46ShcδSH2 did not interact with thiolase (Fig. 4a). The mean KD obtained from analysis of each binding sensogram was 5.1 × 10⁻⁸ m; thus, binding of p46Shc to ACAA2 and thiolase might be in the middle nanomolar range. We also tested p46ShcδPTB (Shc with removed PTB domain) for direct binding to thiolase and found the same binding kinetics as with full size p46Shc (data not shown). Thus, the SH2 domain is important for direct interaction of ACAA2 with p46Shc, and the PTB domain is not. Analysis of both kinetic traces and dose responses (Fig. 4d) revealed the ratio of binding ACAA2 to p46Shc to be 2:1 and Hill slope to be ∼2, indicating that two molecules of thiolase bind to one molecule of p46Shc, or ACAA2 forms a dimer after first interacting with p46Shc. This is consistent with the approximate molecular mass of the p46Shc-ACAA2 complex on the BN electrophoresis gel (Fig. 3d): estimated to be 120–140 kDa. If the MW of p46SHc is 46 kDa and mouse thiolase ACAA2 MW is 38 kDa, than 46 kDap46Shc + 2 × 38 kDaACAA2 = 122 kDa.
Moreover, it was reported by others that enzymatically active thiolase is a dimer or tetramer (24). Thus, p46Shc can directly bind to ACAA2 in mitochondria with KD = 54.62 ± 34.87 nm (Fig. 4d). Similar results were obtained with commercially available p46Shc and ACAA2 (not shown).
Co-immunoprecipitation in Both Directions Confirms a Thiolase-p46Shc Interaction
A traditional co-immunoprecipitation approach confirmed the interaction of thiolase and p46Shc, and the necessity of the SH2 domain of p46Shc for the interaction (Fig. 4, e, f, and g). Full-size p46Shc with Avi-tag have a MW ≈ 48 kDa + biotin, MW of human ACAA2 with Avi-tag have MW ≈ 43 kDa + biotin. Only full-size p46Shc co-immunoprecipitated with ACAA2 from whole cell lysates (Fig. 4e, lane 2, white arrow); whereas no Shc was immunoprecipitated when the SH2 domain of p46Shc was deleted (p46ShcδSH2, MW ≈ 39 kDa + biotin) and co-transfected with thiolase (Fig. 4f, lane 5). We then loaded 2× samples on the gel (Fig. 4g) to determine if we could detect any interaction of p46ShcδSH2 with thiolase when we increased the sample size. There was still no Shc band detected in the IP samples (Fig. 4g, lane 8). Thus, the SH2 domain of Shc is required for this interaction.
The appearance of a p46Shc (full size MW ≈ 48 kDa + biotin) band in Fig. 4e, lane 2 (indicated by a white arrow) has no corresponding Shc band (p46ShcδSH2, MW ≈ 39 kDa + biotin) in f and g; just thiolase alone in lanes 5 and 8, suggesting that the p46Shc-SH2 domain is the interaction motif with thiolase.
p46Shc Inhibits Enzymatic Activity of Mitochondrial Thiolase
We hypothesized that p46Shc might affect thiolase enzymatic activity, because p46Shc directly interacts with ACAA2 (Figs. 3 and 4), and both proteins are localized in the mitochondria (Fig. 1). ACAA2 was co-expressed with or without p46Shc (Fig. 5a) in HEK cells, proteins were extracted, and thiolase enzymatic activity was measured. The presence of p46Shc significantly (p = 2.7E-5) reduced ACAA2 enzymatic activity (Fig. 5b). Interestingly, this regulatory activity was mitigated by detergent 1% Triton X-100 (data not shown). Perhaps, there was no difference in ACAA2 specific activity when proteins were purified in the presence of detergent because detergent disrupts many protein-protein interactions.
FIGURE 5.

p46Shc inhibits enzymatic activity of mitochondrial thiolase. a, HEK cells were transfected with ACAA2 and with or without p46Shc or p46ShcδSH2 as co-transfection; Western blot showing expression of ACAA2, p46Shc, and p46ShcδSH2 is presented. Thiolase expression was not different in samples transfected with or without p46Shc constructs. b, bars are specific thiolase enzymatic activity iv vitro expressed as [μmol/mg protein × min], and are means and standard error of three biological replicates; p value was determined by one-way ANOVA followed by Scheffe's post-analysis, indicated, n = 3, technical replication was 5. c, FL83B cells were stably transduced to silence Shc isoforms, as shown on Fig. 1d. Specific enzymatic activities of important enzymes of beta-oxidation cascade: ketoacyl-CoA thiolase, hydroxyacyl-CoA dehydrogenase, and acyl-CoA dehydrogenase were measured, in shEMPTY, shNS, shShc1, shShc2, shShc3, shShc4, and shShc5 cells. Bars are activities of indicated enzymes [μmol/mg protein × min] expressed as fold change relative to control; error bars are standard errors; p value was determined with one-way ANOVA followed by Scheffe's post-analysis, indicated, n = 2 for control cells, and n = 5 for Shc-silenced cells. d, diagram shows simplified fat-oxidation process in mitochondria: fatty acids as of palmitoyl-carnitine enter the mitochondria, and enter beta-oxidation pathway, which supplies H+ to complex I and complex III, then ACAA2 in “spiral” process generates AcCoA, which, in turn, enters the Krebs Cycle. p46Shc inhibits enzymatic activity of thiolase, and thus, regulates beta-oxidation. e and f, life span was measured in wild type (n = 14), ShcKO mice (n = 13) (e) and ShcL mice (n = 14) (f). p values were determined using log-rank test. Only ShcKO mice had a trend for extended longevity on HFD (p = 0.066), whereas ShcL mice, with only knock-out of the p66Shc isoform, did not (p > 0.9); Western blots show expression of Shc isoforms in livers of ShcKO and in ShcL mice, respectively.
When ACAA2 was co-expressed with p46ShcδSH2, no significant decrease in activity of thiolase was observed, p = 7.1E-1 (Fig. 5b). Only p46Shc can inhibit enzymatic activity of thiolase and not the p46ShcδSH2 version of p46Shc, which cannot interact with ACAA2. Thus, interaction of p46Shc with thiolase is inhibitory to enzymatic activity of the enzyme.
These data combined with the evidence for physical interaction between p46Shc and ACAA2 (Figs. 3 and 4), suggests that p46Shc contacts thiolase and regulates its activity through this interaction.
p46Shc Reduction Increases Enzymatic Activity of Mitochondrial Thiolase
If the presence of p46Shc inhibits thiolase, then silencing Shc expression should increase thiolase activity. In accordance with this, silencing of Shcs in mouse liver cell lines as shown on Fig. 1d increased mitochondrial thiolase activity but not other beta-oxidative enzymes (Fig. 5c). Thus, reduction in p46Shc abundance is stimulatory to the enzymatic activity of mitochondrial thiolase. Activities of other fatty-acid oxidation enzymes were not affected by p46Shc. Combined with results from Fig. 5, a and b, these data suggest p46Shc is a negative regulator of mitochondrial thiolase activity, and the SH2 domain is important for this inhibitory effect.
Mice with p46Shc Depletion Show a Trend Toward Increased Life Span on HFDs
As described previously (3, 4, 10, 11), ShcKO mice are lean and resist obesity on chow and HFD, their mitochondria oxidize more fat, and they have increased longevity on Ob/Ob background (2–4, 11). Thus, we performed a small pilot study to measure the longevity of ShcKO and ShcL mice on HFD. The life span was measured in wild type (n = 14), ShcKO mice (n = 13), and ShcL mice (n = 14). Only ShcP (ShcKO) mice had a trend for extended longevity on HFD (p = 0.066), whereas ShcL mice, with only the p66Shc isoform, did not (p > 0.9) (Fig. 5, e and f). On the Western blots presented on the figure, it is clear ShcKO mice have a significant reduction in major p52Shc and p46Shc expression, whereas ShcL had a deletion of only the minor p66Shc isoform.
Discussion
Because p46Shc function was unknown, we studied the activity of the only mitochondrial Shc isoform, p46Shc. Up to now the function of p46Shc has been completely unknown (6, 23).
p46Shc Binds to and Inhibits Mitochondrial Thiolase
We confirmed that under physiological conditions, p46Shc is only present in mitochondria (Fig. 1). Mitochondria with reduced p46Shc expression oxidized palmitate faster (Fig. 2). We demonstrated through co-immunoprecipitation, mass spectrometry, and two-dimensional electrophoresis that the major p46Shc interactor is thiolase (Fig. 3). Using BLI with purified proteins, we demonstrated that interaction of p46Shc with thiolase is direct and occurred with a low, specific KD (55 nm) without the mediation of other proteins, and the SH2 domain of p46Shc is important for this interaction (Fig. 4). We demonstrated that this specific interaction has consequences, in that p46Shc specifically inhibits enzymatic activity of mitochondrial thiolase and not other lipid oxidases, and that p46Shc knockdown specifically activates mitochondrial thiolase (Fig. 5).
Thiolase Regulates Lipid Oxidation Flux
3-KetoacyCoA thiolase (ACAA2) is the terminal step of mitochondrial palmitate oxidation. One question that arises from the observation that p46Shc regulates thiolase, and that mice with p46Shc reduction have increased thiolase activity and reduced adiposity (3, 4, 10, 11), is whether thiolase activity matters; whether it could regulate palmitate oxidation and lipid flux. To this point, thiolase inhibitor 2-bromo-octanoate is a specific inhibitor of ACAA2, and is a very potent inhibitor of beta-oxidation in perfused rat liver (15) and isolated rat liver mitochondria (16, 17). Thus, a specific inhibitor of thiolase inhibits and regulates beta-oxidation. The mitochondrial oxidative metabolism action of this inhibitor appears markedly restricted to beta-oxidation. Another inhibitor of mitochondrial thiolase, trimetazidine also inhibits flux through the beta-oxidation pathway. Thus, p46Shc can effectively inhibit mitochondrial beta-oxidation through inhibition of thiolase, and reduction in p46Shc stimulates mitochondrial beta-oxidation.
A direct mechanism for regulation of thiolase activity by nuclear-encoded proteins has not been previously described. Beta-oxidation regulation was previously thought to be limited to metabolite balance and steady-state flux control (25), i.e. the balance of substrates and ratios of [acetyl-CoA]/[CoASH] (26, 27), long-chain fatty acid availability (28), and redox state (29). Thus, here we demonstrated the first mechanism of mitochondrial thiolase regulation by direct binding by a nuclear-encoded protein, p46Shc and established a role of p46Shc, a mitochondrial Shc isoform, to be a negative regulator of beta-oxidation.
Attribution of p46Shc to Regulation of Beta-oxidation
We suggest that p46Shc regulates beta-oxidation in mitochondria for the following reasons: 1) palmitate is oxidized completely within mitochondria, and the only mitochondrial Shc isoform is p46Shc; 2) palmitate oxidation is limited by thiolase activity, as shown by experiments with thiolase inhibitors (15–17); 3) mitochondrial p46Shc directly binds (55 nm) and inhibits thiolase, whose activity regulates beta-oxidation, and when the p46Shc interaction region SH2 is removed it fails to bind and inhibit thiolase (Figs. 3, 4, and 5); 4) in isolated mitochondria from ShcKO mice, the reduction of the only mitochondrial Shc isoform was sufficient to increase beta-oxidation rates (Fig. 2); 5) knockdown of Shc in cells causes an increase in specific enzymatic activity of thiolase only, not other beta-oxidation enzymes, and increases beta-oxidation rates (Fig. 1). Thus, we suggest p46Shc regulates beta-oxidation via specific inhibitory interaction with thiolase.
It is technically difficult to knockdown only p46Shc and not the other Shc isoforms because they share the same transcript, and so we cannot formally exclude the possibility that p52Shc somehow indirectly regulates beta-oxidation in addition to p46Shc. However, p52Shc is not localized in the mitochondria, and it is less likely to regulate mitochondrial palmitate oxidation, and it cannot interact with mitochondrially localized thiolase because p52Shc and ACAA2 proteins are in different cell compartments. Thus, in vivo, in ShcKO mice, it is much more likely that it is solely the decreased mitochondrial p46Shc that is altering palmitate oxidation and thiolase activity.
p46Shc Regulation of Thiolase May Contribute to Obesity Resistance in ShcKO Mice
Previous studies indicate that ShcKO mice have multiple health benefits, including lean body mass, resistance to obesity on HFD, and in the context of the Ob/Ob mutation, more longevity on Ob/Ob genotype (4, 11), and a trend toward extended longevity on HFD, and significantly increased mitochondrial lipid oxidation activity (1, 2), and a global metabolic shift, in which the mitochondrial oxidation of lipids is activated. Data presented here are consistent with a contribution of p46Shc depletion to increased mitochondrial lipid oxidation, and a contribution to the ShcKO mice lean phenotype and healthy aging.
Author Contributions
A. T. designed and performed a majority of the work; N. T. performed mitochondria isolation, BN gel electrophoresis, and mitochondria quality control; Y. S. performed immunoprecipitation analysis; A. B. performed the pilot longevity study; K. K. performed statistical analysis; K. H. performed specific enzymatic activity of beta-oxidative enzymes; P. G. P. provided immunohistochemical results for p46Shc localization and analysis of oxygen consumption of cell fractions; F. H. and J. R. oversaw the nutrition of mice; and G. C. oversaw the writing of the manuscript and all work.
Acknowledgment
We thank Jennifer Gray Tomilov for editing the text of the manuscript.
This work was supported by National Institutes of Health Grant AG23311 (to G. A. C.). The authors declare that they have no conflicts of interest with the contents of this article. The content is solely the responsibility of the authors and does not necessarily represent the official views of the National Institutes of Health.
- HFD
- high fat diet
- BLI
- bio-layer interferometry
- OCR
- oxygen consumption rate
- BN
- blue native
- ACAA2
- 3-ketoacyCoA thiolase.
References
- 1.Hagopian K., Tomilov A. A., Kim K., Cortopassi G. A., and Ramsey J. J. (2015) Key glycolytic enzyme activities of skeletal muscle are decreased under Fed and Fasted states in mice with knocked down levels of Shc proteins. PloS one 10, e0124204. [DOI] [PMC free article] [PubMed] [Google Scholar]
- 2.Hagopian K., Tomilov A. A., Tomilova N., Kim K., Taylor S. L., Lam A. K., Cortopassi G. A., McDonald R. B., and Ramsey J. J. (2012) Shc proteins influence the activities of enzymes involved in fatty acid oxidation and ketogenesis. Metabolism: Clinical and Experimental 61, 1703–1713 [DOI] [PMC free article] [PubMed] [Google Scholar]
- 3.Tomilov A., Bettaieb A., Kim K., Sahdeo S., Tomilova N., Lam A., Hagopian K., Connell M., Fong J., Rowland D., Griffey S., Ramsey J., Haj F., and Cortopassi G. (2014) Shc depletion stimulates brown fat activity in vivo and in vitro. Aging Cell 26, 12267. [DOI] [PMC free article] [PubMed] [Google Scholar]
- 4.Tomilov A. A., Ramsey J. J., Hagopian K., Giorgio M., Kim K. M., Lam A., Migliaccio E., Lloyd K. C., Berniakovich I., Prolla T. A., Pelicci P., and Cortopassi G. A. (2011) The Shc locus regulates insulin signaling and adiposity in mammals. Aging Cell 10, 55–65 [DOI] [PMC free article] [PubMed] [Google Scholar]
- 5.Pelicci G., Lanfrancone L., Grignani F., McGlade J., Cavallo F., Forni G., Nicoletti I., Grignani F., Pawson T., and Pelicci P. G. (1992) A novel transforming protein (SHC) with an SH2 domain is implicated in mitogenic signal transduction. Cell 70, 93–104 [DOI] [PubMed] [Google Scholar]
- 6.Ventura A., Maccarana M., Raker V. A., and Pelicci P. G. (2004) A cryptic targeting signal induces isoform-specific localization of p46Shc to mitochondria. J. Biol. Chem. 279, 2299–2306 [DOI] [PubMed] [Google Scholar]
- 7.Kisielow M., Kleiner S., Nagasawa M., Faisal A., and Nagamine Y. (2002) Isoform-specific knockdown and expression of adaptor protein ShcA using small interfering RNA. Biochem. J. 363, 1–5 [DOI] [PMC free article] [PubMed] [Google Scholar]
- 8.Migliaccio E., Giorgio M., Mele S., Pelicci G., Reboldi P., Pandolfi P. P., Lanfrancone L., and Pelicci P. G. (1999) The p66shc adaptor protein controls oxidative stress response and life span in mammals. Nature 402, 309–313 [DOI] [PubMed] [Google Scholar]
- 9.Ramsey J. J., Tran D., Giorgio M., Griffey S. M., Koehne A., Laing S. T., Taylor S. L., Kim K., Cortopassi G. A., Lloyd K. C., Hagopian K., Tomilov A. A., Migliaccio E., Pelicci P. G., and McDonald R. B. (2014) The influence of shc proteins on life span in mice. J. Gerontol. 69, 1177–1185 [DOI] [PMC free article] [PubMed] [Google Scholar]
- 10.Berniakovich I., Trinei M., Stendardo M., Migliaccio E., Minucci S., Bernardi P., Pelicci P. G., and Giorgio M. (2008) p66Shc-generated oxidative signal promotes fat accumulation. J. Biol. Chem. 283, 34283–34293 [DOI] [PMC free article] [PubMed] [Google Scholar]
- 11.Ranieri S. C., Fusco S., Panieri E., Labate V., Mele M., Tesori V., Ferrara A. M., Maulucci G., De Spirito M., Martorana G. E., Galeotti T., and Pani G. (2010) Mammalian life-span determinant p66shcA mediates obesity-induced insulin resistance. Proc. Natl. Acad. Sci. U.S.A. 107, 13420–13425 [DOI] [PMC free article] [PubMed] [Google Scholar]
- 12.Abdiche Y. N., Malashock D. S., Pinkerton A., and Pons J. (2009) Exploring blocking assays using Octet, ProteOn, and Biacore biosensors. Anal. Biochem. 386, 172–180 [DOI] [PubMed] [Google Scholar]
- 13.Abdiche Y. N., Miles A., Eckman J., Foletti D., Van Blarcom T. J., Yeung Y. A., Pons J., and Rajpal A. (2014) High-throughput epitope binning assays on label-free array-based biosensors can yield exquisite epitope discrimination that facilitates the selection of monoclonal antibodies with functional activity. PloS One 9, e92451. [DOI] [PMC free article] [PubMed] [Google Scholar]
- 14.Wilson J. L., Scott I. M., and McMurry J. L. (2010) Optical biosensing: Kinetics of protein A-IGG binding using biolayer interferometry. Biochem. Mol. Biol. Educ. 38, 400–407 [DOI] [PubMed] [Google Scholar]
- 15.Brunengraber H., Boutry M., and Lowenstein J. M. (1973) Fatty acid and 3- -hydroxysterol synthesis in the perfused rat liver. Including measurements on the production of lactate, pyruvate, -hydroxy-butyrate, and acetoacetate by the fed liver. J. Biol. Chem. 248, 2656–2669 [PubMed] [Google Scholar]
- 16.Raaka B. M., and Lowenstein J. M. (1979) Inhibition of fatty acid oxidation by 2-bromooctanoate. Evidence for the enzymatic formation of 2-bromo-3-ketooctanoyl coenzyme A and the inhibition of 3-ketothiolase. J. Biol. Chem. 254, 6755–6762 [PubMed] [Google Scholar]
- 17.Raaka B. M., and Lowenstein J. M. (1979) Inhibition of fatty acid oxidation by 2-bromooctanoate. Including effects of bromooctanoate on ketogenesis and gluconeogenesis. J. Biol. Chem. 254, 3303–3310 [PubMed] [Google Scholar]
- 18.Frezza C., Cipolat S., and Scorrano L. (2007) Organelle isolation: functional mitochondria from mouse liver, muscle and cultured fibroblasts. Nat. Protocols 2, 287–295 [DOI] [PubMed] [Google Scholar]
- 19.Wittig I., and Schägger H. (2007) Electrophoretic methods to isolate protein complexes from mitochondria. Methods Cell Biol. 80, 723–741 [DOI] [PubMed] [Google Scholar]
- 20.Smet J., De Paepe B., Seneca S., Lissens W., Kotarsky H., De Meirleir L., Fellman V., and Van Coster R. (2011) Complex III staining in blue native polyacrylamide gels. J. Inherit. Metab. Dis. 34, 741–747 [DOI] [PubMed] [Google Scholar]
- 21.Schägger H., and von Jagow G. (1991) Blue native electrophoresis for isolation of membrane protein complexes in enzymatically active form. Anal. Biochem. 199, 223–231 [DOI] [PubMed] [Google Scholar]
- 22.Acín-Pérez R., Fernández-Silva P., Peleato M. L., Pérez-Martos A., and Enriquez J. A. (2008) Respiratory active mitochondrial supercomplexes. Mol. Cell 32, 529–539 [DOI] [PubMed] [Google Scholar]
- 23.Ljubicic V., Menzies K. J., and Hood D. A. (2010) Mitochondrial dysfunction is associated with a pro-apoptotic cellular environment in senescent cardiac muscle. Mech. Ageing Dev. 131, 79–88 [DOI] [PubMed] [Google Scholar]
- 24.Kiema T. R., Harijan R. K., Strozyk M., Fukao T., Alexson S. E., and Wierenga R. K. (2014) The crystal structure of human mitochondrial 3-ketoacyl-CoA thiolase (T1): insight into the reaction mechanism of its thiolase and thioesterase activities. Acta Crystallogr. D Biol. Crystallogr. 70, 3212–3225 [DOI] [PubMed] [Google Scholar]
- 25.Kunz W. S. (1991) Application of the theory of steady-state flux control to mitochondrial beta-oxidation. Biomed. Biochim. Acta 50, 1143–1157 [PubMed] [Google Scholar]
- 26.Wang H. Y., Baxter C. F. Jr., and Schulz H. (1991) Regulation of fatty acid beta-oxidation in rat heart mitochondria. Arch. Biochem. Biophys. 289, 274–280 [DOI] [PubMed] [Google Scholar]
- 27.Schulz H. (1994) Regulation of fatty acid oxidation in heart. J. Nutr. 124, 165–171 [DOI] [PubMed] [Google Scholar]
- 28.Nakamura M. T., Yudell B. E., and Loor J. J. (2014) Regulation of energy metabolism by long-chain fatty acids. Prog. Lipid Res. 53, 124–144 [DOI] [PubMed] [Google Scholar]
- 29.Latipää P. M., Kärki T. T., Hiltunen J. K., and Hassinen I. E. (1986) Regulation of palmitoylcarnitine oxidation in isolated rat liver mitochondria. Role of the redox state of NAD(H). Biochim. Biophys. Acta 875, 293–300 [DOI] [PubMed] [Google Scholar]