

Abstract
Background
The standard of care for glioblastoma (GBM) is maximal safe resection followed by radiation therapy with chemotherapy. Currently, contrast-enhanced MRI is used to define primary treatment volumes for surgery and radiation therapy. However, enhancement does not identify the tumor entirely, resulting in limited local control. Proton spectroscopic MRI (sMRI), a method reporting endogenous metabolism, may better define the tumor margin. Here, we develop a whole-brain sMRI pipeline and validate sMRI metrics with quantitative measures of tumor infiltration.
Methods
Whole-brain sMRI metabolite maps were coregistered with surgical planning MRI and imported into a neuronavigation system to guide tissue sampling in GBM patients receiving 5-aminolevulinic acid fluorescence-guided surgery. Samples were collected from regions with metabolic abnormalities in a biopsy-like fashion before bulk resection. Tissue fluorescence was measured ex vivo using a hand-held spectrometer. Tissue samples were immunostained for Sox2 and analyzed to quantify the density of staining cells using a novel digital pathology image analysis tool. Correlations among sMRI markers, Sox2 density, and ex vivo fluorescence were evaluated.
Results
Spectroscopic MRI biomarkers exhibit significant correlations with Sox2-positive cell density and ex vivo fluorescence. The choline to N-acetylaspartate ratio showed significant associations with each quantitative marker (Pearson's ρ = 0.82, P < .001 and ρ = 0.36, P < .0001, respectively). Clinically, sMRI metabolic abnormalities predated contrast enhancement at sites of tumor recurrence and exhibited an inverse relationship with progression-free survival.
Conclusions
As it identifies tumor infiltration and regions at high risk for recurrence, sMRI could complement conventional MRI to improve local control in GBM patients.
Keywords: 5-aminolevulinic acid, glioblastoma, quantitative histological image analysis, spectroscopic MRI, surgical and radiation therapy planning
Approximately 15 000 new cases of glioblastoma (GBM; World Health Organization [WHO] grade IV glioma) are diagnosed each year in the United States, making it the most common primary malignant brain tumor in adults.1 The standard of care for GBM is maximal safe surgical resection followed by radiation therapy (RT) with concurrent and adjuvant temozolomide chemotherapy. Despite such aggressive management, the tumor recurrence rate is high: ∼70% within 6 months of RT, and the median overall survival (OS) is 13–15 months.2 Currently, both surgery and RT are based on T1-weighted contrast-enhanced (T1w-CE) MRI using an intravenous injection of gadolinium-based contrast agents. While contrast agent accumulates in regions where GBM tumors have compromised the blood–brain barrier or exhibit leaky neovasculature, they cannot effectively reach infiltrating tumor where perfusion is limited.3,4 Multiple studies have found infiltrating tumor cells centimeters away from the contrast-enhancing mass.5 One study found that tissue extracted from a zone 6–14 mm outside of the T1w-CE region was composed of 60%–100% tumor cells.6 Furthermore, these nonenhancing regions are biologically distinct, with varying oncogenic profiles that appear to influence treatment efficacy and recurrence.3,7 Due to the remaining infiltrating cancer cells, nearly 80% of patients recur within 2 cm of the original T1w-CE tumor after therapy.8
Molecular imaging techniques, including MR spectroscopy and fluorescence microscopy, have shown promise in identifying and directing therapy to tumor-infiltrated regions beyond the T1w-CE lesion.9 Proton spectroscopy, which includes 2D-chemical shift and 3D MR spectroscopic imaging, is a molecular imaging technique that maps the metabolism of native small molecules to tumor regions in vivo without the need for exogenous tracers.10,11 Using tumor metabolism, physicians can identify and target regions of significant tumor infiltration beyond contrast diffusion even when edema is present.10,12–15 Additionally, infiltrating tumor cells can be identified intraoperatively using 5-aminolevulinic acid (5-ALA) fluorescence microscopy.16 An orally administered pro-drug, 5-ALA is readily metabolized by malignant gliomas to protoporphyrin IX, a molecular species that fluoresces red (600–700 nm) under blue-violet light (400–410 nm). Fluorescence-guided surgery (FGS) with 5-ALA allows for the real-time visualization of tumor-infiltrated tissue with exceptionally high sensitivity, specificity, and positive predictive values.17 This technique has enabled surgeons to achieve significantly more complete malignant glioma resections compared with conventional methods and, consequently, has become indispensable in neurosurgical oncology departments around the world.17
The complementary nature of MR spectroscopy and 5-ALA FGS is clear: spectroscopy allows the identification of tumor-infiltrated tissue via metabolic perturbations preoperatively, while FGS provides a method for confirming infiltration and directing the resection of tissue intraoperatively. However, the clinical use of spectroscopy has been limited due to various technical pitfalls, including low spatial resolution, limited field of view, and insufficient tools for spectral display and analysis. To overcome these limitations, we have developed an imaging pipeline utilizing state-of-the-art, high-resolution (0.1 cm3 nominal voxel size) spectroscopic imaging and automated analysis tools to allow the addition of whole-brain metabolic maps to intraoperative neuronavigation.11 Using this novel whole-brain spectroscopic MRI (sMRI) method, we performed 5-ALA FGS in a cohort of GBM patients with sMRI scans and evaluated the relationships among metabolic markers, ex vivo tissue fluorescence, and histological measures of tumor infiltration. We also measured recurrence and survival outcomes in patients on trial. Our aims are to provide quantitative evidence that sMRI noninvasively identifies infiltrating GBM tissue beyond the margin of contrast enhancement and to set forth clinical evidence for the use of sMRI to assist in directing surgery and RT in malignant gliomas.
Materials and Methods
Study Design
The objective of the surgical study was to describe the relationships among sMRI metrics, ex vivo fluorescence, and histological markers to test whether sMRI is capable of identifying infiltrating GBM tissue. Patients included in this pilot study (N = 20) were part of an institutional review board–approved prospective Phase II 5-ALA FGS trial at Emory University (2011–2014) for patients with malignant glioma. The trial included patients ≥18 years of age with normal bone marrow and normal renal and liver function, with KPS ≥ 60%, and able to provide written informed consent. Patients with deep-seated tumors, receiving experimental therapies before surgery, and with a family history of porphyrias were excluded. Tissue excised in a biopsy-like fashion from metabolically abnormal regions was analyzed as the primary endpoint. Progression-free survival (PFS; in days) was measured as a secondary outcome in those patients who had recurred after the standard of care (n = 11) per the updated Response Assessment in Neuro-Oncology (RANO) criteria.4 Survival data were frozen at August 2015 and the date of recurrence was retrospectively determined by a board-certified neuroradiologist backdating to the earliest known recurrence. Preoperative necrotic, T1w-CE, and T2w-hyperintense tissue along with T1w-CE tissue at recurrence were segmented semi-automatically with a previously described method and confirmed by a neuroradiologist.18 Banked nonneoplastic tissue (n = 24 slides) from patients who had received surgery on a previous institutional review board–approved study for treatment-refractory seizures were collected as controls.
The RT recurrence study was meant to survey the location of recurrence relative to sMRI abnormalities before the start of RT. All patients (n = 13) were part of a separate institutional review board–approved prospective Phase II sMRI-RT trial at Emory University (2014–2015). Inclusion criteria were the same as the FGS trial, and individuals with MRI-incompatible implants, medical conditions that compromise RT tolerance, or previous cranial radiation were excluded. Patients were scanned with the sMRI sequence ≤1 week prior to the beginning of RT and monitored every 1–3 months after completion of RT with standard MRI. Recurrence was determined according to the RANO criteria, and location of recurrence was noted relative to pre-RT metabolic abnormalities.
Image Acquisition and Processing
Whole-brain sMRI combining 3D echo-planar spectroscopic imaging, generalized autocalibrating partially parallel acquisitions, and elliptical k-space encoding was conducted (echo time [TE]/repetition time [TR]/flip angle [FA] = 17.6 ms/1551 ms/71 degrees) on a 3 T MRI scanner with a 32-channel head coil array (Siemens Medical). This single average sMRI sequence has a scan time of ∼19 min. Intracellular water signal was collected in an interleaved manner for signal normalization and registration with anatomical images. Raw data were processed using MIDAS (Metabolite Imaging and Data Analysis System)11,19 to give DICOM (Digital Imaging and Communications in Medicine) images with nominal voxel size of 4.4 mm × 4.4 mm × 5.6 mm. Metabolite maps generated included choline (Cho), creatine (Cr), and N-acetylaspartate (NAA), as well as Cho/NAA, Cho/Cr, and NAA/Cr ratio maps. Also acquired were T1-weighted 3D magnetization-prepared rapid-acquisition gradient echo (1 mm3, TR/TE/FA = 2300 ms/3.4 ms/9 degrees), T2w fluid-attenuated inversion recovery (FLAIR) images (TR/TE/FA = 10 000 ms/121 ms/90 degrees), and diffusion-weighted images (TR/TE/FA = 5400 ms/105 ms/90 degrees, b = 0/1000). Spectroscopic MRI maps were then imported into VelocityAI (Varian Medical Systems), an FDA 510(k)–cleared image analysis suite for the processing of multimodal medical images, for registration to the surgical planning MRI and resampling into the planning MRI space.
Tissue Sampling and Fluorescence Measurement
5-Aminolevulinic acid (Gliolan, Medac) was administered to patients orally (20 mg/kg body weight) 3–5 h before surgery. Cho/NAA ratio maps were coregistered with surgical planning MRIs and imported into the StealthStation neuronavigation system (Medtronic) to guide tissue sampling. Anatomy from water signal maps was visually compared with high-resolution anatomical imaging to verify coregistration accuracy. Specimens (1–2 per patient) were sampled in a biopsy-like fashion from areas exhibiting elevated Cho/NAA and visible fluorescence using a location-reporting probe before surgical debulking, in order to minimize navigation error due to resection-related brain shift (Fig. 1A–C). Twenty-six tissue specimens (11 from contrast-enhancing tissue, 11 from T2w/FLAIR abnormal tissue, and 4 from tissue devoid of either abnormality) were sampled in this manner. Multiple fluorescence measurements (3–5 per sample) were made immediately ex vivo using a hand-held spectrometer with the tip 5–10 mm from the tissue.20
Fig. 1.

Procedure for tissue sampling and histological analysis using sMRI and 5-ALA FGS. (A) View of anatomical and metabolic data in neuronavigation station with Cho/NAA ratio contours (yellow, 1.5-fold; green, 2-fold; orange, 5-fold; red, 10-fold increases in Cho/NAA over normal contralateral white matter). The inset image shows the 3D reconstruction of the patient surface anatomy along with the navigation probe (blue). (B) The region of metabolic abnormality was identified using a stereotactic technique with a location-reporting probe, and fluorescence was visualized using intraoperative microscopy. (C) Tissue was sampled in a biopsy-like fashion before debulking, and fluorescence was measured ex vivo. (D) Automated nuclear segmentation, digital unmixing (pictured), and nuclear classification using machine-learning techniques allowed the generation of a Sox2 density metric that was correlated with sMRI and ex vivo fluorescence signal. HXN, hematoxylin. Color bar depicts fold changes.
Sox2 Immunohistochemistry
Paraffin-embedded 5-μm sections of sampled tissue were stained for tumor infiltration using a marker for SRY (sex determining region Y)-box 2 (Sox2). Immunohistochemistry against Sox2 was performed with rabbit monoclonal antibody (1:500, ab92494; Abcam) according to the manufacturer's instructions (Dako). Visualization was established using Dako EnVision+ Dual (mouse and rabbit) Link System-HRP (K4061) and diaminobenzidine (K3467; Dako), and slides were counterstained with hematoxylin. Samples from control patients were stained similarly.
Automated Histology Slide Analysis
Tumor infiltration in terms of Sox2 density (Sox2-positive area/total tissue area) was quantified using automated, whole-slide image analysis. Sox2-stained sections were digitized at 40× magnification using Hamamatsu's High-Resolution Nanozoomer 2.0HT Whole-Slide Scanner. Automatic segmentation of nuclear boundaries was performed by digitally deconvolving hematoxylin and Sox2 signals into separate image channels (Fig. 1D). An adaptive Gaussian mixture model was trained to classify image pixels into glass, tissue, and nuclear regions using maximum likelihood optimization of the hematoxylin signal. A graph-cutting approach was used to smooth nuclear segmentation, while a marker-based watershed method was used to separate clumped nuclei. Features extracted from each nucleus were used to train a random forest classifier to label each as Sox2-positive or -negative. Total tissue area was computed as the sum of nuclear and tissue areas. Sox2 and total tissue areas were generated by multiplying the number of pixels classified as Sox2-positive or tissue, respectively, by the pixel dimensions (0.5 μm × 0.5 μm).
Spectroscopic MRI–Sox2 Analysis
Each set of coregistered metabolite volumes was imported into MATLAB (v8.4.0; MathWorks) for preprocessing and analysis. Contralateral white matter contours were used to estimate normal brain signal parameters and generate standardized maps of the abnormality index for each metabolite (AImetab) (Fig. 2). To account for potential navigation error, sMRI values to be correlated with Sox2 density were sampled from AImetab maps using an 8 mm isotropic region of interest (ROI) centered on the location of tissue extraction (Fig. 2C, blue box).
Fig. 2.

Metabolite signal normalization scheme used for sMRI analyses. (A and B) Normal appearing white matter (NAWM) in hemisphere contralateral to the tumor was segmented using a white matter probability map to estimate mean normal brain signal. (C) Normalized AI maps by linear scaling using the value in this contour. These are presurgical images of the patient in Fig. 5C. AICHO, normalized choline abnormality index map; green contour, NAWM segmentation. Color bars depict fold changes.
Statistical Methods
Statistical analyses were performed with the MATLAB Statistics and Machine Learning Toolbox, were 2-sided, and had significance set at P ≤ .05. Differences in normal and tumor tissue Sox2 densities were evaluated using a one-way ANOVA with Tukey–Kramer's multiple comparisons correction. Standardized AImetab maps were generated for each sMRI volume using a linear scaling function (Fig. 2). Mean differences and effect size for metabolite abnormalities in necrotic, contrast-enhancing, and T2w-hyperintense regions were evaluated using a MANOVA. All fluorescence measurements for a piece of tissue were averaged to generate a mean fluorescent signal. Correlations among sMRI markers, mean ex vivo fluorescence, Sox2 density, and PFS were evaluated using Pearson's correlation coefficient (ρ) with a null hypothesis of no correlation.
Results
Spectroscopic MRI Shows Metabolic Abnormalities beyond Anatomical MRI
Coregistration of sMRI maps with conventional MRI allows the display of sMRI-detectable metabolites throughout the entire brain and illustrates the metabolic heterogeneity within GBM tumors (Fig. 3A and B). The signal-to-noise ratio (SNR) for the sMRI sequence, calculated as the mean area under the NAA peak divided by the peak-to-peak noise, is outstanding (SNR = 39.7 ± 14.7), resulting in highly sensitive, quantitative metabolite maps (see Supplementary Fig. S1 for spectra). In the case pictured, increases in Cho, a marker of membrane synthesis and cellular proliferation, and decreases in NAA, a marker of neuronal integrity, expand well beyond the T1w-CE and T2w signal abnormalities, indicating the potential infiltration of tumor cells across the genu of the corpus callosum. Conversely, Cr, a marker of cellular energetics, remains relatively unchanged, with the exception of the central necrotic portion of the tumor, where it is nearly absent. The intracellular water signal is acquired in an interleaved fashion with the spectral data (Fig. 2C) and serves as a source of anatomical features for affine image registration, as well as a denominator for the absolute quantification of metabolite concentrations.
Fig. 3.

Spectroscopic MRI quantitatively maps small-molecule metabolism throughout the entire brain and describes metabolic abnormalities outside of conventional anatomical MRI. (A and B) Metabolite maps (Cho, NAA, and Cr) show abnormalities beyond T1w-CE or T2w imaging and give insight into the metabolic heterogeneity of the tumor and surrounding tissue. (C) Internal water signal is used as a denominator of metabolite signal, allowing the generation of absolute metabolite concentrations. Color bars depict fold changes.
Over 1.3 million voxels from segmented necrotic, contrast-enhancing, and T2w-hyperintense tissue ROIs were evaluated for metabolic abnormalities. The average fold change in each metabolite for all 20 presurgical patients can be found in Supplementary Table S1 along with the percent variance in each region explained by metabolic changes (ie, effect size for group mean difference, η2). There was a statistically significant difference in the mean metabolite abnormalities observed in each ROI from these patients, indicating that each exhibits a distinct metabolic profile (Wilks’ lambda [Λ; first dimension] = 0.64, P < .001; Wilks’ Λ [second dimension] = 0.94, P < .001). Though each imaging value exhibited a statistically significant contribution, only Cho/NAA, Cho/Cr, and NAA exhibited moderate to strong effect in differentiating each ROI (η2= 0.11, 0.21, and 0.10, respectively).
Integration of Spectroscopic MRI into the Neuronavigation System
Maps of sMRIs were integrated into the surgical neuronavigation station by fusion with standard anatomical MRIs to allow real-time guidance of surgeons to metabolically abnormal tissue (Fig. 1A). Each sMRI map was resampled into the anatomical MRI space for transfer to the neuronavigation system. Fusion of these images with the neuronavigation system's fiducial coordinate system allows the real-time guidance of surgical instruments to a selected target with exceptional accuracy. Contours representing various degrees of metabolic abnormality to be targeted are generated to describe abnormality thresholds.
Automated Histology Slide Image Analysis Gives an Objective Marker of Tumor Infiltration
An automated whole-slide image analysis approach was developed to objectively quantify the density of immunostained tumor cells in tissue specimens. Sox2 is a transcription factor known to maintain pluripotency in stem cells; however, immunohistochemistry for Sox2 shows remarkable specificity for infiltrating neoplastic cells in glioma.21 A hematoxylin counterstain allows the delineation of nuclear boundaries; and the deconvolution of hematoxylin and Sox2 signals into separate image channels with digital unmixing allows the automated classification of Sox2-positive and -negative populations (Fig. 1D).22 Sox2 density (mm2 Sox2/mm2 tissue), a quantitative metric of tumor infiltration in a tissue section, can then be calculated as the area of Sox2-positive nuclei over the area of total tissue on each slide. Using this method, the Sox2 densities in GBM (contrast-enhancing and nonenhancing regions) from Cho/NAA abnormal regions and control tissue samples were found to be 0.037 ± 0.048, 0.035 ± 0.040, and 0.001 ± 0.0009 mm2 Sox2/mm2 tissue, respectively. Sox2 densities in nonenhancing and enhancing tissue were found to be significantly elevated relative to tissue acquired from controls (P < .01 and P < .001, respectively), although no significant difference in Sox2 density was observed between them (P = .97). Although too few were acquired for a properly powered comparison (n = 4), as sampling was generally targeted within T2w abnormal regions, tissue samples outside of T2w hyperintensities also exhibited elevated Sox2 density, with a mean of 0.065 ± 0.040 mm2 Sox2/mm2 tissue (Fig. 4A–D). Objective histological analysis not only confirms that tumor infiltration occurs in regions with Cho/NAA abnormalities regardless of contrast enhancement, but also suggests that elevations in Cho/NAA may be able to identify infiltration beyond T2w abnormalities.
Fig. 4.
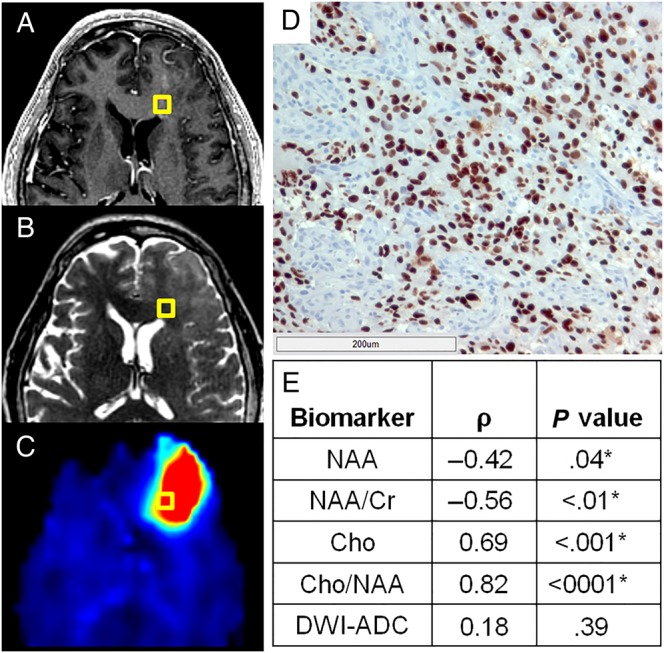
A normalized metric of tumor infiltration, Sox2 density, identifies tumor outside of conventional imaging and exhibits striking correlations with sMRI biomarkers. Though no obvious abnormality can be found on preoperative T1w-CE (A) or T2w imaging (B) in this patient, a striking elevation in Cho/NAA (C) on sMRI suggests substantial tumor infiltration. (D) A light micrograph of tissue (including 200 μm scale bar) from the gold box showed elevations in Sox2 density along with the microvascular proliferation and nuclear atypia suggestive of GBM. (E) Statistically significant correlations were seen between various normalized metabolic markers and Sox2 density, with Cho/NAA exhibiting the strongest association. *Significant at P < .05. DWI-ADC, diffusion-weighted image–apparent diffusion coefficient.
Spectroscopic MRI Markers Exhibit Significant Correlations with Sox2 Density
AImetab maps depicting standardized metabolic changes between patients were used to evaluate the correlation between sMRI markers and Sox2 density. Significantly elevated Sox2 densities were found in all tissues from Cho/NAA abnormal regions exhibiting T1w-CE and T2w abnormalities, as well as in tissue outside of both abnormalities. Cho/NAA and Cho were the markers most highly correlated with Sox2 density, exhibiting strong, statistically significant associations (Fig. 4E and Supplementary Table S2). NAA and NAA/Cr maps both exhibited moderate negative correlations, while Cho/Cr and Cr did not exhibit significant correlations with Sox2 density (ρ = 0.35, P = .08 and ρ = 0.24, P = .23, respectively). In addition, the apparent diffusion coefficient, a diffusion-weighted imaging marker generally associated with the cellularity of tissue, did not exhibit significant correlation with Sox2 density (ρ = 0.18, P = .39). The coupling of stereotactic tissue sampling with objective histological analysis suggests a striking relationship between sMRI metabolic abnormalities and the infiltration of GBM into normal-appearing brain tissue.
Ex vivo Tissue Fluorescence Correlates with sMRI Markers and Sox2 Density
The average fluorescence signal measured in tumor specimens ex vivo was compared with both sMRI markers and Sox2 density. Fluorescence was measurable in all tissues from Cho/NAA abnormal regions with an average fluorescence signal of 2.15 × 10⁶ ± 1.29 × 10⁶. These measurements exhibited a strong, statistically significant correlation with Sox2 density (ρ = 0.64, P = 5E-6). Furthermore, Cho/NAA and Cho exhibited statistically significant associations with ex vivo fluorescence (ρ = 0.36, P < .0001; ρ = 0.40, P < .001). Thus, not only is ex vivo fluorescence highly associated with a histological marker of tissue infiltration (Sox2 density), but it also exhibits significant associations with metabolic markers generated preoperatively with sMRI.
Cho/NAA Identifies Regions at High Risk for Tumor Recurrence
All patients in this analysis had histopathologically confirmed GBM, completed RT (30 fractions of 2 Gy), and received follow-up care at a single institution. Five of the 13 patients on trial had documented T1w-CE progression (38.5%) as of August 2015, and each recurrence was confirmed by serial imaging or histopathology. While both Cho and Cho/NAA measures showed high correlations with infiltration, Cho/NAA was chosen to evaluate recurrence, as it is a more sensitive marker for identifying regions at risk for recurrence.23,24 Red contours depicting 2-fold elevations in Cho/NAA (compared with contralateral normal-appearing white matter) are shown on each image to depict regions with a high likelihood of tumor infiltration.25 This level of elevation equates to a mean Z-score of 6.62 in these patients, suggesting the identification of metabolic abnormalities with >99.999% confidence.
All patients who had tumor recurrence in the follow-up period showed contrast enhancement in regions that exhibited Cho/NAA abnormalities before RT; a few examples of this can be found in Fig. 5. Row A in Fig. 5, Cho/NAA elevation at the posterior aspect of the tumor resection cavity predates the appearance of a T1w-CE lesion in that region by roughly 5 months. This lesion continued to grow after the recurrence date, resulting in increased spatial agreement with the pre-RT 2-fold Cho/NAA abnormality (Z-score = 7.57 [tissue classified as abnormal with >99.999% confidence]). Similarly, in a patient with a large frontal GBM, pre-RT Cho/NAA abnormalities anterior to the resection cavity and even across the midline approximate later tumor recurrence volumes nearly 5 months after completion of RT (Fig. 5B). The morphology of the T1w-CE lesion continued to evolve throughout the follow-up period to further approximate the morphology of the pre-RT 2-fold Cho/NAA abnormality (Z-score = 5.75 [tissue classified as abnormal with >99.999% confidence]).
Fig. 5.

Abnormalities in Cho/NAA describe regions at high risk for recurrence before RT in GBM. Coregistered T1w-CE (first column), T2w/FLAIR (second column), and Cho/NAA (third column) images taken before RT are shown with first recurrence on T1w-CE imaging after RT (fourth column). (A) In a patient with no residual contrast-enhancing disease and a T2w abnormality that surrounded the entire resection cavity, increased Cho/NAA at the posterior aspect of the resection cavity is spatially coherent with the site of first recurrence 5 months after RT. (B) Cho/NAA abnormalities anterior and contralateral to enhancing tumor before RT predate expansion into these regions 4 months after RT. Though no T2w abnormality was found contralaterally before RT, the metabolic signature of tumor was present. (C) Pre-RT Cho/NAA map clearly shows infiltration of subependymal space that becomes contrast enhancing 4 months later. The red contour illustrates the regions that exhibit a Cho/NAA abnormality ≥2-fold higher than normal contralateral brain. Color bars depict fold changes.
In some cases where GBM recurrence was observed, the recurrence sites exhibited clear metabolic abnormalities before surgical resection. For example, the 40-year-old patient depicted in Fig. 5C exhibited a striking tail of Cho/NAA elevation that coursed along the occipital horn of the left lateral ventricle even before surgery (Fig. 2C). This abnormality continued to grow through the duration of RT, ultimately resulting in overt tumor invasion along the trajectory of the 2-fold Cho/NAA abnormality (Z-score = 6.53 [tissue classified as abnormal with >99.999% confidence]).
Cho/NAA Ratio in T2w-Hyperintense Regions Correlates with Progression-Free Survival
Segmentation of necrotic, T1w-CE, and T2w abnormalities using a previously described semi-automated, blob-based algorithm allowed the comparison of quantitative sMRI findings with survival outcomes.18 When Cho/NAA statistics in each segmentation were analyzed (mean, median, maximum, etc), a striking relationship between Cho/NAA values in the T2w abnormality and PFS was identified (Fig. 6). Patients who exhibited high maximum Cho/NAA values within the T2w abnormality (not including necrosis or contrast-enhancing tissue) preoperatively had shorter PFS than those with lower values in this region (ρ = −0.74, P = .012). No trend between Cho/NAA values within necrotic or enhancing regions and PFS were found, however.
Fig. 6.

Peritumoral Cho/NAA abnormalities are associated with PFS. (A–C) Patients with high maximum Cho/NAA values within the T2w-hyperintense region outside of contrast-enhancing and necrotic tissue before RT appear to exhibit poorer survival, in terms of PFS, than those (D) who have lower maximal Cho/NAA values in this region. Pink contour, T2w-hyperintense region; blue contour, T1w-CE region. Color bar depicts fold changes.
Discussion
GBM is a devastating disease, with the vast majority of patients exhibiting recurrence within 6 months despite aggressive treatment.2 It has long been suspected that the standard treatment regimen is not optimally effective because conventional imaging does not allow reliable targeting of the entire GBM tumor: T1w-CE imaging does not identify infiltrative margins and T2w imaging is not specific for tumor tissue.26–28 Conversely, spectroscopic techniques are not limited by contrast diffusion (unlike T1w-CE imaging) and are not obscured by the presence of edema (unlike T2w imaging).14,15 Although prospective spectroscopy-histology studies have generated compelling results in the past, the low spatial resolution and limited field of view of sequences used in these studies, and even those currently available clinically, hinder the clinical use of the technology severely.12,13,29–31 As such, spectroscopy has been relegated to a supportive role in glioma diagnosis only. To overcome such imaging limitations, a spectroscopy pipeline utilizing a state-of-the-art pulse sequence and processing tools was developed for the generation of high-resolution, whole-brain sMRIs that are easily imported into standard intraoperative neuronavigation stations. Moreover, to overcome bias in histological interpretation, quantitative image analysis techniques were used for the objective and automated evaluation of microscopic tumor infiltration.
The combination of standardized, high-resolution metabolic mapping, precise stereotactic tissue extraction, and quantitative tissue section analysis allows the correlation of metabolic abnormality with histology at an unprecedented level of accuracy. Combining these tools, we confirm the presence of tumor-infiltrated tissue beyond T1w-CE and T2w lesions, as well as the similarity of tumor infiltration in metabolically abnormal contrast-enhancing and nonenhancing peritumoral regions. These results imply substantial tumor infiltration beyond regions conventionally targeted for resection or RT. The results also suggest that the absence of contrast enhancement does not signify the absence of bulk tumor, thus supporting previous suspicions concerning the inadequacy of anatomical imaging for therapy planning in GBM. Furthermore, sMRI metrics exhibit significant associations with 2 quantitative measures of tissue infiltration—Sox2 density and ex vivo tissue fluorescence—supporting the hypothesis that sMRI identifies tumor-infiltrated tissue in vivo. Lastly, Cho/NAA not only identifies regions at high risk for contrast-enhancing recurrence, but also shows a significant association with PFS in a small cohort of GBM patients. Taken together, the findings in this work represent the first in-human study to (i) combine high-resolution, whole-brain sMRI, and 5-ALA FGS for real-time intraoperative neuronavigation in GBM, (ii) describe sMRI abnormalities using both ex vivo fluorescence and quantitative histological metrics, and (iii) survey the capacity that sMRI may have for assessing clinical outcomes such as the location of recurrence and time to recurrence.
This study has limitations common to other pilot neurosurgical studies: small sample sizes for both tissue sampling and recurrence analyses. However, even given the sample size, the analytical techniques are robust enough to describe striking relationships among histology, tissue fluorescence, and sMRI markers. Moreover, the recurrence and PFS data remain unchanged, further supporting the claim that sMRI can identify tumor-infiltrated tissue. Lastly, we were unable to sample normal tissue outside of Cho/NAA abnormal and fluorescent regions in FGS patients, making it impossible to determine baseline Sox2 densities and diagnostic accuracy. This is a problem common to neurosurgical studies, as it is considered negligent to acquire normally functioning tissue, which often requires sampling of the contralateral hemisphere in GBM, at the risk of causing extensive neurological injury. Though unfortunate, this is a component of neurosurgical studies that is insurmountable and thus is accepted in the field. Even in light of these limitations, the data support the claims that sMRI can identify brain regions that are tumor infiltrated, regions that are at high risk for recurrence, and regions that could be specifically targeted with surgery and RT in an attempt to decrease the likelihood of local progression in GBM.
High-resolution, whole-brain sMRI could prove to be an excellent method for obtaining the complementary metabolic information necessary to preoperatively identify sites of significant tumor infiltration and to direct 5-ALA FGS to tumor-infiltrated regions that appear normal on conventional MRI. Furthermore, as the intensity of metabolic abnormality in the T2w-hyperintense component of the tumor is shown to be associated with progression, the expansion of high-dose RT boost volumes (≥60 Gy) to encompass these regions may possibly decrease the rate of local recurrence as well. Apart from GBM, a number of other intracranial tumors lie within the exciting potential of sMRI to improve their diagnosis, targeting, and response assessment. This is especially true for lower-grade gliomas, which often do not contrast-enhance on T1w-CE MRI, making surgery and RT target planning difficult. Thus, the addition of sMRI to RT dosage planning in low-grade glioma could result in a brand new, clinically important target ROI. Most importantly, the addition of sMRI to the surgical and RT management of gliomas would represent a paradigm shift in the field of image-guided therapy away from targeting surrogate markers using tracer-based imaging techniques (eg, contrast enhancement, standardized tracer uptake in PET) to targeting abnormal tissue regions by measuring endogenous biological processes.
Encouragingly, many of the technical pitfalls of sMRI implementation that have plagued its clinical implementation in the past have now been surmounted, and further development of more sophisticated sMRI analysis and integration pipelines appears promising. Although further standardization and automation of the clinical workflow is required, tracer-independent metabolic mapping with sMRI would provide accurate brain tumor metabolism information to neurosurgeons and radiation oncologists treating glioma patients. The clinical integration of sMRI into therapy planning and response assessment in glioma would represent a paradigm shift in the management of these patients, potentially giving physicians a new tool to improve survival with this debilitating disease beyond the current standard of care.
Supplementary Material
Funding
This work was supported by National Institutes of Health Research grants (U01CA172027 to H.G.S./H.S./J.J.O. and R21CA141836 to C.G.H./C.A.H./H.S.), a National Institutes of Health Ruth L. Kirschstein National Research Service Award (NRSA) Individual Predoctoral Fellowship (F31CA180319 to J.S.C.), and a research grant from Nx Development Corp. (to C.G.H.).
Supplementary Material
Acknowledgments
The EPSI (echo-planar spectroscopic imaging) sequence and MIDAS were provided by Andrew Maudsley at the University of Miami, and his group has been crucial in the technical components of pipeline optimization.
Conflict of interest statement. C.G.H. has received intellectual fees from Nx Development Corp. C.G.H. is also a consultant for Nx Development Corp.
References
- 1.Ostrom QT, Gittleman H, Liao P et al. CBTRUS statistical report: primary brain and central nervous system tumors diagnosed in the United States in 2007–2011. Neuro Oncol. 2014;16(suppl 4):iv1–iv63. [DOI] [PMC free article] [PubMed] [Google Scholar]
- 2.Stupp R, Hegi ME, Mason WP et al. Effects of radiotherapy with concomitant and adjuvant temozolomide versus radiotherapy alone on survival in glioblastoma in a randomised phase III study: 5-year analysis of the EORTC-NCIC trial. Lancet Oncol. 2009;10(5):459–466. [DOI] [PubMed] [Google Scholar]
- 3.Barajas RF Jr., Phillips JJ, Parvataneni R et al. Regional variation in histopathologic features of tumor specimens from treatment-naive glioblastoma correlates with anatomic and physiologic MR Imaging. Neuro Oncol. 2012;14(7):942–954. [DOI] [PMC free article] [PubMed] [Google Scholar]
- 4.Wen PY, Macdonald DR, Reardon DA et al. Updated response assessment criteria for high-grade gliomas: Response Assessment in Neuro-Oncology working group. J Clin Oncol. 2010;28(11):1963–1972. [DOI] [PubMed] [Google Scholar]
- 5.Kelly PJ, Daumas-Duport C, Kispert DB et al. Imaging-based stereotaxic serial biopsies in untreated intracranial glial neoplasms. J Neurosurg. 1987;66(6):865–874. [DOI] [PubMed] [Google Scholar]
- 6.Yamahara T, Numa Y, Oishi T et al. Morphological and flow cytometric analysis of cell infiltration in glioblastoma: a comparison of autopsy brain and neuroimaging. Brain Tumor Pathol. 2010;27(2):81–87. [DOI] [PubMed] [Google Scholar]
- 7.Toussaint LG 3rd, Nilson AE, Goble JM et al. Galectin-1, a gene preferentially expressed at the tumor margin, promotes glioblastoma cell invasion. Mol Cancer. 2012;11:32. [DOI] [PMC free article] [PubMed] [Google Scholar]
- 8.Sherriff J, Tamangani J, Senthil L et al. Patterns of relapse in glioblastoma multiforme following concomitant chemoradiotherapy with temozolomide. Br J Radiol. 2013;86(1022):20120414. [DOI] [PMC free article] [PubMed] [Google Scholar]
- 9.Waldman AD, Jackson A, Price SJ et al. Quantitative imaging biomarkers in neuro-oncology. Nat Rev Clin Oncol. 2009;6(8):445–454. [DOI] [PubMed] [Google Scholar]
- 10.Law M. MR spectroscopy of brain tumors. Top Magn Reson Imaging. 2004;15(5):291–313. [DOI] [PubMed] [Google Scholar]
- 11.Maudsley AA, Domenig C, Govind V et al. Mapping of brain metabolite distributions by volumetric proton MR spectroscopic imaging (MRSI). Magn Reson Med. 2009;61(3):548–559. [DOI] [PMC free article] [PubMed] [Google Scholar]
- 12.Stadlbauer A, Buchfelder M, Doelken MT et al. Magnetic resonance spectroscopic imaging for visualization of the infiltration zone of glioma. Cent Eur Neurosurg. 2011;72(2):63–69. [DOI] [PubMed] [Google Scholar]
- 13.Stadlbauer A, Nimsky C, Buslei R et al. Proton magnetic resonance spectroscopic imaging in the border zone of gliomas: correlation of metabolic and histological changes at low tumor infiltration—initial results. Invest Radiol. 2007;42(4):218–223. [DOI] [PubMed] [Google Scholar]
- 14.Di Costanzo A, Scarabino T, Trojsi F et al. Proton MR spectroscopy of cerebral gliomas at 3 T: spatial heterogeneity, and tumour grade and extent. Eur Radiol. 2008;18(8):1727–1735. [DOI] [PubMed] [Google Scholar]
- 15.Di Costanzo A, Scarabino T, Trojsi F et al. Multiparametric 3T MR approach to the assessment of cerebral gliomas: tumor extent and malignancy. Neuroradiology. 2006;48(9):622–631. [DOI] [PubMed] [Google Scholar]
- 16.Barbosa BJ, Mariano ED, Batista CM et al. Intraoperative assistive technologies and extent of resection in glioma surgery: a systematic review of prospective controlled studies. Neurosurg Rev. 2015;38(2):217–226. [DOI] [PubMed] [Google Scholar]
- 17.Hadjipanayis CG, Widhalm G, Stummer W. What is the surgical benefit of utilizing 5-aminolevulinic acid for fluorescence-guided surgery of malignant gliomas? Neurosurgery. 2015;77(5):663–673. [DOI] [PMC free article] [PubMed] [Google Scholar]
- 18.Cordova JS, Schreibmann E, Hadjipanayis CG et al. Quantitative tumor segmentation for evaluation of extent of glioblastoma resection to facilitate multisite clinical trials. Transl Oncol. 2014;7(1):40–47. [DOI] [PMC free article] [PubMed] [Google Scholar]
- 19.Maudsley AA, Darkazanli A, Alger JR et al. Comprehensive processing, display and analysis for in vivo MR spectroscopic imaging. NMR Biomed. 2006;19(4):492–503. [DOI] [PMC free article] [PubMed] [Google Scholar]
- 20.Kairdolf BA, Bouras A, Kaluzova M et al. Intraoperative spectroscopy with ultrahigh sensitivity for image-guided surgery of malignant brain tumors. Anal Chem. 2016;88(1):858–867. [DOI] [PMC free article] [PubMed] [Google Scholar]
- 21.de la Rocha AM, Sampron N, Alonso MM, Matheu A. Role of SOX family of transcription factors in central nervous system tumors. Am J Cancer Res. 2014;4(4):312–324. [PMC free article] [PubMed] [Google Scholar]
- 22.Ruifrok AC, Johnston DA. Quantification of histochemical staining by color deconvolution. Anal Quant Cytol Histol. 2001;23(4):291–299. [PubMed] [Google Scholar]
- 23.Go KG, Kamman RL, Mooyaart EL et al. Localised proton spectroscopy and spectroscopic imaging in cerebral gliomas, with comparison to positron emission tomography. Neuroradiology. 1995;37(3):198–206. [DOI] [PubMed] [Google Scholar]
- 24.Nelson SJ, Vigneron DB, Dillon WP. Serial evaluation of patients with brain tumors using volume MRI and 3D 1H MRSI. NMR Biomed. 1999;12(3):123–138. [DOI] [PubMed] [Google Scholar]
- 25.Guo J, Yao C, Chen H et al. The relationship between Cho/NAA and glioma metabolism: implementation for margin delineation of cerebral gliomas. Acta Neurochir (Wien). 2012;154(8):1361–1370; discussion 1370. [DOI] [PMC free article] [PubMed] [Google Scholar]
- 26.Cha S. Update on brain tumor imaging: from anatomy to physiology. AJNR Am J Neuroradiol. 2006;27(3):475–487. [PMC free article] [PubMed] [Google Scholar]
- 27.Young GS. Advanced MRI of adult brain tumors. Neurol Clin. 2007;25(4):947–973. viii. [DOI] [PubMed] [Google Scholar]
- 28.Pope WB, Young JR, Ellingson BM. Advances in MRI assessment of gliomas and response to anti-VEGF therapy. Curr Neurol Neurosci Rep. 2011;11(3):336–344. [DOI] [PMC free article] [PubMed] [Google Scholar]
- 29.Matsumura A, Isobe T, Anno I et al. Correlation between choline and MIB-1 index in human gliomas. A quantitative in proton MR spectroscopy study. J Clin Neurosci. 2005;12(4):416–420. [DOI] [PubMed] [Google Scholar]
- 30.Nafe R, Herminghaus S, Raab P et al. Preoperative proton-MR spectroscopy of gliomas—correlation with quantitative nuclear morphology in surgical specimen. J Neurooncol. 2003;63(3):233–245. [DOI] [PubMed] [Google Scholar]
- 31.Croteau D, Scarpace L, Hearshen D et al. Correlation between magnetic resonance spectroscopy imaging and image-guided biopsies: semiquantitative and qualitative histopathological analyses of patients with untreated glioma. Neurosurgery. 2001;49(4):823–829. [DOI] [PubMed] [Google Scholar]
Associated Data
This section collects any data citations, data availability statements, or supplementary materials included in this article.