

Healthcare-associated infections (HAIs) are a leading cause of morbidity and mortality in the U.S.,1 with an annual incidence estimated at two million cases,2 with up to 99,000 patients dying each year.1 These statistics make HAIs the fifth leading cause of death in acute-care hospitals.3,4 Infection prevention interventions to reduce the incidence of HAIs in hospitals, such as the central line bundle interventions to prevent central line-associated bloodstream infections (CLABSI),5 have been tested and resulted in improvements for individual organizations.6 Unfortunately, examples of sustained program success to reduce HAIs and other adverse events are rare.6–10 This has been attributed to the lack of attention to the organizational context in which these interventions are implemented.11,12 The aim of this study was to test for a relationship between adherence to the central line bundle interventions, organizational context, and CLABSI outcomes, and establish a method of how to study organizational context within infection prevention programs in acute-care hospitals.
PREVIOUS RESEARCH
The prevention of HAIs are a worldwide priority, as witnessed by the number of large-scale initiatives that are underway nationally,13,14 and globally.15,16 In the U.S., the Department of Health and Human Services has developed a National Action Plan to Prevent HAIs that targeted a 50% reduction in CLABSIs in intensive care units (ICUs) by 2013,13 and the elimination of all HAIs by the year 2020.17 These lofty goals have been set due to the existence of evidence-based practice interventions that, when consistently implemented >95% of the time,18 decrease HAI incidence. One of the most well known HAI prevention interventions is the central line bundle, originally tested by Pronovost et al.19 The central line bundle consists of a checklist of five individual interventions that, when performed together, have demonstrated a reduction in CLABSIs.10,19 The central line bundle includes (1) hand hygiene prior to line insertion, (2) the use of maximal barrier precautions for line insertion, (3) the use of chlorhexidine gluconate (CHG) for skin preparation, (4) the selection of an optimal catheter site, and (5) checking the central line daily for necessity.5
Organizational context has been defined as the environment in which healthcare is practiced, and includes the sub-concepts of organizational culture, climate, and the work environment.12 Context has been identified as an integral component in the successful implementation of patient safety programs. Due to a lack of measurement and reporting of contextual factors in research projects and publications, translation of successful interventions from one site to another is challenging.11,12 To facilitate the spread of successful patient safety strategies, researchers are encouraged to use theory-based frameworks to describe, evaluate, and empirically test the key contextual elements that positively influence patient safety interventions.12 Recent examples include studies that have investigated the role of organizational culture on a patient safety culture,20 long-term hospital performance,21 an improvement in processes (specifically hand washing frequency), and outcomes (vancomycin-resistant enterococci incidence),22 and nursing turnover.23 Studies that have evaluated the influence of the work environment on patient outcomes have reported that nurse staffing,24,25 nursing skill mix,26,27 nurse education levels,28 working conditions and level of burnout,24,28–30 along with employing intensivists in ICUs,31 and high levels of relational coordination,32 have been positively associated with patient outcomes in some studies. Lastly, the influence of a positive safety climate has been studied for its relationship to nurse and patient outcomes,33–36 but the findings are inconsistent at this time.
An improved understanding of the role contextual factors play in healthcare could identify the factors that help or hinder program implementation and improved patient outcomes, and allow for translation of findings across systems.11,12 To meet this end, a systems-level, theory driven research approach is needed, for implementing and sustaining complex patient safety interventions to decrease adverse events is a challenging process.12
THE CONCEPTUAL MODEL
The Quality Health Outcomes Model (QHOM) proposes relationships between the system or context, healthcare interventions, client characteristics, and patient outcomes.37 The model adapts the traditional structure-process-outcome framework of Donabedian, that suggests that interventions or treatments directly produce expected outcomes, as adjusted for client characteristics38 into a dynamic model that recognizes that feedback occurs among clients, the context in which the care is provided, and interventions.37 The QHOM is presented in Figure 1.
Figure 1. The Quality Health Outcomes Model (with permission).
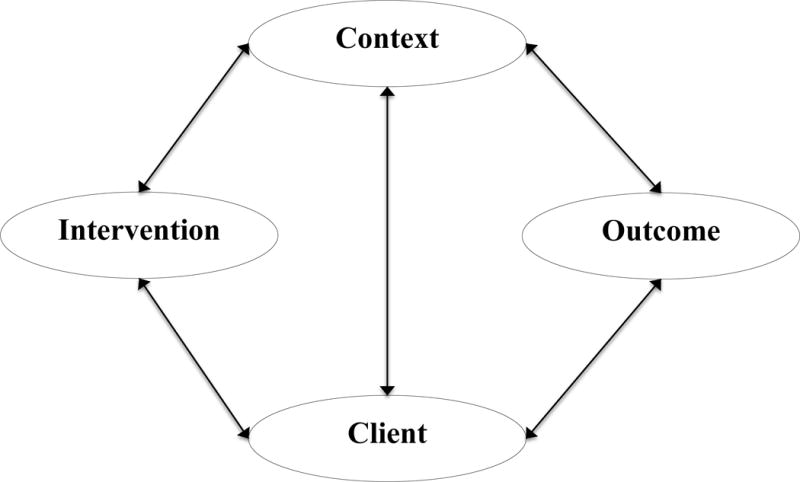
Mitchell PH, Ferketich S, Jennings BM. Quality health outcomes model. Image J Nurs Sch. 1998;30(1):43–46.
The QHOM was developed to encourage researchers to view the practice of healthcare as an active process that is impacted by both contextual and client factors.37 The relationships in the model are presented with bi-directional influence, suggesting that interventions impact and are impacted by both context and client characteristics in producing desired outcomes. In addition, the connection between context and client suggests that no single intervention acts directly through either context or client alone. In essence, the effect of an intervention is mediated by client or context characteristics, but is not thought to have an independent direct effect on outcomes.37 While the relationships proposed in the model are intuitively appealing, testing of the theory is necessary to empirically document the intervening mechanisms by which contextual and client factors influence interventions and outcomes.
The QHOM has been tested in the obstetrical and oncology setting to evaluate quality and system interventions to improve care,39–42 but has not been applied to the field of infection prevention. The significance of this study is that it addresses critical gaps in current HAI prevention research, for the study will add to the body of literature that is investigating how, why, and in what contextual setting patient safety programs improve patient outcomes.
SAMPLE
The sample for these analyses came from data collected as part of the Prevention of Nosocomial Infection and Cost-effectiveness-Refined (P-NICER) study (National Institutes of Health, RO1NR010107: Stone, P.). P-NICER was a three-year study that surveyed eligible National Health Safety Network (NHSN) hospitals.43 In 2011, an electronic survey was sent to participating hospital infection prevention departments with a request for a single Infection Preventionist (IP) to respond and provide data on adherence rates to the central line bundle interventions for their largest ICU, their perceptions of the climate and work environment in their unit, and permission to allow the researchers to access CLABSI outcomes for the largest ICU through the NHSN database.43
IPs were the target population due to their primary role as leaders in organizational programs to decrease HAIs, and owners of the process to monitor and report adherence to the central line bundle interventions and surveillance and reporting of CLABSI outcomes in ICUs. A total of 1,013 surveys were collected (response rate of 29% for overall survey).43 The P-NICER study was approved by the Columbia University Medical Center, New York University Medical Center, and RAND Corporation. The Colorado Multiple Institutional Review Board approved the secondary data analysis study.
This study included 614 hospitals from the P-NICER dataset that completed the items associated with the three constructs of interest in the QHOM conceptual model: calendar year 2011 rates of adherence to the central line bundle interventions, organizational context, and calendar year 2011 rates of CLABSI outcomes. Data pertaining to client characteristics were not available. Due to the large sample size, the dataset was randomly split to allow for the exploration of the measurement models in the first half (n=307) and confirmation in the second half (n=307). Table 1 provides demographic data for the respondents’ organizations. The level of analysis for this study was the organizational level.
Table 1.
Demographic Characteristics of Samples
| EFA (n=307) | CFA (n=307) | |||
|---|---|---|---|---|
|
|
||||
| Characteristics | Mean | SD | Mean | SD |
| Hospital Patient Days | 56,348 | 61,463 | 61,356 | 60,585 |
| # ICU beds | 30 | 37 | 39 | 48 |
|
|
||||
| Frequency | Percentage | Frequency | Percentage | |
|
|
||||
| Setting | ||||
| Urban | 67 | 22 | 96 | 31 |
| Suburban | 106 | 35 | 104 | 34 |
| Rural | 131 | 43 | 106 | 35 |
| Location | ||||
| Northeast | 61 | 20 | 65 | 21 |
| South | 102 | 33 | 102 | 33 |
| Midwest | 96 | 31 | 82 | 27 |
| West | 45 | 15 | 54 | 18 |
| Other (AK, PR, HI) | 3 | 1 | 4 | 1 |
| Bedsize | ||||
| <200 beds | 158 | 52 | 142 | 48 |
| 201–500 beds | 106 | 35 | 111 | 37 |
| 501–1,000 beds | 32 | 10 | 41 | 14 |
| >1,001 beds | 1 | 1 | 4 | 1 |
| ICU Type | ||||
| Medical/Surgical | 238 | 78 | 218 | 71 |
| Medical | 37 | 12 | 41 | 13 |
| Other | 32 | 10 | 48 | 16 |
Abbreviations: EFA, exploratory factor analysis; CFA, confirmatory factor analysis; SD, standard deviation
VARIABLES
Adherence to Central Line Bundle Interventions
Four evidence-based interventions that are performed at the time of central line insertion were selected from the P-NICER dataset to represent the central line bundle interventions. The variables included monitoring for hand hygiene, using maximal barrier precautions, using CHG to prepare the skin, and selecting the optimal catheter site. Respondents reported aggregated, monthly, unit-based compliance with these interventions on a six-point scale. Scores ranged from one to six, with one = all of the time (95–100%), two = usually (75–94%), three = sometimes (25–74%), four = rarely/never (<25%), five = we monitor, don’t know the proportion, and six = no monitoring. For this analysis, the results were collapsed to one = all of the time (95–100%), zero = all else, due to recent research that has reported that only when organizations have a policy in place and report >95% compliance with the interventions do CLABSIs decrease.18
Organizational Context
The measurement model for the organizational context variable was derived from survey items from two instruments, the Leading a Culture of Quality Instrument for Infection Prevention (LCQ-IP), and the Relational Coordination Survey (RCS). The LCQ-IP questionnaire was selected by the P-NICER team as the primary measure of organizational climate, and modified to make the content more specific to infection prevention (i.e. “quality” changed to “infection prevention”).44 The original LCQ was developed by a Minnesota health care collaborative and tested amongst managed care groups with the goal of improving clinical standards. The tool consists of 27 items organized into nine subscales: alignment (four items), quality focus (four items), change orientation (three items), change actions (two items), openness (three items), psychological safety (four items), accountability (two items), work group cooperation and respect (three items), and workload (two items). Responses are indicated on a Likert scale of one to five, where one corresponds to strongly agree, and five corresponds to strongly disagree or from one (never) to five (very often). Reverse coding for two items was necessary prior to analysis to maintain the integrity of the scoring responses.
The original 27-item LCQ instrument has undergone content and face validity, while the modified 27-item LCQ-IP that was used in the P-NICER survey has demonstrated internal consistency, with a Cronbach alpha (α) of .92, and criterion validity between the LCQ-IP and the number of evidence-based policies for the prevention of CLABSIs.44 Nine LCQ-IP items that represented individual level concepts, versus unit level concepts, as indicated by questions that started with “I” or were unique to the infection prevention department, were removed prior to analysis. Ultimately, 18 items from the LCQ-IP underwent validity testing and statistical analysis. Confirmation of the validity of the LCQ-IP as a measure of organizational climate in this sample was performed. A copy of the LCQ-IP can be requested from the P-NICER research team.45
The RCS used in the P-NICER study was a 28-item questionnaire adapted from the original instrument developed by Gittell et al.46 The survey questions were modified for the P-NICER study to query relational coordination between IPs and physicians (MDs), bedside nurses (RNs), environmental services, and hospital administration. This RCS asked responding IPs to rate the frequency, timeliness, accuracy, and problem-solving nature of communication with each professional group on a one to five scale (one indicating never and five indicating always). The next section asked, “when problems arise regarding infection control, does the professional group tend to blame others or work with infection control to solve the problem” (one indicating always blame and five indicating always solve). The final questions assessed how much the professional group knew about the role of infection control, how much they respect the role, and how much they share the departments goals (one indicating nothing and five indicating everything).47 For this study, the scoring structure was modified to improve variance in the response and be in alignment with the LCQ-IP scaling structure. The 1–5 scale items were collapsed to dichotomous results with the never/rarely/occasionally (1–3) responses recoded to a score of zero, the often/always (4–5) responses to a score of one.47 The RCS has previously demonstrated internal consistency, inter-rater agreement and reliability (α = 0.80), content and structural validity.48 Confirmation of the validity of the RCS as a measure of the work environment in this sample was performed. A copy of the RCS can be requested from the Relational Coordination Research Collaborative.49
CLABSI Outcomes
The outcome variable was validated CLABSI events reported through the NHSN system from adult ICU patients who had contracted a CLABSI during inpatient care in the calendar year 2011. A CLABSI event was defined, and a weighted mean was calculated, in accordance with NHSN guidelines.50 The variable was included in the model as a single measured item.
ANALYSIS
Latent variable modeling, within a structural equation modeling (SEM) framework was used to test the relationships proposed in the QHOM. The measurement models were developed from covariance matrices that were created in the statistical software program Mplus™ version 7.11, using raw data from the P-NICER dataset. The matrices are not included in this manuscript due to the large size of each matrix, but are available upon request. The individual instruments underwent descriptive analysis, including mean and standard deviation (SD), and psychometric analysis, including internal reliability using SPSS™, version 22. This was followed by exploratory factor analysis (EFA) conducted in the first-half of the randomly split dataset and the creation of measurement models for adherence to the central line bundle variable and organizational context variable. The factor structure of these variables was then confirmed using confirmatory factor analysis (CFA) methods in the second-half of the dataset. Finally, a structural model, presented in Figure 2 was created that included the confirmed measurement models for adherence to the central line bundle interventions and organizational context, and the single measured CLABSI outcome item.
Figure 2. The QHOM applied to Infection Prevention in Hospitals Conceptual Model.
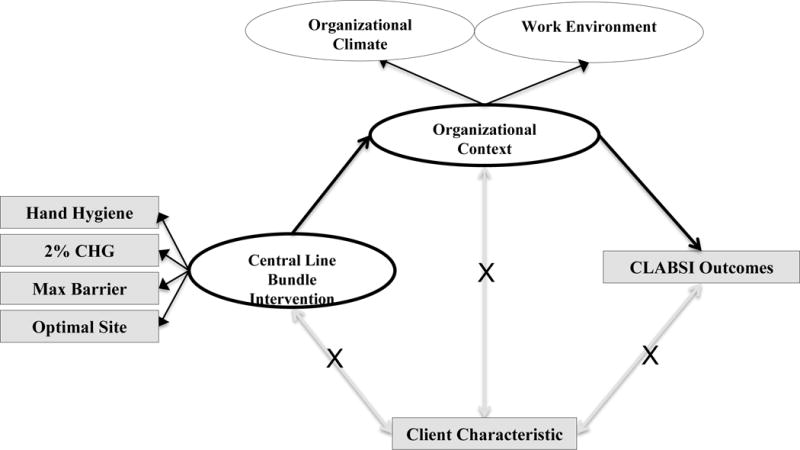
Abbreviations: CHG, chlorhexidine gluconate; Max Barrier, maximal sterile barrier precautions; CLABSI, central line-associated bloodstream infection.
To account for the categorical, non-normal data used to represent organizational context, the analyses were conducted using a robust weighted least mean square estimation estimator (WLSMV). The WLSMV estimator is appropriate for non-normal, categorical data if sample size is 200 or better.51 Based on an a priori power calculation to determine the sample size needed to detect difference between the models, this study minimally required 312 respondents.52,53 The sample of 614 was an adequate sample to allow for splitting of the dataset for exploration (n = 307) and confirmation (n = 307) of the measurement models.
The fit of the models was evaluated by assessing various statistics that assess the closeness of the model fit of the estimated population covariance matrix to the sample covariance matrix.51 The chi-square (x2) statistic was initially used to assess the magnitude of the discrepancy between the sample and the fitted covariance matrices. One of the challenges with the x2 statistic is that it is sensitive to large sample size, for a small discrepancy may lead to rejection of the model, even though the model fit the data well.51 Due to this, additional goodness of fit indices were used to assess the model fit, such as the comparative fit index (CFI) and the root mean square of error of approximation (RMSEA). (Table 2: Guideline for Goodness of Fit Indices)
Table 2.
Guideline for Goodness of Fit Indices1
| Fit Index | Range for fit | Description |
|---|---|---|
| CFI | 0 = poor fit to 1.00 = perfect fit < 0.90 = adequate fit |
Uses the non-central x2 distribution with non-centrality parameters |
| RMSEA | 0.05 or less = good fit 0.51 to .799 = adequate fit 0.80 to .10 = mediocre fit > 0.10 = poor fit |
Measure of discrepancy between the observed and model implied covariance matrices adjusted for degrees of freedom |
Abbreviation: x2, Chi-square; CFI, comparative fit index; RMSEA, root mean square of error of approximation
RESULTS
Adherence to Central Line Bundle Interventions
The means, standard deviations (SD), and the factor loadings from the EFA for the central line bundle model are presented in Table 3. Overall, respondents reported the highest compliance with CHG use at insertion (mean = .74, SD = .44), and the lowest compliance with optimal site selection (mean = .48, SD, .50). For the EFA, a principal component analysis (PCA) was conducted with orthogonal rotation (varimax). The Kaiser-Meyer-Olkin (KMO) measure verified the sampling adequacy for the analysis, KMO = .813.54 Bartlett’s test of sphericity x2 (6) 543.43, p < .000 indicated that correlations between items were sufficiently large for PCA.54 A single component had an eigenvalue over Kaiser’s criterion of one. This single component explained 70.54% of the variance. The scree plot demonstrated inflexion at one component number. The overall α for the instrument was .86, indicating that the measured items represented the dimension very well.55 The CFA measurement model fit statistics for the central line bundle model are presented in Table 4 (Central Line Bundle CFA). The model fit statistics suggested that the central line bundle measurement model was a good fit to the data (x2 (2) = 1.97, p <.374; CFI = .99; RMSEA = .00).
Table 3.
Central Line Bundle Model: Items, Means, Factor Loadings a (n=307)
| CL Bundle Interventions | Mean | SD | Factor Loading 1 |
|---|---|---|---|
| Hand hygiene at insertion | .62 | .487 | .877 |
| CHG use at insertion | .74 | .438 | .870 |
| Maximal barrier precautions | .64 | .480 | .878 |
| Optimal catheter site selection | .48 | .500 | .724 |
| Percentage of variance explained | 70.54% |
Abbreviation: SD, standard deviation
Extraction method: principal component analysis. Rotation method: varimax
Scoring Structure: 1 = all the time (>95%); zero = all else (<94% of the time)
Table 4.
Fit Statistics for the Measurement and Structural Models (n=307)
| X2 | DF | CFI | RMSEA | |
|---|---|---|---|---|
| Central Line Bundle CFA | 1.97* | 2 | .99 | .00 |
| Organizational Climate Model CFA & 2nd Order | 396.85** | 130 | .96 | .08 |
| Work Environment Model 2nd Order | 699.38** | 346 | .94 | .06 |
| Organizational Climate & Work Environment Correlated Model | 1593.33** | 979 | .95 | .04 |
| Organizational Context Model | 1,736.89** | 980 | .94 | .05 |
| QHOM for Infection Prevention in Hospitals | 1,906.86 ** | 1,215 | .94 | .04 |
Abbreviation: X2, Chi-square; DF, degrees of freedom; CFI, comparative fit index; RMSEA, root mean square of error of approximation
p.value >.05 – indicates good model fit
p.value <.05 – expected in large samples
Organizational Context
The process to create a single measurement model that represented organizational context required the exploration and confirmation of a model for organizational climate, represented by the items of the modified LCQ-IP, and the work environment, represented by the items of the RCS. The two models, once confirmed, were correlated and combined into a single, second-order model representing organizational context.
LCQ-IP Measurement Model
The means, SD, and factor loadings for the EFA on the modified LCQ-IP are presented in Table 5. Overall, respondents agreed that there was a positive organizational climate in their organization, as demonstrated by mean responses of 1 (strongly agree) and 2 (agree) for the survey items. The EFA was conducted using a PCA with orthogonal rotation (varimax). The KMO measure verified the sampling adequacy for the analysis, KMO = .93.54 Bartlett’s test of sphericity x2 (153)= 2,819.66, p < .000 indicated that correlations between items were sufficiently large for PCA.54 An initial analysis was run to obtain eigenvalues for each component in the data. Three components had eigenvalues over Kaiser’s criterion of one and in combination explained 60.46% of the variance. The scree plot demonstrated inflexion at three component numbers.
Table 5.
Leading a Culture of Quality Instrument: Items, Means and Factor Loadingsa (n=307)
| Factor Loadings
|
|||||
|---|---|---|---|---|---|
| Factor 1: Climate | Mean | SD | 1 | 2 | 3 |
| 1. Employees are encouraged to become involved in infection prevention | 1.84 | .739 | .745 | ||
| 2. Results of our infection prevention efforts are measured and communicated regularly to staff | 1.81 | .784 | .733 | ||
| 3. The HAI prevention goals and strategic plan of our organization are clear and well communicated | 1.84 | .747 | .716 | ||
| 4. There is a good information flow among departments to provide high quality patient safety and care | 2.10 | .802 | .689 | ||
| 5. People here feel a sense of urgency about preventing HAI | 2.35 | .882 | .667 | ||
| 6. Where I work, people are held accountable for the results of their work | 2.40 | 1.00 | .383 | ||
|
| |||||
| Factor 2. Leadership | |||||
|
| |||||
| 7. My organization’s senior leadership has focused the organization in the right direction | 1.92 | .820 | .724 | ||
| 8. My organization is making the changes necessary to compete effectively | 1.78 | .705 | .716 | ||
| 9. Most people in this organization are so busy that they have very little time to devote to infection prevention efforts b | 2.93 | .992 | .671 | ||
| 10. Senior leadership here has created an environment that enables changes to be made | 2.08 | .847 | .601 | ||
| 11. Senior management shows by its action that preventing HAI is a top priority in this organization | 1.90 | .838 | .503 | ||
|
| |||||
| Factor 3. Psychological Safety | |||||
|
| |||||
| 12. People in this organization are comfortable checking with each other if they have questions about the right way to do something | 1.99 | .616 | .777 | ||
| 13. Staff will freely speak up of they see something that may improve patient care or affect patient safety | 2.08 | .776 | .696 | ||
| 14. The climate in the organization promotes the free exchange of ideas | 2.06 | .781 | .651 | ||
| 15. Members of this organization are able to bring up problems and tough issues | 2.16 | .722 | .616 | ||
| 16. The people in this organization value others’ unique skills and talents | 2.10 | .665 | .606 | ||
| 17. In general, people in our organization treat each other with respect | 1.82 | .647 | .572 | ||
| 18. If you make a mistake in this organization, it tends to be held against you b | 2.37 | .829 | .352 | ||
|
| |||||
| Percentage of variance explained | 60.46 | ||||
Abbreviation: SD, standard deviation
Extraction method: principal component analysis. Rotation method: varimax
Reverse coded
Scaling Structure: 1=strongly agree, 2=agree, 3=neutral, 4=disagree, 5=strongly disagree
The modified LCQ-IP items that clustered on the same components suggested that component one represents climate, component two represents leadership, and component three represents psychological safety. The factor structure and conceptual grouping for the modified LCQ-IP used in this study were similar to the P-NICER LCQ-IP.44 The overall α for the modified LCQ-IP scale was .93, while the α for the climate variable was .84, the α for the leadership variable was .84, and the α for the psychological safety variable was .86, indicating that the measured items represented the dimensions well.55
The CFA measurement model fit statistics for the modified LCQ-IP organizational climate model are presented in Table 4 (Organizational Climate Model CFA & 2nd Order). Though the initial model resulted in adequate fit, post-hoc model modifications were performed in an attempt to develop a better fitting and more parsimonious model. Modification indices indicated that the model was significantly improved by the addition of correlations between error terms for the items “Results of our infection prevention efforts are measured and communicated regularly to staff “ and “There is good information flow among departments to provide high quality patient safety and care”. In addition, correlation of error terms for the item “My organization’s senior leadership has focused the organization in the right direction” and the item “My organization is making the changes necessary to compete effectively” improved model fit. This was theoretically appropriate for the items queried similar concepts. Though the final modelx2 was statistically significant, this was attributed to the large sample size. The CFI and RMSEA fit indices supported an adequate fit to the data (x2 (130) = 396.85, p <.00; CFI = .96; RMSEA = .08).
To create a measurement model from the CFA results, correlation terms were created between the three latent variables. Psychological safety was positively correlated (.77, p <.01) with climate and leadership (.85, p<.01), while, climate was positively correlated (.88, p<.01) with leadership. The three-factor model fit indices listed in Table 4 (Organizational Climate Model CFA & 2nd Order), and the significantly positive correlations between the latent constructs, permitted the construction of the concept as a second-order factor model as depicted in Figure 3. The second-order model resulted in an adequate fit to the data (x2 (130) = 396.85, p <.00; CFI = .96; RMSEA = .08), and was selected for testing as a sub-concept of organizational context.
Figure 3. Second Order Factor Model: Organizational Climate.
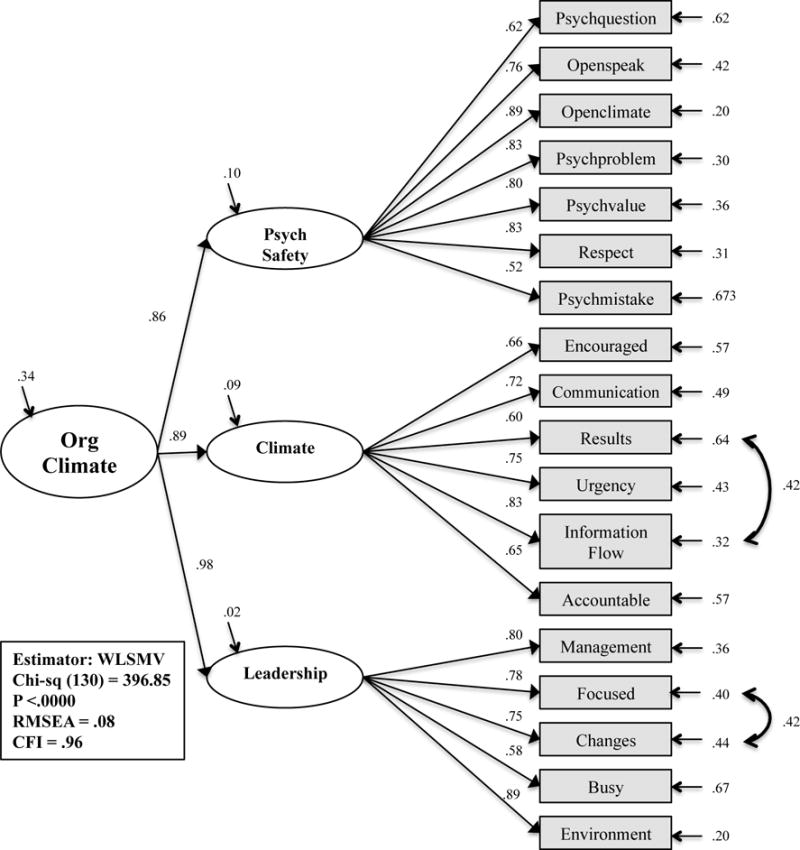
Abbreviations: Org Climate, organizational climate; Psych Safety, psychological safety; WLSMV, weighted least mean square estimation estimator; CFI, comparative fit index; RMSEA, root mean square of error of approximation
RCS Measurement Model
The RCS model representing the work environment underwent descriptive analysis, reliability and validity testing and resulted in a four-factor measurement model with latent variables labeled as healthcare administration, environmental services, physician (MD), and nurse (RN) relational coordination. The results of the exploration and confirmation of the measurement model have been reported elsewhere.47 Ultimately, the second-order work environment model, was adequately supported (x2 (346) = 699.38, p <.00; CFI = .94; RMSEA = .06), and was selected for testing as a sub-concept of organizational context (Figure 4).
Figure 4. Second-order Factor Model: Work Environment.
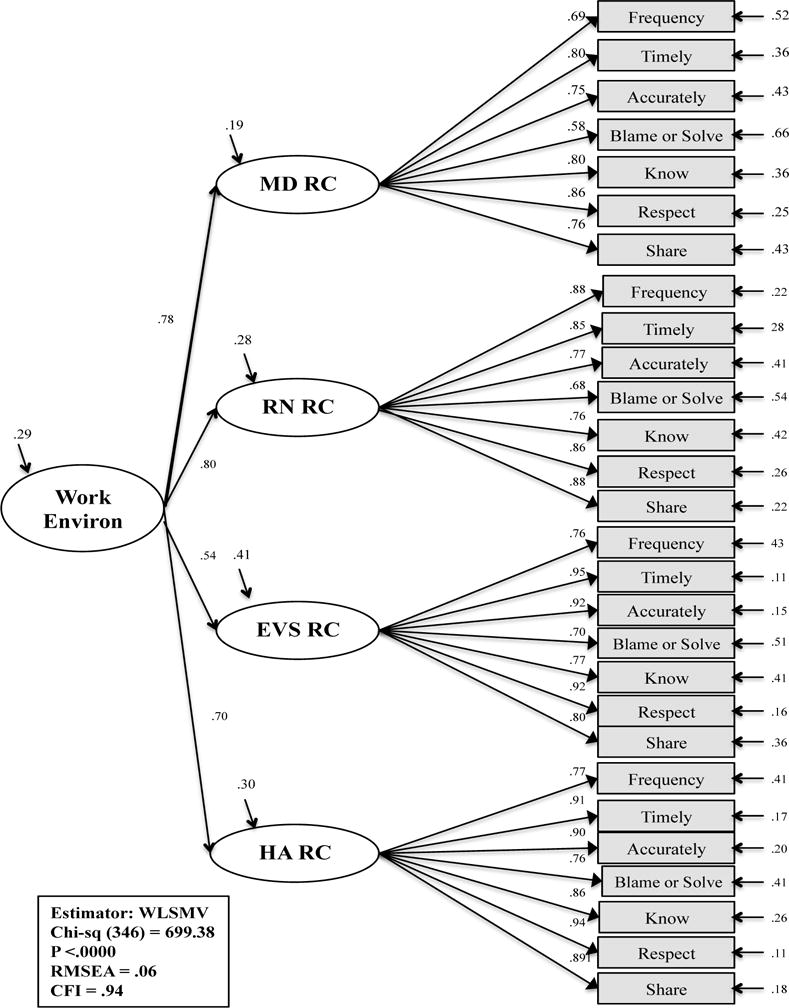
Abbreviations: Work Environ, work environment; MD, physician; RN, nurse; EVS, environmental services staff; HA, healthcare administration; RC, relational coordination; WLSMV, weighted least mean square estimation estimator; CFI, comparative fit index; RMSEA, root mean square of error of approximation
Organizational Context Model
The QHOM conceptual model suggested a relationship between the work environment and organizational climate. To confirm this, correlation paths were set between the two second-order models. The resulting model adequately fit the data (x2 (979) = 1,593.33, p <.00; CFI = .95; RMSEA = .04). The correlated second-order model is presented in Figure 5. A third-order, organizational context model was theoretically possible. The model was attempted by removing the path between the correlated second-order model of the work environment and organizational climate and placing organizational context as a third-order factor with paths to the work environment, organizational context, and their latent variables and measured items. The model could not be estimated though, for SEM requires at least three, second-order factors to be just identified.56
Figure 5. Correlated Second-order Model: Work Environment and Organizational Context.
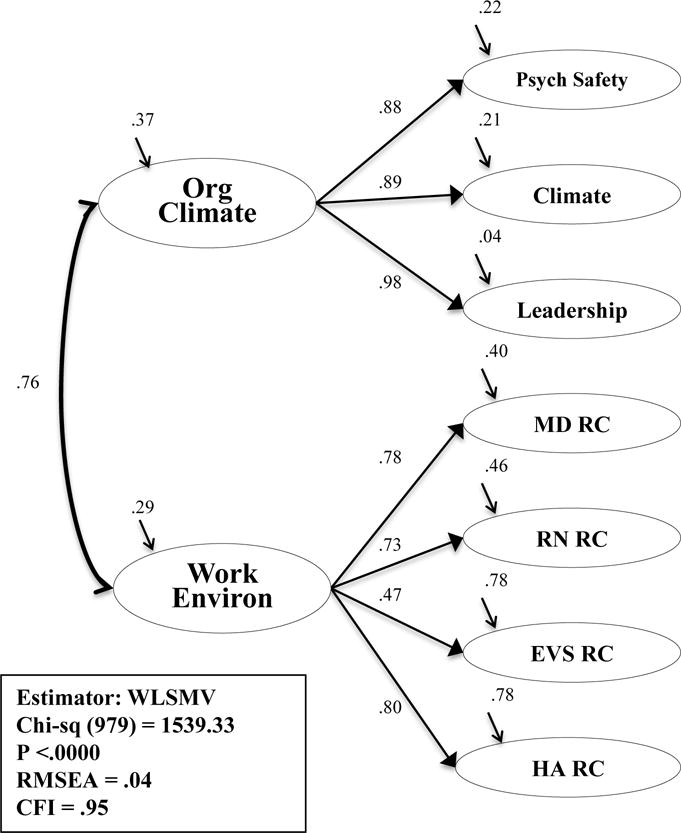
Abbreviations: Org Climate, organizational climate; Work Environ, work environment; MD, physician; RN, nurse; EVS, environmental services staff; HA, healthcare administration; RC, relational coordination; WLSMV, weighted least mean square estimation estimator; CFI, comparative fit index; RMSEA, root mean square of error of approximation
Due to this, organizational context was ultimately designed as a second-order model using the sub-concepts of psychological safety, climate, and leadership along with the concepts of MD, RN, environmental services, and healthcare administration relational coordination and their respective measured items. The model is presented in Figure 6. The measurement model fit indicated an adequate fit to the data (x2 (980) = 1,736.89, p <.00; CFI = .94; RMSEA = .05). This model was then entered into the structural model to estimate the relationships suggested in the QHOM.
Figure 6. Second-order Factor Model: Organizational Context.
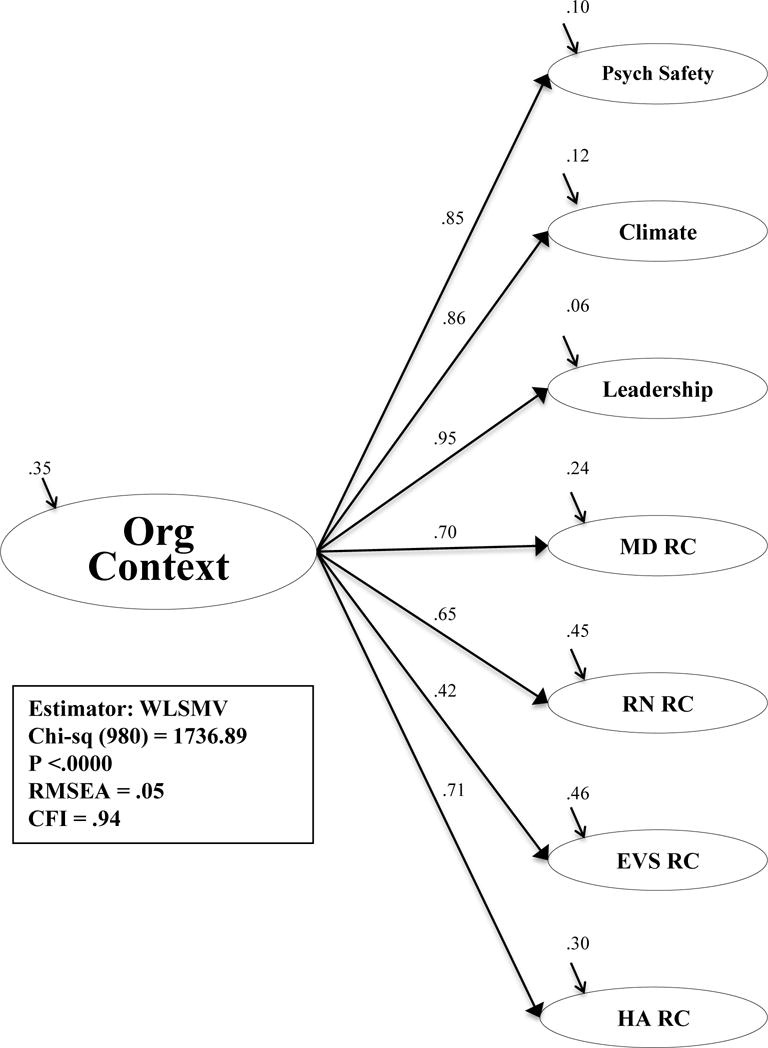
Abbreviations: Org Context, organizational context; Psych Safety, psychological safety; MD, physician; RN, nurse; EVS, environmental services staff; HA, healthcare administration; RC, relational coordination; WLSMV, weighted least mean square estimation estimator; CFI, comparative fit index; RMSEA, root mean square of error of approximation
CLABSI Measured Item
The CLABSI outcome measure ranged from zero to 17 infections (mean = 1.8, [SD 2.5]), one to 11,546 central line days (mean=1,740 [SD 1,630]) and an average weighted mean of .97 (range: 0–18 [SD 1.5]). Two hundred and fifty-five of the 614 hospitals in the dataset (41.5%) reported zero infections in 2011.
QHOM for Infection Prevention in Hospitals Structural Model
The conceptual model guiding this study proposed that organizational context would demonstrate an indirect effect on adherence to the central line bundle interventions and CLABSI outcomes (Figure 2). A structural model was developed to test for a relationship between the central line bundle variable to organizational context and from organizational context to CLABSI outcomes. The resulting model, depicted in Figure 7, was noted to have a good fit (x2 (1,215) = 1,906.86, p <.00; CFI = .94; RMSEA = .04). There was a positive, statistically significant direct effect (β = .23, p <.01) between the adherence to the central line bundle model and organizational context, such that when adherence to the central line bundle was higher, perceived organizational context was higher. The R2, or residual variance, for organizational context equaled 0.31, which suggested that adherence to the central line bundle explained 31% of the variance in organizational context. The relationship between organizational context and CLABSI outcomes was statistically not significant (β = −.20, p = .78).
Figure 7. The Quality Health Outcomes Model for Infection Prevention in Hospitals.
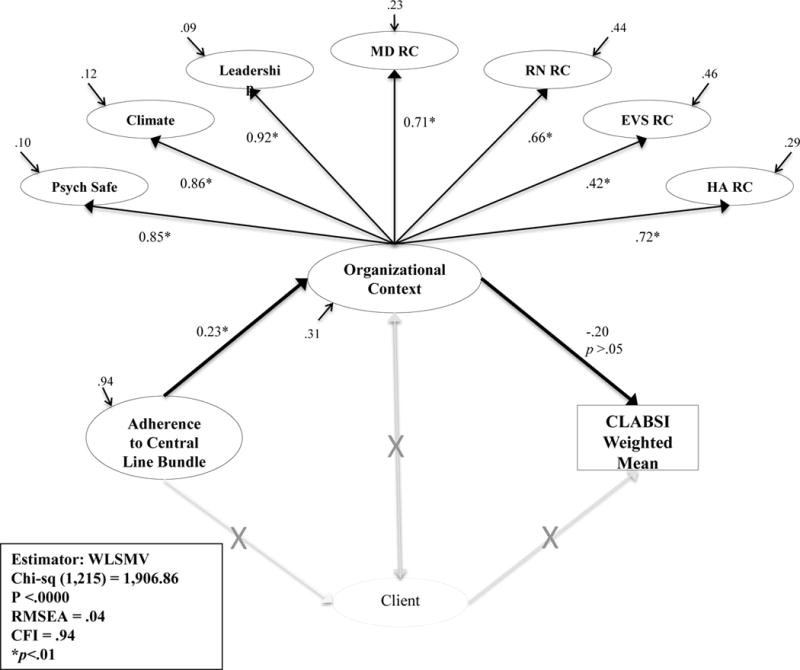
Abbreviations: CLABSI, central line-associated bloodstream infection; Psych Safety, psychological safety; MD, physician; RN, nurse; EVS, environmental services staff; HA, healthcare administration; RC, relational coordination; WLSMV, weighted least mean square estimation estimator; CFI, comparative fit index; RMSEA, root mean square of error of approximation
DISCUSSION
Using data from a large national survey that queried adherence rates to the central line bundle interventions, perception of organizational context, and CLABSI outcomes for adult ICU patients, a latent variable model within an SEM framework was examined to empirically test the proposed relationships within the QHOM. The final model, as shown in Figure 7, yielded partial support for the QHOM. The model demonstrated that high levels of adherence to the central line bundle interventions had a relationship with high levels of organizational context. The relationship between organizational context and CLABSI outcomes was not supported. Due to this, the theory that organizational context had an indirect effect on adherence to the central line bundle and CLABSI outcomes was not supported in this dataset. Additional study findings included confirmation of the construct validity of the RCI and LCQ-IP representing concepts of the work environment and organizational climate, respectively. Educators and quality management staff should use these two instruments to assess the context in their organizations prior to the role out of new patient safety programs.
The study findings add to the knowledge base regarding how context impacts patient safety programs, for a relationship was revealed between higher levels of adherence to CLABSI interventions and higher perceived organizational context. The lack of a statistically significant relationship between organizational context and CLABSIs, and the lack of an indirect effect between the central line bundle interventions, organizational context, and CLABSIs is possibly due to the low rates of CLABSI in this population. Future steps for this program of research include the opportunity to test the QHOM using diverse, objectively collected patient safety measures that have a greater incidence of adverse outcomes.
LIMITATIONS
The original P-NICER study was a cross-sectional survey of self-reported data with a 29% response rate. Though this is considered a moderate response rate, the availability of complete data from 614 hospitals that were deemed representative of U.S. hospitals balanced the reported response rate. The dataset did not include client characteristic variables, which may have confounded the confirmation of the model, for the QHOM suggests that interventions and outcomes are impacted by context and client characteristics. Additional limitations included the selection of intervention and outcome data from a single ICU to represent an organization and the use of a non-risk adjusted weighted mean as the outcome variable.
CONCLUSIONS
The prevention of HAIs is a complex topic of research. Organizational context is believed to be a key factor in the success or failure of HAI initiatives. This study suggests that you have to understand the context to influence practice. The QHOM, as a middle range theory, provides a framework to select variables that can be used to evaluate and compare health care quality initiatives. The inclusion of context, client, intervention, and outcome concepts will expand our understanding of the complex and dynamic influences that impact patient care. Though the study only partially confirmed the relationships proposed in the QHOM, we are able to offer that the context of an organization has a relationship with high levels of adherence to the central line bundle interventions. In the future, we encourage the assessment and description of organizational context, through instruments such as the LCQ-IP and the RCS, as part of HAI prevention programs.
The findings of this study are important for quality management professionals for they support the recommendation that organizational context be measured, using psychometrically valid instruments, in HAI prevention studies to determine the role of context in the success or failure of patient safety programs.12 The contextual information may help determine if an organization is able to foster high levels of adherence to prevention interventions, or if components of the climate and work environment need to be altered. In addition, replication of this work using other commonly used and validated instruments would allow consumers of research to evaluate whether published results are applicable to their own settings.12
Acknowledgments
The authors would like to thank Dr. Pat Stone for use of the P-NICER data for secondary analysis, and the Infection Preventionists who responded to the survey.
Funding: Funding for the P-NICER study was provided by the National Institute of Nursing Research (R01NR010107).
Footnotes
Conflict of Interest Statement: The authors declare no conflict of interest.
Disclaimer: The contents of this manuscript do not represent the views of the Department of Veterans Affairs or the United States Government.
Contributor Information
Heather M. Gilmartin, Email: Heather.gilmartin@ucdenver.edu, Post-doctoral Nurse Fellow, Denver/Seattle Center of Innovation, Department of Veterans Affairs, Eastern Colorado Healthcare System, Denver, CO 80220.
Karen H. Sousa, Email: Karen.sousa@ucdenver.edu, Professor, University of Colorado, College of Nursing, Aurora, CO.
References
- 1.Klevens RM, Edwards JR, Richards CL, et al. Estimating healthcare-associated infections and deaths in US hospitals, 2002. Public Health Reports. 2002;122:160–166. doi: 10.1177/003335490712200205. [DOI] [PMC free article] [PubMed] [Google Scholar]
- 2.Scott RD. The direct medical costs of healthcare-associated infections in US hospitals and the benefits of prevention. Atlanta, GA: Centers for Disease Control and Prevention; 2009. [Google Scholar]
- 3.Stone P, Braccia D, Larson E. Systematic review of economic analyses of health care-associated infections. American Journal of Infection Control. 2005;33(9):501–509. doi: 10.1016/j.ajic.2005.04.246. [DOI] [PubMed] [Google Scholar]
- 4.Septimus E, Yokoe DS, Weinstein RA, Perl TM, Maragakis LL, Berenholtz SM. Maintaining the momentum of change: The role of the 2014 updates to the Compendium in Preventing Healthcare-Associated Infections. Infection Control and Hospital Epidemiology. 2014;35:460–463. doi: 10.1086/675820. [DOI] [PubMed] [Google Scholar]
- 5.Marschall J, Mermel LA, Fakih M, et al. Strategies to prevent central line–associated bloodstream infections in acute care hospitals: 2014 update. Infection Control and Hospital Epidemiology. 2014;35(7):753–771. doi: 10.1086/676533. [DOI] [PubMed] [Google Scholar]
- 6.Pronovost PJ, Marsteller JA, Goeschel CA. Preventing bloodstream infections: A measurable national success story in quality improvement. Health Affairs. 2011;30(4):628–634. doi: 10.1377/hlthaff.2011.0047. [DOI] [PubMed] [Google Scholar]
- 7.Altman DE, Clancy C, Blendon RJ. Improving patient safety: Five years after the IOM report. New England Journal of Medicine. 2004;351(20):2041–2043. doi: 10.1056/NEJMp048243. [DOI] [PubMed] [Google Scholar]
- 8.Shortell SM, Singer SJ. Improving patient safety by taking systems seriously. Journal of the American Medical Association. 2008;299(4):445–447. doi: 10.1001/jama.299.4.445. [DOI] [PubMed] [Google Scholar]
- 9.Ladden MD. Ten years after keeping patients safe: Have nurses’ work environments been transformed? Robert Wood Johnson Foundation; 2014. [Google Scholar]
- 10.Pronovost PJ, Watson SR, Goeschel CA, Hyzy RC, Berenholtz SM. Sustaining reductions in central line-associated bloodstream infections in Michigan intensive care units: A 10 year analysis. Am J Med Qual. 2015:1–6. doi: 10.1177/1062860614568647. [DOI] [PubMed] [Google Scholar]
- 11.Lamont T, Waring J. Safety lessons: Shifting paradigms and directions for patient safety research. J Health Serv Res Policy. 2015;20(IS):1–8. doi: 10.1177/1355819614558340. [DOI] [PubMed] [Google Scholar]
- 12.Shekelle PG, Pronovost PJ, Wachter RM, et al. Assessing the evidence for context-sensitive effectiveness and safety of patient safety practices: Developing criteria. Rockville, MD: Agency for Healthcare Research and Quality; 2010. (Prepared under Contract No. HHSA-290-2009-10001C). [Google Scholar]
- 13.National action plan to prevent healthcare-associated infections: Roadmap to elimination – health care-associated infections. Washington, D.C: U.S. Department of Health and Human Services; 2009. [DOI] [PubMed] [Google Scholar]
- 14.Jeeva RR, Wright D. Healthcare–associated Infections: A national patient safety problem and the coordinated response. Medical Care. 2014;52:S4–S8. doi: 10.1097/MLR.0b013e3182a54581. [DOI] [PubMed] [Google Scholar]
- 15.WHO Global Infection Prevention and Control Network (GIPC Network) Launch. 2015 http://www.who.int/csr/bioriskreduction/infection_control/GIPC_Network/en/. Accessed April 27, 2015.
- 16.International Nosocomial Infection Control Consortium. 2013 http://www.inicc.org/english/index.php. Accessed April 27, 2015.
- 17.HHS. Healthy People 2020. 2010 http://www.healthypeople.gov/2020/topicsobjectives2020/overview.aspx?topicid=17. Accessed April 6, 2014.
- 18.Furuya EY, Dick A, Perencevich EN, Pogorzelska M, Goldmann D, Stone P. Central line bundle implementation in US intensive care units and impact on bloodstream infections. PLoS ONE. 2011;6(1):1–6. doi: 10.1371/journal.pone.0015452. [DOI] [PMC free article] [PubMed] [Google Scholar]
- 19.Pronovost P, Needham D, Berenholtz S, et al. An intervention to decrease catheter-related bloodstream infections in the ICU. New England Journal of Medicine. 2006;355:2725–2732. doi: 10.1056/NEJMoa061115. [DOI] [PubMed] [Google Scholar]
- 20.Singer S, Falwell A, Gaba DM, et al. Identifying organizational cultures that promote patient safety. Health Care Manage Rev. 2009;34(4):300–311. doi: 10.1097/HMR.0b013e3181afc10c. [DOI] [PubMed] [Google Scholar]
- 21.Jacobs R, Mannion R, Davies HT, Harrison S, Konteh F, Walshe K. The relationship between organizational culture and performance in acute hospitals. Soc Sci Med. 2013;76(1):115–125. doi: 10.1016/j.socscimed.2012.10.014. [DOI] [PubMed] [Google Scholar]
- 22.Larson EL, Early E, Cloonan P, Sugrue S, Parides M. An organizational climate intervention associated with increased handwashing and decreased nosocomial infections. Behavioral Medicine. 2000;26(1):14–22. doi: 10.1080/08964280009595749. [DOI] [PubMed] [Google Scholar]
- 23.Banaszak-Holl J, Castle NG, Lin MK, Shrivastwa N, Spreitzer G. The role of organizational culture in retaining nursing workforce. The Gerontologist. 2013:1–11. doi: 10.1093/geront/gnt129. [DOI] [PMC free article] [PubMed] [Google Scholar]
- 24.Aiken LH, Clarke SP, Silber JH, Sloane D. Hospital nurse staffing, and patient mortality, nurse burnout, and job satisfaction. Journal of the American Medical Association. 2002;288:1987–1993. doi: 10.1001/jama.288.16.1987. [DOI] [PubMed] [Google Scholar]
- 25.Needleman J, Buerhaus P, Mattke S, Stewart M, Zelevinsky K. Nurse-staffing levels and the quality of care in hospitals. New England Journal of Medicine. 2002;346(22):1715–1722. doi: 10.1056/NEJMsa012247. [DOI] [PubMed] [Google Scholar]
- 26.Blegen MQ, Goode CJ, Reed L. Nurse staffing and patient outcomes. Nurs Res. 1998;47(1):43–50. doi: 10.1097/00006199-199801000-00008. [DOI] [PubMed] [Google Scholar]
- 27.Mark B, Salyer J, Wan T. Market, hospital, and unit characteristics as predictors of nursing unit skill mix: A contextual analysis. Journal of Nursing Administration. 2000;30(11):552–560. doi: 10.1097/00005110-200011000-00011. [DOI] [PubMed] [Google Scholar]
- 28.Aiken LH, Cimiotti JP, Sloane DM, Smith HL, Flynn L, Neff DF. Effects of nurse staffing and nurse education on patient deaths in hospitals with different nurse work environments. Journal of Nursing Administration. 2012;42(10 Suppl):S10–16. doi: 10.1097/01.NNA.0000420390.87789.67. [DOI] [PMC free article] [PubMed] [Google Scholar]
- 29.Kutney-Lee A, Wu ES, Sloane DM, Aiken LH. Changes in hospital nurse work environments and nurse job outcomes: An analysis of panel data. International Journal of Nursing Studies. 2013;50(2):195–201. doi: 10.1016/j.ijnurstu.2012.07.014. [DOI] [PMC free article] [PubMed] [Google Scholar]
- 30.Kirwan M, Matthews A, Scott PA. The impact of the work environment of nurses on patient safety outcomes: A multi-level modeling approach. International Journal of Nursing Studies. 2013;50(2):253–263. doi: 10.1016/j.ijnurstu.2012.08.020. [DOI] [PubMed] [Google Scholar]
- 31.Wachter RM, Pronovost P. The 100,000 Lives Campaign: A scientific and policy review. Joint Commission Journal on Quality & Patient Safety. 2006;32(11):621–627. doi: 10.1016/s1553-7250(06)32080-6. [DOI] [PubMed] [Google Scholar]
- 32.Havens DS, Vasey J, Gittel JH, Lin W. Relational coordination among nurses and other providers: Impact on the quality of care. J Nurs Manag. 2010;18:926–937. doi: 10.1111/j.1365-2834.2010.01138.x. [DOI] [PubMed] [Google Scholar]
- 33.Hofmann D, Mark B. An investigation of the relationship between safety climate and medication errors as well as other nurse and patient outcomes. Personal Psychology. 2006;59(4):847–869. [Google Scholar]
- 34.Mardon RE, Khanna K, Sorra J, Dyer N, Famolaro T. Exploring relationships between hospital patient safety culture and adverse events. J Patient Saf. 2010;6:226–232. doi: 10.1097/PTS.0b013e3181fd1a00. [DOI] [PubMed] [Google Scholar]
- 35.Rosen AK, Singer S, Shibei Z, Shokeen P, Meterko M, Gaba D. Hospital safety climate and safety outcomes: Is there a relationship in the VA? Med Care Res Rev. 2010;67(5):590–608. doi: 10.1177/1077558709356703. [DOI] [PubMed] [Google Scholar]
- 36.Singer S, Lin S, Falwell A, Gaba D, Baker L. Relationship of safety climate and safety performance in hospitals. Health Serv Res. 2009;44(2P1):399–421. doi: 10.1111/j.1475-6773.2008.00918.x. [DOI] [PMC free article] [PubMed] [Google Scholar]
- 37.Mitchell PH, Ferketich S, Jennings BM. Quality health outcomes model. Image J Nurs Sch. 1998;30(1):43–46. doi: 10.1111/j.1547-5069.1998.tb01234.x. [DOI] [PubMed] [Google Scholar]
- 38.Wilson IB, Cleary PD. Linking clinical variables with health-related quality of life: A conceptual model of patient outcomes. Journal of the American Medical Association. 1995;273(1):59–65. [PubMed] [Google Scholar]
- 39.Mayberry LJ, Gennaro S. A quality of health outcomes model for guiding obstetrical practice. Image J Nurs Sch. 2001;33(2):141–146. doi: 10.1111/j.1547-5069.2001.00141.x. [DOI] [PubMed] [Google Scholar]
- 40.Brewer BB, Verran J, Stichler JF. The Systems Research Organizing Model: A conceptual perspective for facilities design. Herd. 2008;1(4):7–19. doi: 10.1177/193758670800100402. [DOI] [PubMed] [Google Scholar]
- 41.Mitchell PH, Lang NM. Framing the problem of measuring and improving healthcare quality. Has the quality health outcomes model been useful? Medical Care. 2004;42(2S):II4–II11. doi: 10.1097/01.mlr.0000109122.92479.fe. [DOI] [PubMed] [Google Scholar]
- 42.Radwin L. Oncology patients’ perceptions of quality nursing care. Res Nurs Health. 2000;23:179–190. doi: 10.1002/1098-240x(200006)23:3<179::aid-nur2>3.0.co;2-t. [DOI] [PubMed] [Google Scholar]
- 43.Stone P, Pogorzelska-Maziarz M, Herzig CT, et al. State of infection prevention in US hospitals enrolled in the National Health and Safety Network. American Journal of Infection Control. 2014;42:94–99. doi: 10.1016/j.ajic.2013.10.003. [DOI] [PMC free article] [PubMed] [Google Scholar]
- 44.Pogorzelska-Maziarz M, Nembhard IM, Schnall R, Nelson S, Stone P. Psychometric evaluation of an instrument for measuring organizational climate for quality: Evidence from a national sample of infection preventionists. Am J Med Qual. 2015:1–7. doi: 10.1177/1062860615587322. [DOI] [PMC free article] [PubMed] [Google Scholar]
- 45.Stone P. The P-NICER Study. 2016 http://www.cumc.columbia.edu/studies/pnice/. Accessed May 25, 2016.
- 46.Gittell JH, Fairfield KM, Bierbaum B, et al. Impact of relational coordination on quality of care, postoperative pain and functioning, and length of stay. Medical Care. 2000;38(8):807–819. doi: 10.1097/00005650-200008000-00005. [DOI] [PubMed] [Google Scholar]
- 47.Gilmartin H, Pogorzelska-Maziarz M, Thompson S, Sousa KH. Confirmation of the validity of the Relational Coordination Survey as a measure of the work environment in a national sample of infection preventionists. J Nurs Meas. 2015;23(3):379–392. doi: 10.1891/1061-3749.23.3.379. [DOI] [PMC free article] [PubMed] [Google Scholar]
- 48.Gittell JH. Coordinating mechanisms in care provider groups: Relational coordination as a mediator and input uncertainty as a moderator of performance effects. Management Science. 2002;48(11):1408–1426. [Google Scholar]
- 49.Gittell JH. Relational Coordination Research Collaborative. 2016 http://rcrc.brandeis.edu/. Accessed May, 25, 2016.
- 50.CDC. Bloodstream infection event (central line-associated bloodstream infection and non-central line-associated bloodstream infection) Device Associated Module BSI. Atlanta, GA: Centers for Disease Control and Prevention; 2016. pp. 1–32. [Google Scholar]
- 51.Ullman JB. Structural Equation Modeling. In: Tabachnick BGF, L S, editors. Using multivariate statistics. 5. New York: Pearson; 2007. pp. 676–780. [Google Scholar]
- 52.Computing power and minimum sample size for RMSEA [computer program] 2006 [Google Scholar]
- 53.MacCallum RC, Browne MW, Cai L. Testing differences between nested covariance structure models: Power analysis and null hypothesis. Psychological Methods. 2006;11(1):19–35. doi: 10.1037/1082-989X.11.1.19. [DOI] [PubMed] [Google Scholar]
- 54.Field A. Discovering Statistics Using SPSS. 3rd. Los Angeles: Sage; 2009. [Google Scholar]
- 55.Tabachnick BG, Fidell LS. Using multivariate statistics. 5th. Boston: Pearson; 2007. [Google Scholar]
- 56.Raykov T, Marcoulides GA. A first course in structural equation modeling. 2nd. New Jersey: Lawrence Erlbaum Associates; 2006. [Google Scholar]