Abstract
It has been shown that Neanderthals contributed genetically to modern humans outside Africa 47,000–65,000 years ago. Here, we analyze the genomes of a Neanderthal and a Denisovan from the Altai Mountains in Siberia together with the sequences of chromosome 21 of two Neanderthals from Spain and Croatia. We find that a population that diverged early from other modern humans in Africa contributed genetically to the ancestors of Neanderthals from the Altai Mountains roughly 100,000 years ago. By contrast, we do not detect such a genetic contribution in the Denisovan or the two European Neanderthals. We conclude that in addition to later interbreeding events, the ancestors of Neanderthals from the Altai Mountains and of modern humans met and interbred, possibly in the Near East, many thousands of years earlier than previously reported.
Introduction
Based on the fossil record, Neanderthals diverged from modern humans at least 430,000 years ago1, and the analysis of a Neanderthal genome from a cave in the Altai Mountains in Siberia suggests they diverged 550,000–765,000 years ago2. The analysis of a Denisovan genome from the same cave in the Altai Mountains further suggests that Neanderthals and Denisovans diverged 381,000–473,000 years ago2. This divergence was followed by admixture among archaic and modern human populations, including gene flow from Neanderthals into modern humans outside of Africa2–5, Denisovan gene flow into the ancestors of present-day humans in Oceania and mainland Asia6,7, gene flow into the Denisovans from Neanderthals2 and, possibly, gene flow into the Denisovans from an unknown archaic group that diverged from the other lineages more than one million years ago2. Genetic evidence of gene flow from modern humans into Neanderthals or Denisovans, however, remains elusive.
Divergence and heterozygosity in the archaic genomes
The Altai Neanderthal genome shares 5.4% more derived alleles with present-day Africans than does the Denisovan genome. This excess is particularly pronounced for derived alleles found at >0.9 frequency in Africans (Extended Data Table 1). These observations have been interpreted as evidence of gene flow from an unknown and more deeply diverged archaic hominin into the Denisovan lineage2. Here, we examine whether gene flow from modern humans into the ancestors of the Altai Neanderthal may also have occurred.
Noting that regions in the Denisovan genome introgressed from a deeply divergent archaic hominin should have unusually high divergence to present-day Africans, and that regions of the Altai Neanderthal genome introgressed from modern humans should have unusually low divergence to them, we examined the divergence of these archaic genomes to 504 African genomes8 in 15,881 sequence windows of 100 Kb (Supplementary Information section 9). Archaic alleles brought into Africa by Eurasians about 3,000 years ago9,10 were excluded from these windows by using only derived alleles at >0.9 frequency in the combined African genomes. In the absence of information about the phase of the alleles in the two archaic genomes, we calculated their divergence to Africans using the archaic alleles in each window that give the minimum number of differences, to allow introgressed segments from modern humans to be more easily identified, if they exist. Noting also that introgressed regions in the Denisovan or Altai Neanderthal genome should have unusually high divergence to the other archaic genome, we calculated the divergence between the archaic genomes in the same windows by using the alleles that give the maximum number of differences.
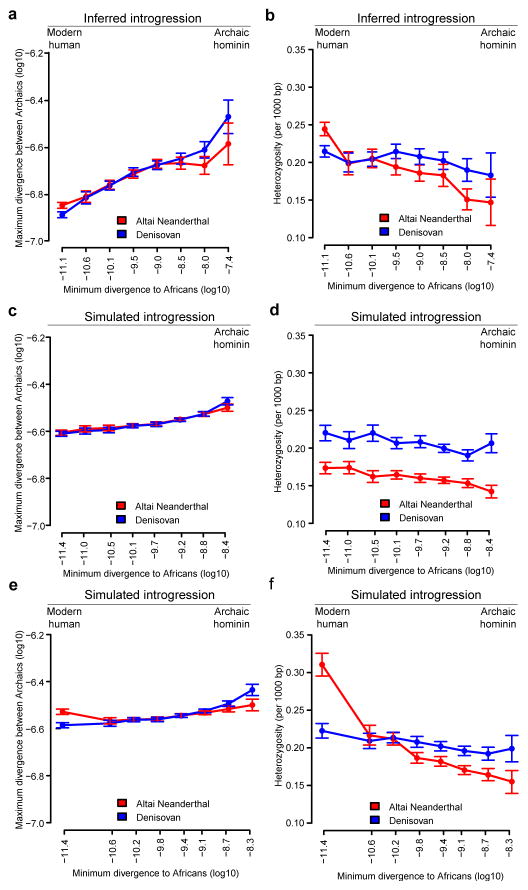
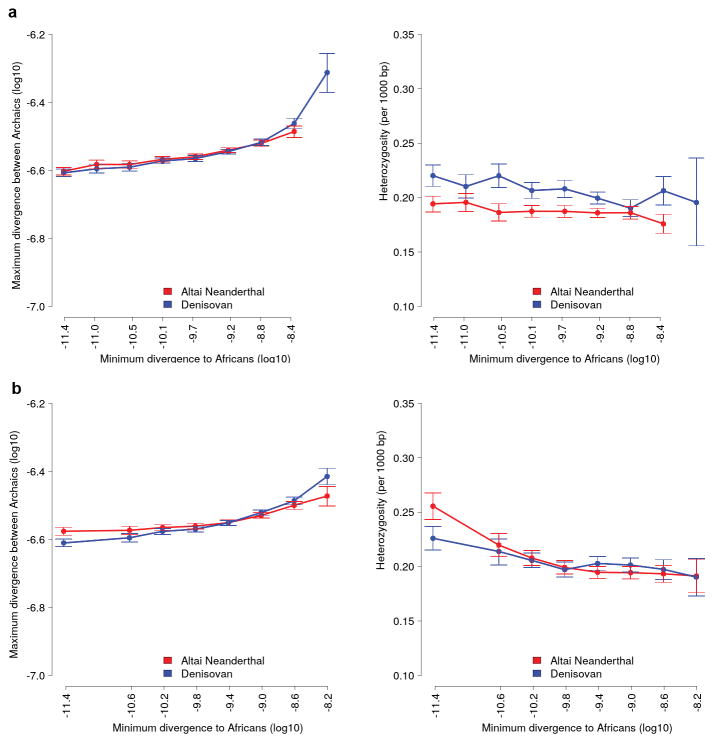
We find that windows of the Denisovan genome with high divergence to Africans also have a high divergence to the Altai Neanderthal whereas windows in the Altai Neanderthal genome with high divergence to Africans do not tend to have a high divergence to the Denisovan (Fig. 1a), consistent with gene flow from a deeply diverged hominin into the Denisovan ancestors. On the other hand, we find that windows of the Altai Neanderthal genome with low divergence to Africans have higher divergence to the Denisovan than Denisovan windows with low divergence to Africans (Fig. 1a). These windows in the Altai Neanderthal genome have higher heterozygosity than in the Denisovan genome (Fig. 1b), and 40.7% of their heterozygous sites share a derived allele with Africans while 24.2% do so in the Denisovan. These observations raise the possibility of gene flow from modern humans into Neanderthals.
Figure 1. Divergence and heterozygosity in the Altai Neanderthal and Denisovan genomes.
a, The maximum divergence between windows in the two archaic genomes versus their minimum divergence to Africans. Error bars represent the 95% confidence intervals from 1,000 bootstrap replicates. Regions previously described as inbred in the Altai Neanderthal genome2 were excluded. b, Heterozygosity (per 1,000 bp) in windows of each archaic genome versus their minimum divergence to Africans. c and d, Simulation of a model with gene flow into the Denisovan lineage from both the Altai Neanderthal (0.65%, 50,000 years ago) and an unknown archaic hominin (1%, 200,000 years ago) that diverged from other hominins 1.5 million years ago. The constant mutation rate used makes the slope of the simulated curves less steep than in the actual genomes, where mutation rate varies among windows. e and f, Simulation of a model that also includes modern human gene flow into the Altai Neanderthal lineage (3.55%, 100,000 years ago).
Model-based inferences of gene flow
We assessed the possibility of modern human gene flow into the Altai Neanderthal lineage using the Generalized Phylogenetic Coalescent Sampler (G-PhoCS)11, a Bayesian method for inferring divergence times, effective population sizes and rates of gene flow. We applied G-PhoCS in five separate analyses, each considering the Altai Neanderthal and Denisovan genomes and two present-day human genomes from an African, European or Asian population (Supplementary Information section 8). We modeled gene flow among modern and archaic populations, including gene flow from an unknown deeply divergent archaic population, while accounting for the uncertainty in the ages of the archaic individuals.
The inferred demographic model confirms and provides quantitative estimates of previously inferred gene flow events among modern and archaic humans2,3 (Extended Data Fig. 1). These include Neanderthal gene flow into modern humans outside Africa (3.3–5.8%) and gene flow from an unknown archaic hominin into the ancestors of Denisovans (0.0–0.5%). Interestingly, we also detect a signal of gene flow from modern humans into the ancestors of the Altai Neanderthal (1.0–7.1%). The precise source of this gene flow is unclear, but it appears to come from a population that either split from the ancestors of all present-day Africans or from one of the early African lineages, as significant admixture rates are estimated from San as well as Yoruban individuals. This introgression thus occurred in the opposite direction than the previously reported gene flow from Neanderthals to modern humans outside Africa2,3,12.
Simulation of modern human gene flow
We used simulations to test if G-PhoCS correctly infers modern human gene flow into the Altai Neanderthal lineage (Extended Data Fig. 2 and 3) and whether the patterns of divergence and heterozygosity observed in the Altai Neanderthal genome are expected from our demographic scenario. We simulated windows of 100 Kb under a model with gene flow into the Denisovan lineage from both the Altai Neanderthal and a deeply divergent archaic hominin2, and a model including these admixture events together with modern human gene flow into the Altai Neanderthal lineage. Both models reproduced the observed patterns in windows most divergent to Africans (Fig. 1c and d), but only the model with modern human gene flow into the ancestors of the Altai Neanderthal reproduced the divergence and heterozygosity patterns in windows of the Altai Neanderthal least divergent to Africans (Fig. 1e and f).
Present-day human contamination among the DNA fragments from the Altai Neanderthal and Denisovan is around 1% (Table 1). After genotype calling, which is unaffected by low levels of error, these genomes should be largely free from contamination2,7. Even so, substituting gene flow from modern humans for present-day human contamination as high as 5% in the genotypes of the Altai Neanderthal fails to explain the observed sequence patterns (Extended Data Fig. 4).
Table 1. The archaic individuals analyzed in this work.
Radiocarbon dates (uncalibrated), mean contamination estimates for the DNA fragments sequenced and summary statistics for the genomes and chromosome 21 sequences.
| Age (year old) | Altai Neanderthal2 | Denisovan7 | El Sidrón Neanderthal | Vindija Neanderthal | |
|---|---|---|---|---|---|
|
| |||||
| >50,000 | >50,000 | ~49,000 | ~44,000 | ||
|
| |||||
| mtDNA contamination (%) | 0.78 | 0.35 | 0.40 | 1.08 | |
| Nuclear contamination (%) | 0.80 | 0.22 | 0.000023 | 1.12 | |
| Genome | |||||
| Average coverage | 52.7-fold | 30.9-fold | – | – | |
| Heterozygosity (per Kb) | 0.19 | 0.22 | – | – | |
| Chromosome 21 | |||||
| DNA enrichment | – | – | 320-fold | 120-fold | |
| Average coverage | 53.7-fold | 31.1-fold | 14.1-fold | 35.9-fold | |
| Heterozygosity (per Kb) | 0.13 | 0.21 | 0.24 | 0.26 | |
| Cumulative length of homozygous segments (Mb) | 10 – 100 Kb | 9.68 | 22.6 | 20.5 | 20.5 |
| > 100 Kb | 19 | 4.8 | 5.1 | 5.1 | |
Estimated ages of the introgressed haplotypes
The majority of haplotypes shared between present-day humans and an archaic genome should result from incomplete lineage sorting in the population ancestral to them and, thus, be old and short. However, if modern human introgression into the Altai Neanderthal lineage occurred after its separation from the Denisovan lineage we would expect a fraction of these shared haplotypes to be younger and longer in the Altai Neanderthal than in the Denisovan genome.
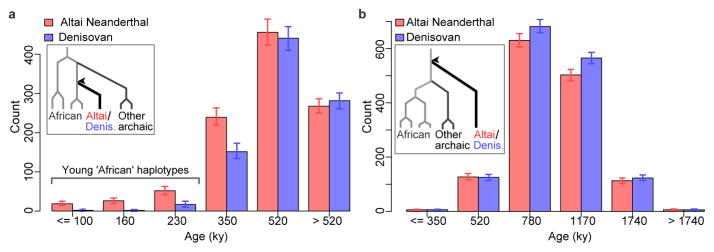
We examined these shared haplotypes making use of ARGweaver13, a new computational method for sampling full genealogies and corresponding recombination events (ancestral recombination graphs) consistent with a collection of genome sequences (Supplementary Information section 10). We applied this method to six African genomes (San, Mbuti and Yoruban) and the two archaic genomes, and estimated the ages of haplotypes for which one archaic genome coalesces within the subtree of the African genomes more recently than it coalesces with the other archaic genome (inset in Fig. 2a). When we compare the age distribution of such ‘African’ haplotypes (≥50 Kb), we find that the Altai Neanderthal genome has more young ‘African’ haplotypes (left of Fig. 2a) than the Denisovan genome (P < 0.01; Fraction of MCMC replicates). The majority of these young haplotypes are estimated to coalesce in the African genomes 100,000–230,000 years ago, suggesting that they entered into the ancestors of the Altai Neanderthal well before the reported gene flow from Neanderthals into modern humans outside Africa 47,000–65,000 years ago12. Both the cumulative and average length of the young ‘African’ haplotypes is longer in the Altai Neanderthal genome than in the Denisovan genome.
Figure 2. Distinguishing between two scenarios of introgression into archaic humans.
a, The age distribution of ‘African’ haplotypes (≥50 Kb) in the Altai Neanderthal and the Denisovan genomes as inferred by ARGweaver. Error bars represent the 95% credible intervals from 302 MCMC replicates. An ‘African’ haplotype coalesces within the African subtree before coalescing with the other archaic individual (inset), and its age is inferred as that coalescent time (arrow head). The majority of the young ‘African’ haplotypes in the Altai Neanderthal genome are estimated to coalesce 100,000–230,000 years ago, with just a few estimated to coalesce less than 100,000 years ago (Supplementary Information section 10). b, The age distribution ‘deep ancestral’ haplotypes (≥50 Kb) in the Altai Neanderthal and Denisovan genomes. A ‘deep ancestral’ haplotype coalesces above the African subtree and the other archaic lineage (inset), and its age is inferred as that coalescent time (arrow head).
The introgression from a deeply divergent archaic population into the Denisovan lineage is a potential confounding factor in this analysis. However, this introgression event should affect older haplotypes in the Denisovan genome, rather than the young haplotypes examined above. Indeed, we find that the number of haplotypes in one archaic genome that coalesce outside Africans and the other archaic genome (inset Fig. 2b) is higher in the Denisovan than in the Altai Neanderthal (right of Fig. 2b). Furthermore, the young ‘African’ haplotypes in the Altai Neanderthal genome do not significantly overlap with the older haplotypes in the Denisovan genome and in simulations ARGweaver only infers them under a model with modern human gene flow into the Altai Neanderthal lineage (Extended Data Fig. 5).
Inferences of gene flow in European Neanderthals
To investigate possible differences among Neanderthal populations with respect to introgression from modern humans, we designed oligonucleotide probes14 based on the human reference sequence of chromosome 21, and used them to capture15 this chromosome in a Neanderthal from Spain (El Sidrón Cave) and a Neanderthal from Croatia (Vindija Cave). We estimated their present-day human contamination to around 1% (Table 1).
We find that the chromosome 21 of the Altai Neanderthal shares more derived alleles with Africans than the chromosome 21 of El Sidrón (3.5% more) and Vindija (4.9% more) Neanderthals, with the European Neanderthals sharing more derived alleles with Africans than the chromosome 21 of the Denisovan (9.8% more for El Sidrón, 8.8% more for Vindija). A comparison of the distribution of haplotype ages is not possible with the European Neanderthals, owing to low amounts of data, but we compared the cumulative length of haplotypes coalescing within the African subtree for each Neanderthal lineage. This length is significantly greater for the Altai Neanderthal than for the European Neanderthals (P < 0.01; G-test), consistent with introgression from modern humans primarily into this Siberian lineage.
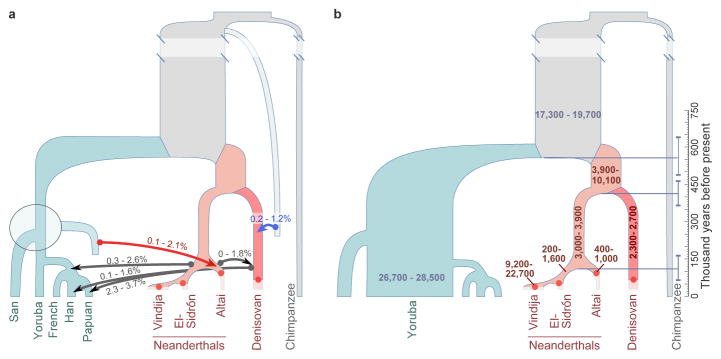
When we refine our estimates of gene flow by adding the chromosome 21 sequences of the European Neanderthals to our genome-wide data, G-PhoCS infers significant rates of gene flow from Neanderthals into modern humans outside Africa only for El Sidrón and Vindija Neanderthals (0.3–2.6%) (Fig. 3a), suggesting that Neanderthals from Europe are more closely related than the Altai Neanderthal to the population that interbred with modern humans outside of Africa 47,000–65,000 years ago12. Conversely, significant rates of gene flow from modern humans into Neanderthals are inferred only into the ancestors of the Altai Neanderthal (0.1–2.1%) (Extended Data Fig. 6 and 7). This suggests that modern human introgression into Neanderthals occurred mainly after the divergence of the Altai Neanderthal from El Sidrón and Vindija lineages 110,000 (68,000–167,000) years ago (Fig. 3b). However, it is possible that the lack of complete genomes from the European Neanderthals currently precludes the identification of such gene flow.
Figure 3. Refined demography of archaic and modern humans.
a, Total migration rates of six gene flow events inferred by G-PhoCS. The ranges correspond to 95% Bayesian credible intervals aggregated across runs. Five gene flow events have been previously reported, including gene flow from an unknown archaic group into Denisovans (blue arrow). In addition, we infer gene flow from a population related to modern humans into a population ancestral to the Altai Neanderthal (red arrow). It appears to come from a population that either split from the ancestors of present-day Africans or separated fairly early in the history of African populations (dashed gray box). b, Effective population sizes and divergence times inferred by G-PhoCS. The ranges correspond to 95% Bayesian credible intervals aggregated across runs. The horizontal bars (dashed) indicate posterior mean estimates for divergence times. Archaic samples (dots) are located at their estimated ages.
To explore the source of the modern human gene flow among the African populations, we simulated three scenarios in which the source of the gene flow into the Altai Neanderthal lineage was alternately an unknown population diverging from the ancestors of all present-day Africans, of the San or of the Yoruba lineage (Supplementary Information section 8). The G-PhoCS estimates from these three models are all similar and consistent with those in Figure 3, and thus we cannot distinguish among them. However, it is clear that the source of the gene flow cannot be a population ancestral to present-day non-Africans but not to Africans (Extended Data Fig. 3). We conclude that the introgressing population diverged from other modern human populations before or shortly after the split between the ancestors of San and other Africans (Fig. 3a), which occurred approximately 200,000 years ago11. In agreement, the San, Mbuti and Yoruba genomes contribute equally to the young ‘African’ haplotypes in the Altai Neanderthal genome (Supplementary Information section 10).
Introgressed segments in the Altai Neanderthal
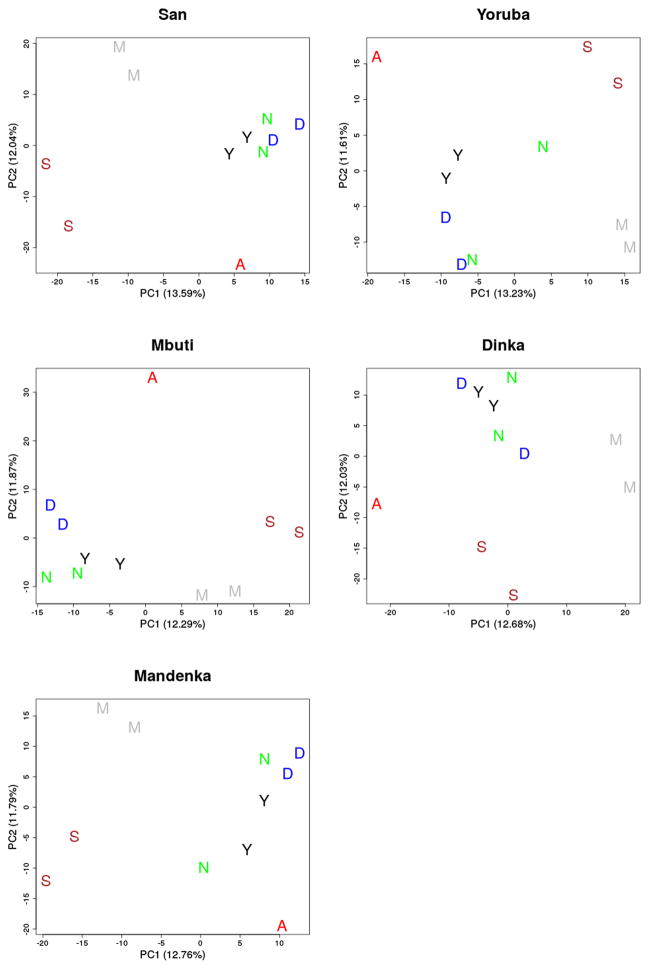
To shed light on possible functional implications of the modern human gene flow, we identified 163 putatively introgressed segments (≥50 Kb) in the Altai Neanderthal genome (Supplementary Information section 9). These segments have no clear affinity to any present-day African population (Extended Data Fig. 8), overlap with 225 genes and seven of them exceed 200 Kb (Table 2). The longest segment (309 Kb) overlaps with a region suspected to have been under positive selection in modern humans3, which includes a transcription factor gene (NR5A2) involved in liver development16. One segment of 150 Kb is located within the FOXP2 gene (Table 2), which encodes a transcription factor that may be relevant for language acquisition17.
Table 2. Introgressed segments from modern humans into the Altai Neanderthal.
The seven segments (≥200 Kb) that are enriched in heterozygous sites with derived alleles at high-frequency in Africans. The segment overlapping the FOXP2 gene is also shown.
| Genomic region | SNPs | Sequence length (bp) | Genetic length (cM) | Genes in the region |
|---|---|---|---|---|
| Chr1:199,707,795–200,016,460 | 161 | 308,665 | 0.047 | NR5A2; RNU6-609P; RNU6-716P; RNU6-778P |
| Chr13:49,532,446–49,790,867 | 103 | 258,421 | 0.040 | COX7CP1; FNDC3A; OGFOD1P1; RAD17P2; RNU6-60P; RNY3P2 |
| Chr2:88,815,371–89,061,977 | 116 | 246,606 | 0.023 | EIF2AK3; RPIA; TEX37 |
| Chr3:89,790,776–90,031,537 | 70 | 240,761 | 0.017 | – |
| Chr3:30,590,736–30,816,806 | 100 | 226,070 | 0.547 | GADL1; TGFBR2 |
| Chr6:42,492,777–42,713,223 | 67 | 220,446 | 0.088 | ATP6V0CP3; PRPH2; RNU6-890P; TBCC; UBR2 |
| Chr8:93,809,505–94,011,334 | 122 | 201,829 | 0.070 | IRF5P1; TRIQK |
|
| ||||
| Chr7:113,813,987–113,963,584 | 37 | 149,597 | 0.055 | FOXP2 |
The number of introgressed segments in the Altai Neanderthal decreases in regions of the genome under strong purifying selection (measured via background selection at linked sites18), and it is lower in the X chromosome compared to the autosomes. Because purifying selection purges deleterious alleles and the efficacy of purifying selection is higher on the X chromosome19, this may indicate that modern human and Neanderthal20 alleles were often not tolerated in each other’s genetic background.
Population size in Neanderthals and Denisovans
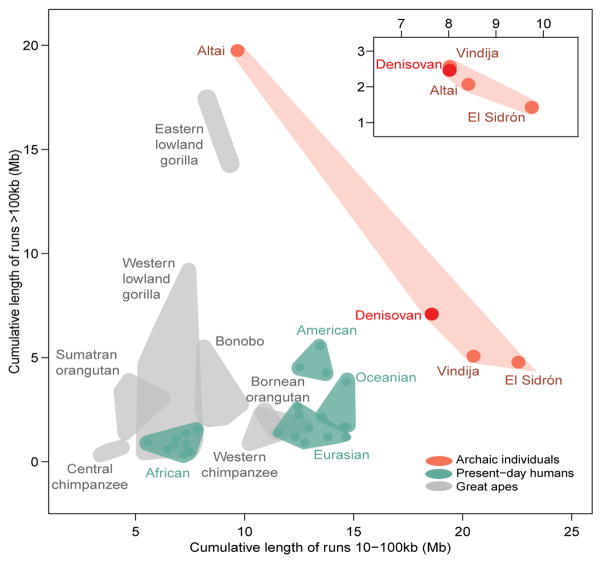
Our demographic model suggests a long-term decline in the effective population size of Neanderthals and Denisovans since their divergence from the ancestors of present-day humans 484,000–640,000 years ago. However, the population ancestral to the Vindija Neanderthal appears to have expanded (Fig. 3b). In addition, the length distribution of homozygous stretches in the European Neanderthals resembles that of the Denisovan, who lacks a signal of recent inbreeding7, and not that of the Altai Neanderthal, whose parents were related at the level of half-siblings2 (Table 1). Still, the European Neanderthals and the Denisovan exhibit signs of a history of mating in small populations21, with a larger cumulative length of homozygous segments of 10–100 Kb than present-day humans and great apes (Fig. 4). In agreement with purifying selection being less efficient in small populations, regulatory and conserved22 regions in Neanderthals have a larger proportion of putatively deleterious alleles than do present-day humans (Extended Data Fig. 9), as shown previously for their protein-coding genes23.
Figure 4. Homozygous segments in chromosome 21.
a, The range of the cumulative length (Mb) of homozygous segments is shown as the surface of a polygon, with individuals at the extremes of each group’s range serving as vertices. Dots represent human individuals, archaic or otherwise, whereas great apes are not depicted individually. The Altai Neanderthal clusters with the other archaic individuals (inset) when recently inbred genomic regions are excluded.
Discussion
Our integrated demographic analysis of multiple archaic and present-day human genomes suggests a scenario of long-term decline in the populations of Neanderthals and Denisovans, with the consistently small Altai Neanderthal population perhaps reflecting a long period of isolation in the Altai Mountains. In addition, we provide evidence for modern human introgression into the ancestors of this population of Neanderthals, and no such evidence in the European Neanderthals. These modern humans may represent a population that diverged early from other modern humans in Africa and later met the ancestors of Neanderthals. The finding of ‘African’ haplotypes as young as 100,000 years old in the Altai Neanderthal genome is consistent with interbreeding around that age.
Hublin24 has proposed that Neanderthals expanded eastward from Europe during an interglacial period about 125,000 years ago (Oxygen Isotope Stage 5e). The presence of modern humans (at Skhul and Qafzeh) and Neanderthals (at Tabun) in the Levant as early as 120,000 years ago25,26 provides one place where gene flow from early modern humans into Neanderthals could have occurred. Another place is Southern Arabia and the area around the Persian Gulf, where modern humans may have also settled early27 and Neanderthals are likely to have been present28. The recent demonstration that modern humans may have been in China as early as 120,000 years ago29 also suggests that early modern humans may have left Africa and thus mixed with archaic hominins prior to the migration of the ancestors of present-day non-Africans less than 65,000 years ago27.
Online-only Methods
DNA Extraction and Library preparation
We prepared DNA extracts from two Neanderthal bones, SD1253 from El Sidrón Cave and Vi33.15 from Vindija Cave, as described in Rohland et al.30 (Supplementary Table 1), and prepared DNA sequencing libraries containing a special four base pair clean-room tag sequence to avoid contamination in later steps31,32. During library preparation, we used a uracil-DNA-glycosylase (UDG) and endonuclease VIII mix to remove uracils resulting from cytosine deaminations33.
Chromosome 21 capture experiment
We used a strategy previously described15 that uses oligonucleotides synthesized on arrays to construct amplified probe libraries. We produced a probe library with a tile density of 3 nucleotides across the 29.8 Mb of non-repetitive sequences in chromosome 21 (GRCh37/hg19), with biotinylated probes similar to those described by Gnirke et al.34. We used this probe library, as previously described23, to generate libraries from El Sidrón and Vindija Neanderthals. All libraries were subjected to a second round of amplification, followed by two rounds of hybridization capture. Capture eluates were amplified, barcoded with two indexes32, pooled, and sequenced on the Genome Analyzer IIx (Illumina).
Contamination estimates
Estimates of present-day human mtDNA contamination in El Sidrón and Vindija libraries were previously reported in Castellano et al.23. These contamination estimates were calculated using diagnostic positions at which archaic mitochondrial genomes differed from sequences in a panel of 311 present-day human mitochondrial genomes. Nuclear DNA contamination estimates were calculated using a previously described maximum likelihood approach7 that co-estimates the contamination and sequence error in the autosomes.
Computational correction of cytosine deaminations
Sequences may carry residual cytosine deaminations in the first positions of the 5′ end and the last positions in the 3′ end in spite of the UDG treatment33 (Supplementary Fig. 1). These bases are read as thymine and adenosine, respectively. As similarly described for the Altai Neanderthal genome2, we decreased the quality to 2 of any ‘T’ base occurring within the first five bases or ‘A’ base within the last five positions in El Sidrón and Vindija sequences.
Variation discovery
We called Neanderthal genotypes with GATK35 and applied a previously described set of filters23 (Supplementary Information section 3) to obtain high-quality sites for subsequent analyses. We obtained such calls for 17,014,623 and 20,582,399 sites for El Sidrón and Vindija, respectively. Genotypes in the Altai Neanderthal (23,023,770 sites), Denisovan (22,945,618 sites) and present-day human genomes were similarly obtained (Supplementary Table 6), and a combined file for all individuals was created and annotated as in Meyer et al.7. Because multiple contaminated DNA fragments are needed for a contaminated genotype to be called, the proportion of contaminated genotypes is likely to be smaller than the reported contamination of 1% among DNA fragments.
Capture bias
In order to understand capture bias, we captured the chromosome 21 of the Altai Neanderthal to an average coverage of 46.9-fold. We then downsampled these sequences to assess capture bias at a wider range of average coverage from 8.1-fold to 35.7-fold, and did the same for the Altai shotgun sequences. The mean reference allele frequency is shifted from 0.52 in the shotgun sequences to 0.54–0.55, similar to the observed frequencies in the other archaic captured individuals (Supplementary Fig. 4). The mutation spectra after filtering do not change with coverage (Supplementary Fig. 2), and differences in allele frequency at heterozygous sites in the shotgun sequences are small (Supplementary Fig. 5). We observed that 3.8–5.2% of heterozygous sites in the shotgun sequences of chromosome 21 in the Altai Neanderthal are homozygous in the capture experiment at coverage from 14-fold to 46.9-fold (Supplementary Table 7). However, 22.3–45.4% of these heterozygous sites are filtered out, mainly due to low coverage in the capture sequences. The same is true for sites that are heterozygous in the capture experiment at 46.9-fold coverage, but homozygous (4.9–5.9%) or missing (14.1–21.6%) in the shotgun data at 15.1–53.7-fold coverage. In addition, the distribution of homozygosity stretches does not differ between the capture and the shotgun sequences (Supplementary Fig. 9). We conclude that capture bias does not distort our results in a systematic way.
Sequence patterns
Our analysis of the divergence of the archaic genomes to Africans and to each other sought to uncover the patterns that distinguish modern human gene flow into the Altai Neanderthal lineage and archaic gene flow into the Denisovan lineage. To do this, we analyzed 15,881 sequence windows of 100 Kb in length across the genomes of the two archaic individuals. These windows were required to have high-quality genotypes (as described in Supplementary Information section 3) in at least 50% of its length in both archaic genomes. Because the phase of the archaic alleles is unknown, the divergence of the archaic genomes to Africans was calculated using the archaic alleles in each window that give the minimum number of differences to derived alleles at >0.9 frequency in 504 individuals from five African present-day populations (Yoruba, Mende, Luhya, Gambian and Esan)8. Using the minimum divergence to Africans allows introgressed segments from modern humans to be more easily identified. In contrast, the divergence between the archaic genomes was calculated using the archaic alleles in each window that give the maximum number of differences. Using the maximum divergence between the archaic windows allows introgressed segments in either of the two archaic individuals to be more easily identified. Derived alleles were determined using the inferred ancestral base in the EPO six-primate alignments36 and the minimum and maximum number of differences in a sequence window was divided by its number of high-quality genotypes. Regions of the genome described as inbred in the Altai Neanderthal2 were excluded from this analysis. These are 103 regions > 2.5cM depleted in heterozygous sites. In this way, heterozygosity in Fig. 1b could be calculated from the same 15,881 sequence windows of 100 Kb in Fig. 1a.
We used ms37 to simulate 15,881 sequence windows of 100Kb in length, using parameters that are consistent with the G-PhoCS estimates (Supplementary Information section 8). We simulated scenarios with and without modern human gene flow into the Altai Neanderthal lineage (Supplementary Information section 9). The mutation rate of 0.5×10⁻⁹ mutations per bp and year4,38 and an average generation time of 29 years39 (as assumed in the G-PhoCS inferences) were also used. The number of chromosomes simulated were 1,008 for the Africans, two for the Neanderthal, two for the Denisovan, one for the unknown archaic and one for the chimpanzee.
Alignments at neutral loci
Multiple sequence alignments were obtained for our main demography inference using G-PhoCS. Following the guidelines established in previous studies11,40, we extracted multiple sequence alignments of the Altai Neanderthal, the Denisovan and multiple present-day humans at 13,753 loci 1 Kb long, selected to minimize influence of direct selection, linkage between loci, and missing data. Among these, 2,960 loci were selected from chromosome 21, for which sequence data was available from El Sidrón and Vindija Neanderthals.
Demography inference
Our demography inference is based on five main G-PhoCS runs, each one containing the Altai Neanderthal, the Denisovan, the chimpanzee outgroup (panTro2), and two present day humans from a particular population. We considered populations from Africa (Yoruba and San), Europe (French), East Asia (China), and Oceania (Papuan). In five additional runs we added sequences from chromosome 21 of El Sidrón and Vindija Neanderthals. To account for the fact that different individuals lived at different times, we modified the algorithm to sample the times of the archaic individuals as four additional free parameters (Supplementary Information section 8). To validate the robustness of our estimates, we conducted additional inferences using subsets of the archaic individuals, different subsets of the loci, and allowing for gene flow from an unsampled (unknown) divergent human group, and explicitly modeling the source population of modern introgression into the ancestors of the Altai Neanderthal as an unsampled population branching off from the modern human population.
G-PhoCS setup
In each G-PhoCS run, we ran the Markov chain Monte Carlo (MCMC) sampler for 100,000 burn-in iterations and 200,000 subsequent sampling iterations, and checked manually for convergence of the Markov Chain. The samples were used to estimate a posterior mean and 95% Bayesian credible interval for each demographic parameter. For parameters common to the five runs with different present-day humans, we combined the five parameter traces to obtain aggregated estimates. Estimates of population divergence time and effective population size were calibrated by assuming an average mutation rate of 0.5×10⁻⁹ per base pair per year4,38 and an average generation time of 29 years39. Estimates under different assumptions on mutation rate and generation time are obtained by simple scaling of the reported estimates. Gene flow is measured using the total migration rate, which is the estimated per-generation rate times the number of generations that migration is allowed in the model.
Simulations
To validate the G-PhoCS inferences we simulated, using ms37, 10,000 loci of 1 Kb of length for the Altai Neanderthal, Denisovan, three present-day humans from a San, Yoruba and European populations and the chimpanzee outgroup. Demographic parameters were set according to the ones inferred on the genomic sequences, with parameters describing divergence times of modern populations and growth of the European population taken from recent studies11,41. For these individuals, sequences were simulated under different scenarios for modern human introgression into the Altai Neanderthal population: (1) no introgression; (2) introgression from a population that diverged from present-day humans before the San divergence; (3) introgression from a population that diverged from the population ancestral only to Yoruba and Europeans; (4) introgression from a population that diverged from the population ancestral only to the San; and (5) introgression from a population ancestral only to Europeans. These five scenarios also included simulated gene flow from the Altai Neanderthal and an unsampled archaic population into the Denisovan population. G-PhoCS was run under each scenario three times (one for each present-day individual) with the same settings used in the analysis of the actual genomes.
ARGweaver analysis
ARGweaver was run using the Altai Neanderthal and Denisovan genomes, six modern human genomes (two Yoruba, two San, and two Mbuti; Supplementary Table 2), and the chimpanzee reference genome (panTro4). Filters were applied to mask regions with uncertain genotype calls. The genome was divided into roughly 5 Mb blocks with 1 Mb overlap between adjacent blocks. A new method to integrate over genotype phase was used on the archaic and present-day human genomes (Supplementary Information section 10). Other settings, such as the recombination and mutation rate map, and the population size (N=11,534), were the same as previously reported13. ARGweaver was run for 5,000 MCMC iterations, with an ancestral recombination graph sampled every 20 iterations starting at iteration 2,000. ARGweaver was run similarly with El Sidrón and Vindija chromosome 21 included. ‘African’ and ‘deep ancestral’ haplotypes were determined in each sampled ancestral recombination graph using only a single lineage from each archaic genome to avoid differences in power between them due to different levels of heterozygosity and inbreeding.
Screen for introgressed segments
A screen for modern human introgressed segments was performed using the frequency in Africans of derived alleles in sites that are heterozygous in one archaic genome (Altai Neanderthal or Denisovan) and homozygous ancestral in the other archaic genome. This allows us to identify segments that carry an archaic haplotype on three chromosomes, and a human haplotype only on one chromosome. Derived alleles were determined using the inferred ancestral base in the EPO six-primate alignments36. Genotypes and allele frequencies for the African individuals were obtained from the 1000 Genomes project8. We fitted the African derived allele frequencies along each of the archaic genomes using a locally weighted polynomial regression (loess function in R), and selected those genomic segments containing at least 10 sites where the fitted curve to the derived African allele frequencies consistently stayed over a frequency of 0.25 across 25 Kb. Segments containing incompatible sites, i.e. sites that were derived and shared in both archaic individuals, were removed. In the Altai Neanderthal, the average heterozygosity of the putatively introgressed segments is 4.9-fold higher than in random genome regions (Supplementary Information section 9).
Homozygosity segments
Homozygous segments were defined as maximal regions between two heterozygous positions of length between 10 and 100 Kb or larger than 100 Kb. To compare the hominin samples with great apes, we masked regions for which no data on great apes were available42 in addition to the filters described in Supplementary Information section 3.
Prediction of functional consequences
We tested the functional consequences of the derived alleles using conservation scores from PhastCons22. We calculated the fractions of mutations in deleterious sites for the different human groups (Supplementary Information section 7). We used annotations of transcripts from ENSEMBL43 to define coding regions, untranslated regions, and 5,000 bases upstream of transcription start sites and downstream of transcription end sites. We used those as well as conserved transcription factor binding sites44 and conserved elements, and sampled randomly for each category the same number of bases in neutral sites to calculate the ratio of “functional” to “neutral” polymorphism.
Extended Data
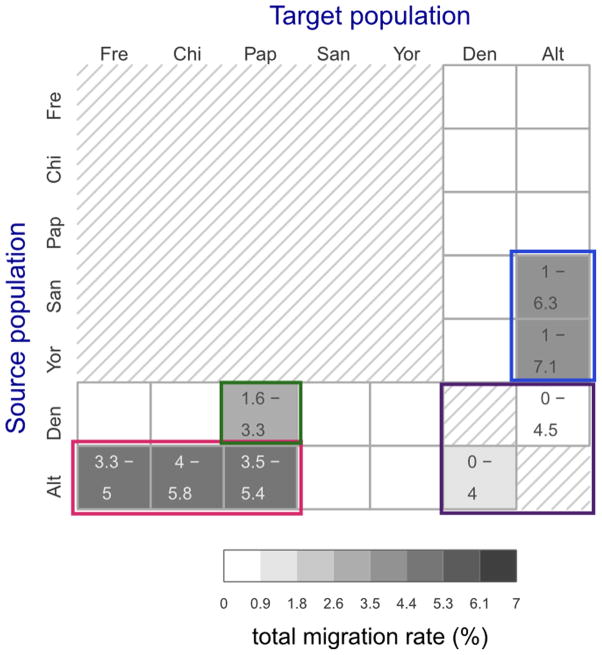
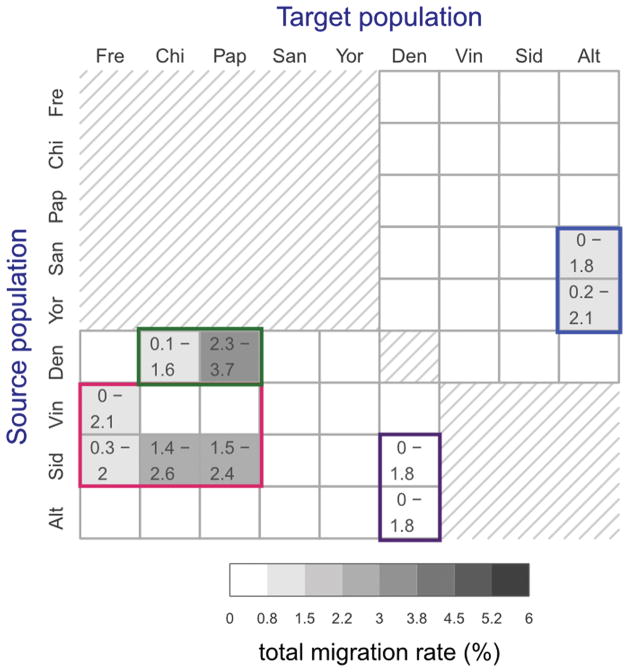
Extended Data Figure 1. Migration rates in preliminary demographic inference.
Total migration rates estimated for 22 directional migration bands in five separate preliminary G-PhoCS runs. Rows correspond to source populations and columns to the target populations. The 20 migration bands between modern and archaic populations were considered in five separate runs, each containing the four bands associated with a different modern human population (Supplementary Fig. 15A). The two migration bands between the Denisovan the Altai Neanderthal populations were considered in all five runs, and the values shown here correspond to an aggregate of all five runs. The estimates are as shown in Supplementary Fig. 15B. Shade indicates the posterior mean total migration rate (legend), which approximates the probability that a lineage in the target population originated in the source population. The 95% Bayesian credible intervals are indicated for migration bands whose upper credible interval bound is above 0.3%. We identified four clusters of migration bands, corresponding to what were likely at least four different cases of introgression between populations: (1) Neanderthals into non-African modern humans (red box), (2) Denisovans into Oceanians (green box), (3) between Neanderthals and Denisovans (magenta), and (4) modern humans into Neanderthals (blue box).
Extended Data Figure 2. Demographic inference on simulated data.
Simulated data were generated under the demographic model as inferred by G-PhoCS (Supplementary Table 13). Each simulated data set consisted of 10,000 loci of length 1 Kb. We simulated the Altai Neanderthal, the Denisovan, and three modern human populations corresponding to the San, Yoruba, and French, with modern human demography consistent with recent studies (Supplementary information section 8). Three migration bands were simulated: (1) from the Altai Neanderthal to the Denisovan, (2) from a population that diverged from the ancestors of all present-day humans 300,000 years ago into the Altai Neanderthal, and (3) from a population that diverged from the ancestors of all modern and archaic humans roughly 2.6 million years ago into the Denisovan. a, Estimates of demographic parameters from three G-PhoCS runs on data simulated with gene flow from modern humans into the Altai Neanderthal lineage. Each run analyzes an individual from a different present-day population, using the exact same setup used in our main analysis (Supplementary Fig. 15A). Parameters are typically estimated accurately, with 95% Bayesian credible intervals containing the values used in simulations (horizontal red lines). Rates of archaic gene flow into Denisovan appear to be somewhat over-estimated, and differences between analyses of African and non-African populations are consistent with those observed in the data analysis (Supplementary Fig. 15B). b, Similar analysis done on data simulated without gene flow from modern humans into the Altai Neanderthal lineage. Accurate estimates are obtained for all model parameters, and no gene flow is inferred from modern humans into the ancestors of the Altai Neanderthal.
Extended Data Figure 3. Simulation of different source populations for modern introgression into Neanderthals.
Estimated rates of migration from modern human population to the Altai Neanderthal population obtained from 15 G-PhoCS runs on five simulated data sets. All demographic parameters are set according to the values inferred by G-PhoCS in our data analysis (Supplementary Table 13), and the five data sets differ by the source population for migration: no migration (none), population ancestral to all present-day humans (ancestral), population ancestral to Yoruba and Europeans (Yoruba), San population (San), and European population (European). The first two sets are the ones analyzed in Extended Data figure 2. Each data set is analyzed three times, using different present-day samples: European (French), Yoruba, or San. Significant differences in estimates are observed between the data sets with and without gene flow and the data set with gene flow from a source population related to Europeans. Only minor differences were observed between values inferred for the three data sets with source population diverging from African populations (San, Yoruba, and ancestral). We conclude from this that the source population likely diverged from an African human population before the divergence of present-day Eurasians. A dashed gray box in Figure 3a represents this conclusion.
Extended Data Figure 4. Simulation of present-day human contamination.
Simulated windows of 100 Kb for the Altai Neanderthal and Denisovan genomes with present-day human contamination of 5% at the genotype level. Windows are binned by their minimum divergence to Africans using derived alleles at >0.9 frequency in the simulated African population. X- and Y-axis as in Figure 1. a, Gene flow from a deeply divergent archaic hominin into the Denisovan lineage (1%) and Altai Neanderthal gene flow into the Denisovan lineage (0.65%). b, Gene flow from a deeply divergent archaic hominin into the Denisovan lineage, Altai Neanderthal gene flow into the Denisovan lineage and modern human gene flow into the Altai Neanderthal lineage (1.8%).
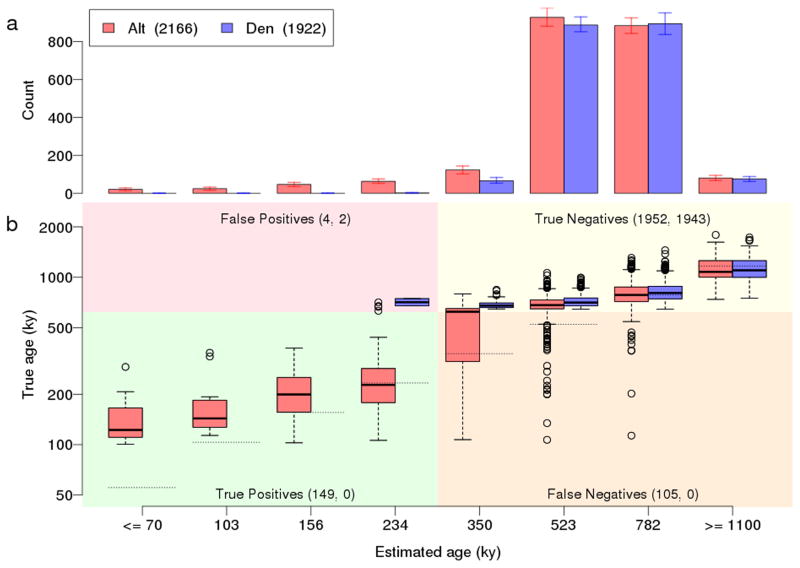
Extended Data Figure 5. Haplotype ages inferred by ARGweaver on simulated data.
a, Distribution of ‘African’ haplotypes ages in sequences simulated with introgression into the Altai Neanderthal lineage from modern humans 100,000 years ago. ‘African’ haplotypes are identified as in Figure 2. b, Distribution of true haplotype ages for each of the estimated ages. The horizontal dotted lines show the estimated age. The plot is divided into four quadrants; the lower half represents ‘African’ haplotypes having true ages between 100,000 and 620,000 years ago (the divergence time between archaic and present-day humans), which are necessarily due to post-divergence gene flow from modern humans. The left side of the plot represents regions that would be identified as introgressed based on a threshold of ≤ 234,000 years ago. The counts in each quadrant are for Altai Neanderthal (red) and Denisovan (blue), respectively. The counts for the Denisovan in the lower two quadrants are zero because there was no simulated migration from modern humans into the Denisovan lineage. Note that this is a somewhat nonstandard plot of true age versus estimated age; a more standard, reversed view is given in Supplementary Fig. 33 and demonstrates that the estimated ages are largely unbiased.
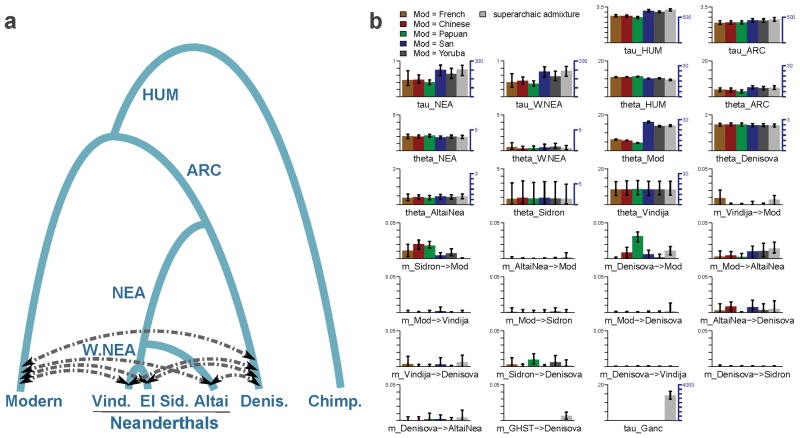
Extended Data Figure 6. Main G-PhoCS demographic inference.
Summary of the main demographic inference using G-PhoCS in a model with four archaic populations and one modern human population. a, The population phylogeny assumed in each of the G-PhoCS runs. Labels on internal edges indicate names of the four ancestral populations: population ancestral to the two Western Neanderthals (W.NEA), population ancestral to all three Neanderthals (NEA), population ancestral to all four archaic individuals (ARC), and population ancestral to all human samples (HUM). We augmented the phylogeny with 14 directional migration bands (arrows) between all pairs of sampled populations except for the pairs of Neanderthal populations. In one of the runs we added an unknown “ghost” population and a migration band from that population into the Denisovan population. b, Parameter estimates obtained by G-PhoCS in six separate runs analyzing 13,754 neutral and loosely linked loci, substituting samples in the ‘Modern’ population with pairs of present-day humans from five different modern populations (Supplementary Table 11). The last run has gene flow from the “ghost” population and uses two Yoruban individuals in the modern human population. Bar heights indicate posterior mean and error bars correspond to 95% Bayesian credible intervals. Estimates of divergence times (τ) and population sizes (θ) are given in raw form, scaled by number of mutations per 10 Kb (left axis), and calibrated to absolute units, 1,000 years for time, and 1,000 individuals for effective population size, (right axis) assuming an average mutation rate of 0.5×10⁻⁹ mutations per year per bp and an average generation time of 29 years. For each of the 14 migration bands, we are showing the estimated total migration rates. See Supplementary Information section 8 for more information on parameter calibration and setup for G-PhoCS. A graphical summary of these estimates is given in Figure 3.
Extended Data Figure 7. Migration rates in main demographic inference.
Total migration rates estimated for 46 directional migration bands in five separate G-PhoCS runs. Rows correspond to source populations and columns to the target populations. The 40 migration bands between modern (present-day) and archaic populations were considered in five separate runs, each containing the eight bands associated with a different modern human population (Extended Data Fig. 6a). The six migration bands between the Denisovan population and the three Neanderthal populations were considered in all six runs, and the values shown here were estimated as an aggregate of all five runs. The estimates are as shown in Extended Data figure 6. Shade indicates the posterior mean total migration rate (legend), which approximates the probability that a lineage in the target population originated in the source population. The 95% Bayesian credible intervals are indicated for migration bands whose upper credible interval bound is above 0.3%. We identified four clusters of migration bands, corresponding to what were likely at least four different cases of introgression between populations: (1) Western (European) Neanderthals into non-African modern humans (red box), (2) Denisovans into East Asian and Oceanians (green box), (3) Neanderthals into Denisovans (magenta), and (4) modern humans into Eastern Neanderthals (blue box). Directed arrows in Figure 3a depict these introgression events.
Extended Data Figure 8. Principal component analysis.
The putatively introgressed segments in the Altai Neanderthal genome, defined by derived alleles in two individuals from the San, Yoruba, Mbuti, Dinka or Mandenka populations. The introgressed segments show no clear affinity to one present-day African population. A=Altai Neanderthal, S=San, M=Mbuti, Y=Yoruba, D=Dinka, N=Mandenka.
Extended Data Figure 9. Natural selection in chromosome 21.
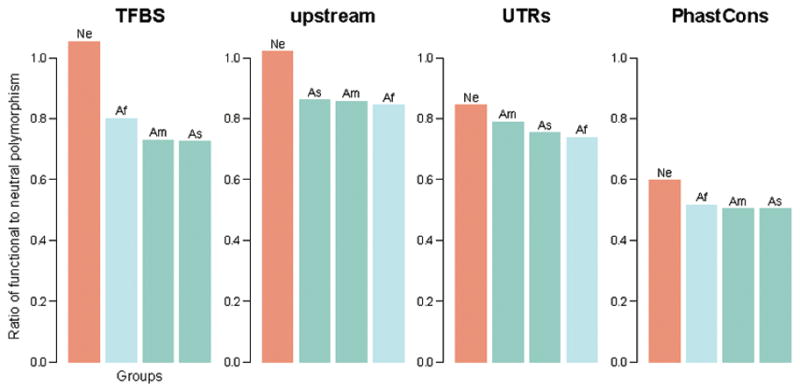
Ratio of functional (putatively deleterious) to neutral polymorphism in archaic and present-day humans (Supplementary Information section 7). TFBS = Transcription Factor Binding Sites; Upstream refers to 5 Kb before the transcription start site of genes; UTRs = UnTranslated Regions (in the mRNA). PhastCons ≥ 0.9 for a site to be used. Ne = Neanderthals; Af = Africans; As = Asians; Am = Americans.
Extended Data Table 1.
Shared derived alleles.Percentage of derived alleles in one archaic genome (Altai Neanderthal or Denisovan) shared with African genomes in sites that are homozygous ancestral in the other archaic genome. The percentages of shared derived alleles are binned by their African allele frequency. Fixed derived alleles in Africans are included in the ‘0.9 < f ≤ 1’ but also shown separately in the ‘Fixed’ category.
| African frequency | 0≤f≤0.1 | 0.1<f≤0.2 | 0.2<f≤0.3 | 0.3<f≤0.4 | 0.4<f ≤ 0.5 | 0.5<f ≤ 0.6 | 0.6<f≤0.7 | 0.7<f≤0.8 | 0.8<f ≤ 0.9 | 0.9<f≤ 1 | Fixed |
|---|---|---|---|---|---|---|---|---|---|---|---|
| Altai (%) | 66.86 | 5.01 | 3.89 | 3.42 | 3.11 | 2.79 | 2.71 | 2.55 | 2.68 | 6.99 | 2.98 |
| Denisovan (%) | 72.27 | 4.35 | 3.43 | 2.96 | 2.60 | 2.5 | 2.26 | 2.12 | 2.23 | 5.30 | 1.90 |
Supplementary Material
Acknowledgments
We thank M. Slatkin, F. Racimo, J. Kelso, K. Prüfer, M. Stoneking and D. Reich for comments; the MPI-EVA sequencing group, B. Nickel and R. Schultz for technical support; A. Heinze, S. Sawyer and J. Dabney for sequencing library preparation; U. Stenzel and G. Renaud for help with sequence processing. Q.F. is funded in part by the Special Foundation of the President of the Chinese Academy of Sciences. T.M-B. was supported by ICREA and the EMBO Young Investigator Award 2014. The Max Planck Society, the Krekeler Foundation, the MICINN (grant BFU2014-55090-P to T.M-B.) and the US National Institutes of Health (grant GM102192 to A.S.) provided financial support.
Footnotes
Supplementary Information is available in the online version of the paper.
Author contributions. M.M. and Q.F. performed experiments; M.Ku., I.Gr., M.H., C.d.F., J.P., M.Ki, Q.F., H.A.B., T.M-B., A.M.A., S.P., M.M., A.S. and S.C. analysed genetic data; C.L-F., M.d.l.R., A.R., P.R., D.B., Ž.,K., I.Gu. and B.V. analysed anthropological data; M.Ku., I.Gr., B.V., S.P., A.S. and S.C. wrote the manuscript.
Sequence data are available in the European Nucleotide Archive (ENA) under the following accession: PRJEB11828.
The authors declare no competing financial interests.
References
- 1.Arsuaga JL, et al. Neandertal roots: Cranial and chronological evidence from Sima de los Huesos. Science. 2014;344:1358–1363. doi: 10.1126/science.1253958. [DOI] [PubMed] [Google Scholar]
- 2.Prufer K, et al. The complete genome sequence of a Neanderthal from the Altai Mountains. Nature. 2014;505:43–49. doi: 10.1038/nature12886. [DOI] [PMC free article] [PubMed] [Google Scholar]
- 3.Green RE, et al. A draft sequence of the Neandertal genome. Science. 2010;328:710–722. doi: 10.1126/science.1188021. [DOI] [PMC free article] [PubMed] [Google Scholar]
- 4.Fu Q, et al. Genome sequence of a 45,000-year-old modern human from western Siberia. Nature. 2014;514:445–449. doi: 10.1038/nature13810. [DOI] [PMC free article] [PubMed] [Google Scholar]
- 5.Fu Q, et al. An early modern human from Romania with a recent Neanderthal ancestor. Nature. 2015 doi: 10.1038/nature14558. [DOI] [PMC free article] [PubMed] [Google Scholar]
- 6.Reich D, et al. Genetic history of an archaic hominin group from Denisova Cave in Siberia. Nature. 2010;468:1053–1060. doi: 10.1038/nature09710. [DOI] [PMC free article] [PubMed] [Google Scholar]
- 7.Meyer M, et al. A high-coverage genome sequence from an archaic Denisovan individual. Science. 2012;338:222–226. doi: 10.1126/science.1224344. [DOI] [PMC free article] [PubMed] [Google Scholar]
- 8.Genomes Project C et al. A global reference for human genetic variation. Nature. 2015;526:68–74. doi: 10.1038/nature15393. [DOI] [PMC free article] [PubMed] [Google Scholar]
- 9.Pickrell JK, et al. Ancient west Eurasian ancestry in southern and eastern Africa. Proceedings of the National Academy of Sciences of the United States of America. 2014;111:2632–2637. doi: 10.1073/pnas.1313787111. [DOI] [PMC free article] [PubMed] [Google Scholar]
- 10.Llorente MG, et al. Ancient Ethiopian genome reveals extensive Eurasian admixture throughout the African continent. Science. 2015 doi: 10.1126/science.aad2879. [DOI] [PubMed] [Google Scholar]
- 11.Gronau I, Hubisz MJ, Gulko B, Danko CG, Siepel A. Bayesian inference of ancient human demography from individual genome sequences. Nature genetics. 2011;43:1031–1034. doi: 10.1038/ng.937. [DOI] [PMC free article] [PubMed] [Google Scholar]
- 12.Sankararaman S, Patterson N, Li H, Paabo S, Reich D. The date of interbreeding between Neandertals and modern humans. PLoS genetics. 2012;8:e1002947. doi: 10.1371/journal.pgen.1002947. [DOI] [PMC free article] [PubMed] [Google Scholar]
- 13.Rasmussen MD, Hubisz MJ, Gronau I, Siepel A. Genome-wide inference of ancestral recombination graphs. PLoS genetics. 2014;10:e1004342. doi: 10.1371/journal.pgen.1004342. [DOI] [PMC free article] [PubMed] [Google Scholar]
- 14.Burbano HA, et al. Targeted investigation of the Neandertal genome by array-based sequence capture. Science. 2010;328:723–725. doi: 10.1126/science.1188046. [DOI] [PMC free article] [PubMed] [Google Scholar]
- 15.Fu Q, et al. DNA analysis of an early modern human from Tianyuan Cave, China. Proceedings of the National Academy of Sciences of the United States of America. 2013;110:2223–2227. doi: 10.1073/pnas.1221359110. [DOI] [PMC free article] [PubMed] [Google Scholar]
- 16.Rausa FM, Galarneau L, Bélanger L, Costa RH. The nuclear receptor fetoprotein transcription factor is coexpressed with its target gene HNF-3β in the developing murine liver intestine and pancreas. Mechanisms of Development. 1999;89:185–188. doi: 10.1016/S0925-4773(99)00209-9. [DOI] [PubMed] [Google Scholar]
- 17.Enard W. FOXP2 and the role of cortico-basal ganglia circuits in speech and language evolution. Current opinion in neurobiology. 2011;21:415–424. doi: 10.1016/j.conb.2011.04.008. [DOI] [PubMed] [Google Scholar]
- 18.McVicker G, Gordon D, Davis C, Green P. Widespread genomic signatures of natural selection in hominid evolution. PLoS genetics. 2009;5:e1000471. doi: 10.1371/journal.pgen.1000471. [DOI] [PMC free article] [PubMed] [Google Scholar]
- 19.Veeramah KR, Gutenkunst RN, Woerner AE, Watkins JC, Hammer MF. Evidence for increased levels of positive and negative selection on the X chromosome versus autosomes in humans. Molecular biology and evolution. 2014;31:2267–2282. doi: 10.1093/molbev/msu166. [DOI] [PMC free article] [PubMed] [Google Scholar]
- 20.Sankararaman S, et al. The genomic landscape of Neanderthal ancestry in present-day humans. Nature. 2014;507:354–357. doi: 10.1038/nature12961. [DOI] [PMC free article] [PubMed] [Google Scholar]
- 21.Pemberton TJ, et al. Genomic patterns of homozygosity in worldwide human populations. American journal of human genetics. 2012;91:275–292. doi: 10.1016/j.ajhg.2012.06.014. [DOI] [PMC free article] [PubMed] [Google Scholar]
- 22.Siepel A, et al. Evolutionarily conserved elements in vertebrate, insect, worm, and yeast genomes. Genome research. 2005;15:1034–1050. doi: 10.1101/gr.3715005. [DOI] [PMC free article] [PubMed] [Google Scholar]
- 23.Castellano S, et al. Patterns of coding variation in the complete exomes of three Neandertals. Proceedings of the National Academy of Sciences. 2014 doi: 10.1073/pnas.1405138111. [DOI] [PMC free article] [PubMed] [Google Scholar]
- 24.Hublin JJ. In: Neandertals and Modern Humans in Western Asia. Aoki K, Akazawa T, Bar-Yosef O, editors. Kluwer Academic Publishers; 1998. [Google Scholar]
- 25.Mercier NHV, Bar-Yosef O, Vandermeersch B, Stringer C, Joron J-L. Thermoluminescence Date for the Mousterian Burial Site of Es-Skhul, Mt. Carmel. Journal of Archaeological Science. 1993;20:169–174. [Google Scholar]
- 26.Grun R, et al. U-series and ESR analyses of bones and teeth relating to the human burials from Skhul. Journal of human evolution. 2005;49:316–334. doi: 10.1016/j.jhevol.2005.04.006. [DOI] [PubMed] [Google Scholar]
- 27.Armitage SJ, et al. The southern route “out of Africa”: evidence for an early expansion of modern humans into Arabia. Science. 2011;331:453–456. doi: 10.1126/science.1199113. [DOI] [PubMed] [Google Scholar]
- 28.Rose JIA, Marks AE. “Out of Arabia” and the Middle-Upper Palaeolithic transition in the southern Levant. Quartaer. 2014;61:49–85. [Google Scholar]
- 29.Liu W, et al. The earliest unequivocally modern humans in southern China. Nature. 2015 doi: 10.1038/nature15696. [DOI] [PubMed] [Google Scholar]
- 30.Rohland N, Hofreiter M. Comparison and optimization of ancient DNA extraction. BioTechniques. 2007;42:343–352. doi: 10.2144/000112383. [DOI] [PubMed] [Google Scholar]
- 31.Meyer M, Kircher M. Illumina sequencing library preparation for highly multiplexed target capture and sequencing. Cold Spring Harbor protocols. 2010;2010 doi: 10.1101/pdb.prot5448. pdb prot5448. [DOI] [PubMed] [Google Scholar]
- 32.Kircher M, Sawyer S, Meyer M. Double indexing overcomes inaccuracies in multiplex sequencing on the Illumina platform. Nucleic acids research. 2012;40:e3. doi: 10.1093/nar/gkr771. [DOI] [PMC free article] [PubMed] [Google Scholar]
- 33.Briggs AW, et al. Removal of deaminated cytosines and detection of in vivo methylation in ancient DNA. Nucleic acids research. 2010;38:e87. doi: 10.1093/nar/gkp1163. [DOI] [PMC free article] [PubMed] [Google Scholar]
- 34.Gnirke A, et al. Solution hybrid selection with ultra-long oligonucleotides for massively parallel targeted sequencing. Nature biotechnology. 2009;27:182–189. doi: 10.1038/nbt.1523. [DOI] [PMC free article] [PubMed] [Google Scholar]
- 35.McKenna A, et al. The Genome Analysis Toolkit: a MapReduce framework for analyzing next-generation DNA sequencing data. Genome research. 2010;20:1297–1303. doi: 10.1101/gr.107524.110. [DOI] [PMC free article] [PubMed] [Google Scholar]
- 36.Paten B, Herrero J, Beal K, Fitzgerald S, Birney E. Enredo and Pecan: genome-wide mammalian consistency-based multiple alignment with paralogs. Genome research. 2008;18:1814–1828. doi: 10.1101/gr.076554.108. gr.076554.108 [pii] [DOI] [PMC free article] [PubMed] [Google Scholar]
- 37.Hudson RR. Generating samples under a Wright-Fisher neutral model of genetic variation. Bioinformatics. 2002;18:337–338. doi: 10.1093/bioinformatics/18.2.337. [DOI] [PubMed] [Google Scholar]
- 38.Roach JC, et al. Analysis of genetic inheritance in a family quartet by whole-genome sequencing. Science. 2010;328:636–639. doi: 10.1126/science.1186802. [DOI] [PMC free article] [PubMed] [Google Scholar]
- 39.Fenner JN. Cross-cultural estimation of the human generation interval for use in genetics-based population divergence studies. American journal of physical anthropology. 2005;128:415–423. doi: 10.1002/ajpa.20188. [DOI] [PubMed] [Google Scholar]
- 40.Freedman AH, et al. Genome sequencing highlights the dynamic early history of dogs. PLoS genetics. 2014;10:e1004016. doi: 10.1371/journal.pgen.1004016. [DOI] [PMC free article] [PubMed] [Google Scholar]
- 41.Gravel S, et al. Demographic history and rare allele sharing among human populations. Proceedings of the National Academy of Sciences of the United States of America. 2011;108:11983–11988. doi: 10.1073/pnas.1019276108. [DOI] [PMC free article] [PubMed] [Google Scholar]
- 42.Prado-Martinez J, et al. Great ape genetic diversity and population history. Nature. 2013;499:471–475. doi: 10.1038/nature12228. [DOI] [PMC free article] [PubMed] [Google Scholar]
- 43.Durinck S, et al. BioMart and Bioconductor: a powerful link between biological databases and microarray data analysis. Bioinformatics (Oxford, England) 2005;21:3439–3440. doi: 10.1093/bioinformatics/bti525. [DOI] [PubMed] [Google Scholar]
- 44.Arbiza L, et al. Genome-wide inference of natural selection on human transcription factor binding sites. Nature genetics. 2013;45:723–729. doi: 10.1038/ng.2658. [DOI] [PMC free article] [PubMed] [Google Scholar]
Associated Data
This section collects any data citations, data availability statements, or supplementary materials included in this article.


