Abstract
Two-photon excitation spectroscopy is a powerful technique for the characterization of the optical properties of genetically encoded and synthetic fluorescent molecules. Excitation spectroscopy requires tuning the wavelength of the Ti:sapphire laser while carefully monitoring the delivered power. To assist laser tuning and the control of delivered power, we developed an Arduino Due based tool for the automatic acquisition of high quality spectra. This tool is portable, fast, affordable and precise. It allowed studying the impact of scattering and of blood absorption on two-photon excitation light. In this way, we determined the wavelength-dependent deformation of excitation spectra occurring in deep tissues in vivo.
OCIS codes: (110.0110) Imaging systems, (180.0180) Microscopy, (300.0300) Spectroscopy, (190.0190) Nonlinear optics, (110.0113) Imaging through turbid media
1. Introduction
Electronics and computer science are essential tools in neurobiology, biophysics and physiology. Frequently, experiments require customized hardware, since commercial tools are sometimes inappropriate or too expensive for a very specific experimental protocol. Thus, the “do it yourself” approach is becoming part of the know-how necessary for these interdisciplinary sciences.
Two-photon spectroscopy allows characterizing the optical properties of a fluorescent chromophore in vivo. This is a very useful technique when the optical properties of the fluorescent molecule are influenced by the cellular environment, thus reporting the physiological state of the cell. Since the emitted fluorescence depends on the square power of excitation, it is critical to deliver a known power at each wavelength during a spectroscopic scan. When spectra are obtained from biological samples the fast and accurate control of the wavelength and of the excitation intensity is especially critical. This is particularly true in in vivo experiments where large amount of statistically significant data should be collected within the shortest span of time, both because of good ethical conduct, and to reduce data variability.
Since tunable lasers have different yields at each wavelength and the delivered power could change slightly in different experiments, the power available on the optic bench has to be continuously regulated by a an intensity modulator based, e.g., on the combination of a Pockels cell and a polarizer, in order to keep it roughly constant on the whole spectrum.
Although it is possible to perform this procedure manually, this is time consuming, tedious and prone to errors.
Here we will describe a device based on an Arduino Due board specifically designed for the rapid and automatic control of both the excitation wavelength and power of a tunable Ti:sapphire laser (Chameleon Ultra2). We used this device to measure the excitation spectra of YFP recorded in vivo from transgenic mice.
These data allowed to study the effect of absorption and scattering on the two-photon excitation spectra in living tissues (acute brain slice and in vivo) [1,2].
2. Methods
2.1 Arduino Due system setup
Open-source platforms like Arduino are becoming more and more useful in both life sciences [3] and neuroscience [4–7], as well as in other research areas [8,9].
We used the single board microcontroller Arduino Due [10] to control our optical setup in order to obtain fast and accurate in vivo two-photon excitation spectra of Yellow Fluorescent Protein (YFP) expressed in the mouse brain.
In brief, the Arduino sets the working wavelength of the laser, measures the power output and generates the control signal for the Pockels cell in order to reach some pre-defined power target. Finally, when the power has reached the desired value, it commands the beginning of the data acquisition. This sequence is repeated for each wavelength, keeping the power constant, to finally get the excitation spectrum. To achieve this goal, we exploited its input/output signal channels to handle the interactions between the power meter, the Pockels cell, the tunable laser and the microscope. Figure 1(a) depicts how the Arduino Due microcontroller interacts with the components. The analog/digital converters (ADC) of the Arduino Due board were used to read the power meter and the mouse electrocardiogram (ECG). The Pockels cell (Conoptics model 302 RM) modulates the intensity of the laser beam. The intensity modulation obtained with a Pockels cell is based on the Pockels effect: in brief, the effect consists in a rotation of the polarization of a beam that traverses a crystal that lacks inversion symmetry and that it is immersed in an electric field. If the Pockels cell is followed by a polarizer, the electric field (in this case supplied by the unipolar signal from the Arduino Due) is converted to a rotation of the polarization plane and therefore to a modulation of the beam intensity at the exit of the polarizer.
Fig. 1.
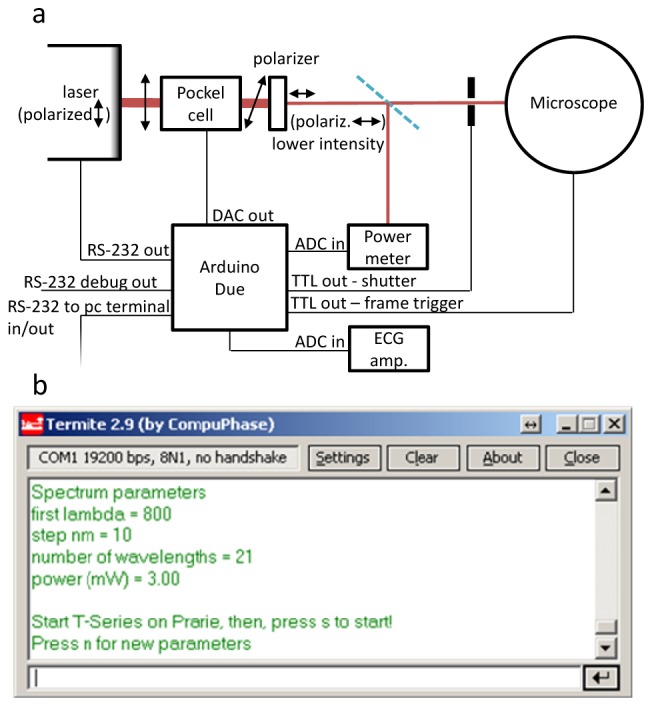
(a) A sketch of both analog and digital connections between the Arduino Due and the other devices of a typical two-photon microscope. Dark red lines represent the laser beam (with intensity roughly proportional to their thickness), and double arrow represents its polarization direction (with horizontal direction actually meaning out of plane polarization). (b) A screenshot of the RS-232 text-based user interface, in which the parameters (first wavelength, step, number of wavelengths in the spectrum, power of the laser beam) are passed to the Arduino Due.
The laser beam is partially reflected (10% reflection) by a semi-transparent mirror placed in the optic bench near the microscope entry port, and its power is measured by a power meter (Melles Griot 2-Watt Broadband Power/Energy Meter). Our controller operates along the following steps: 1) The Arduino Due reads the output voltage port of the power meter (which is proportional to the laser intensity) through its ADC input port and drives the voltage of the Pockels cell through its DAC output port. This feedback is iterated until the laser power reaches the power which has been set for imaging. 2) The Arduino opens a shutter at the entrance of the microscope for the time needed by the imaging process, while a TTL consensus signal is sent to the microscope to trigger the acquisition of one frame. The shutter prevents photobleaching of the sample before and after the acquisition of the image. 3) This sequence is repeated for each excitation wavelength, which is set through a serial link (RS-232) with the laser controller.
The software, as we show in Code 1, [11] is an Arduino sketch programmed in C++ and it runs entirely on the board. The parameters (starting wavelength, step in nm, number of points of the spectral scan, target power) are passed through a serial communication with the PC, using an RS-232 terminal (we used Termite [12], see Fig. 1(b)). The settings to be used for the serial monitor of the PC (e.g. Termite) are commented in the code. Since every RS-232 terminal can be used for this purpose, this tool is extremely portable. Another serial monitor has been used for debugging and for acquisition of the voltage ramp used to control the Pockels cell (see later section 2.2).
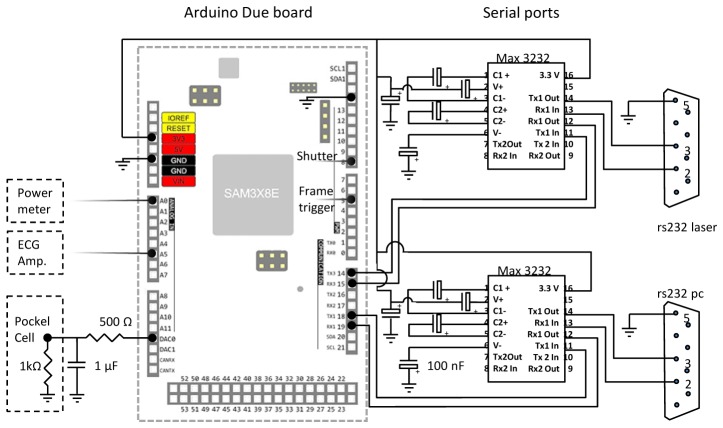
Figure 2 shows the layout of the Arduino board and the accessory circuitry. The scheme of the printable circuit board is available on fritzing.org [13]. The two serial communication ports have been implemented by using two MAX3232 ICs [14], which adapt the 0 V (0 value) / 3.3 V (1 value) to the RS-232 standard + 12 V (0 value) / −12 V (1 value), connected as shown in Fig. 2. We got the schematic from netbsd.org [15]. The voltage signal from the power meter (1 V for 30 mW full scale) is read by the ADC port (0 V - 3.3 V range) of the Arduino board. The DAC output port of the Arduino, which drives the voltage amplifier of the Pockels cell, is in the range 0.37 V - 3.3 V, due to the specs of the Atmel SAM3X8E ARM Cortex-M3 CPU embedded in Arduino Due. Since the input of the Pockels cell gets voltages in the range 0 V - 2.25 V, a resistor of 500Ω has been put at the DAC port, in order to build a 2:3 voltage divider with the 1kΩ input impedance of the Pockels cell. The signal at the Pockels cell input is therefore in the range 0.24 V - 2.2 V. We benefited of the built-in tunable bias of our Pockels cell controller to add −0.24 V to the incoming signal to set the final operation voltage in the range 0 V - 1.96V. Moreover, a low-pass filter has been added in order to have a constant intensity during the scanning process.
Fig. 2.
Electronic scheme of the digital connections between the Arduino Due and the RS-232 ports to pc and laser (pin 14-15-18-19 of the Arduino board), to the beam shutter (pin 8) and to the frame trigger of the microscope (pin 5). Analog ports are connected to the power meter (ADC 0) and to the Pockels cell (DAC 0). The latter uses a voltage divider and a low pass filter to avoid any damage on the Pockels cell electronics. All electrolytic capacitors connected to the Max 3232 ICs are 0.1 μF / 10V.
2.2 Spectroscopic imaging
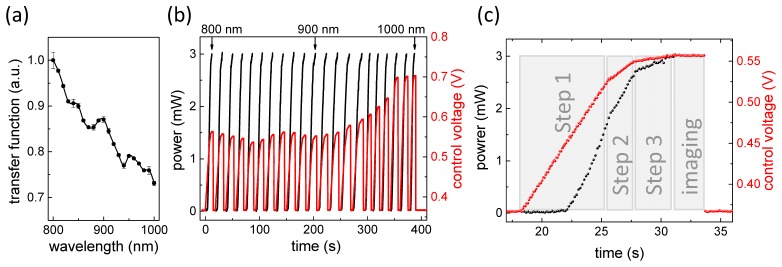
During a spectral scan the power delivered to the sample changes for two reasons: 1) the laser efficiency strongly depends on the tuning wavelength, and this is expecially true at long wavelength and, 2) the power transmitted by the microscope optics is also wavelength dependent. The power delivered by the laser at each wavelength can be easily monitored at the optic bench but it cannot be monitored at the sample during an in vivo experiment. Thus we must use a conversion function to compute the power delivered at the lens exit at each wavelength during the in vivo spectroscopic scans. This transfer function (an example is shown in Fig. 3(a)) is obtained by measuring the power at the lens exit when the power at optic bench is set constant. This transfer function allows to know the excitation intensity on the sample during the experiment, and to normalize the spectrum properly.
Fig. 3.
(a) Transfer function of the microscope. This function is proportional to the transmittance of the microscope optics. Data are obtained by measuring the intensity of the laser beam at the objective exit while the beam power on the optic bench downstream of the Pockels cell is kept constant. Data are normalized at 1 at 800 nm. (b) Time course of the measured laser beam power (left axis, black) and of the control voltage issued to the Pockels cell amplifier by the DAC port of the Arduino Due (right axis, red) in a typical 800 nm to 1000 nm spectrum, with a step size of 10 nm. Target power is fixed to 3 mW by the user, through the serial communication with the PC. The control voltage varies with the wavelength because of the laser cavity efficiency and the different Pockels cell response at different wavelengths. (c) Magnification of the first ramp of the data of panel a. This plot shows the 3 steps algorithm used to identify the correct setting for the Pockels cell control signal. The plot shows that the increment of control voltage (red data) decreases as the laser power converges to the target power (3mW). When the correct target power is reached, imaging is started.
A typical spectral scan includes a stacks of 21 images obtained at different excitation wavelengths from 800 nm to 1000 nm. The sequence of signals generated during a wavelength scan is shown in Fig. 3(b).
Every time a new wavelength is set, and the target power of 3 mW is reached, the Arduino triggers the acquisition of an image by the microscope. In order to reach the same target power at each different wavelength, the signal to be issued to the Pockels cell changes at each wavelength (see the right axis of Fig. 3(b)), due to the wavelength-dependent efficiency of the laser cavity. Figure 3(c) represents the first ramp at the wavelength of 800 nm, and shows how the control voltage is varied (red data points) in order to reach the target power (black data points). A 3-steps algorithm allows converging to the desired power rapidly and accurately. According to this algorithm, the ratio between the measured power and the target power is used to determine how much the voltage should be incremented on the following cycle in order to reach the target value efficiently without any overshoot. When the power differs from the desired power more than 40% the fastest speed is used. Otherwise, when the difference is within the 10% - 40% range, the speed is decreased to one fifth. Finally, if the power is very close to the target power (within 10%), the speed is further halved. The algorithm is further sped up at higher wavelengths (above 900 nm), due to the low power of the laser cavity which makes the Pockels cell work at higher voltages in which its gain is particularly low.
The total time spent for the spectrum acquisition is about 6 min, enough to acquire several spectra in one single in vivo experiment. The time limit in acquiring spectra is given by the stabilization of the laser cavity (which needs about 5 seconds each time the wavelength is changed), and by the power meter response time (which is in the order of 0.1 s). Hence further optimization of the algorithm (e.g. by storing the initial values of the control voltage at each wavelength from the previous spectrum) is not needed.
2.3 Heartbeat triggering
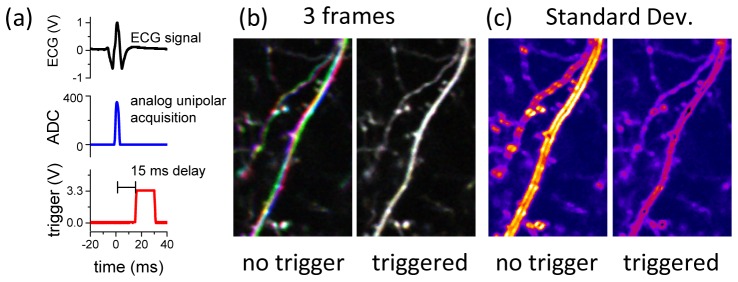
Mechanical artifacts have a tremendous impact on in vivo high resolution imaging [16]. Even imaging of the brain of an anesthetized mouse could be difficult due to the heartbeat that causes a periodic compression of the brain parenchima resulting in a rhythmic pulsation of the tissue that interfers with high resolution imaging. Although the drift in the x-y plane can be corrected by software, there is no room for any post-experimental software correction when the brain translates in the direction of the optical axis (z) or when the image is distorted. Imaging stability is notably improved when each image is triggered in phase with the heartbeat (see Fig. 4). To this effect, the ECG signal is digitized and analyzed in real time by the Arduino Due. Once the ECG peak is detected, a TTL trigger signal is issued to the microscope (Ultima, Prairie technologies) to start the acquisition.
Fig. 4.
(a) Complete ECG signal at the output of the amplifier (top panel) and after rectification (middle panel). The lower panel shows the TTL signal generated by the Arduino Due to trigger the acquisition on its rising edge. (b) Imaging in vivo of dendrites expressing YFP without and with the heartbeat triggering. Three consecutive frames have been represented with a red, a green and a blue lookup table, and then superimposed. (c) Standard deviation images calculated by a 20 frames-long continuous acquisition, without and with the heartbeat triggering.
The ECG signal was collected by means of metallic rings covered by an electroconductive gel connected to the forelimbs of the mouse. After amplification (EXT-02F npi electronic GmbH), the rectified ECG signal was acquired by the Arduino Due that responds by generating the TTL signal that triggers image acquisition (see Fig. 4(a)). This trick was used to improve the mechanical stability of imaging. As an example, three consecutive frames of YFP expressing dendrites in vivo are shown with different colors (red, green and blue respectively, then merged) in Fig. 4(b). During free running acquisition, the pulsation artifact affected different portions of the image depending on the relative timing of the heartbeat and of the scanning process (left panel). Since the frame rate was less than the heartbeat rate, each frame was affected by several heartbeats artifacts. As the heartbeat trigger was switched on, each frame was started in phase with the heartbeat, and the distortion caused by the beat always occurs in the same portion of the image. Thus, as shown in the right panels, the time lapse sequence is more reproducible. The reduction of the mechanical artifacts provided by heartbeat triggering is rather remarkable, as shown by the standard deviation map of 20 consecutive images (see Fig. 4(c)).
2.4 In vivo surgery and acute slice preparation
Two-photon imaging was performed on homozygous Thy1-YFP transgenic mice on C57Bl/6J background (B6.Cg-Tg(Thy1-YFP)HJrs/J line). Once the mouse was anesthetized with 20% urethane i.p. (ethyl carbamate; Sigma) in saline solution (0.8 ml/hg), its head was fixed and a craniotomy of 2–3 mm in diameter was drilled over the somatosensory cortex (3–4 mm from the midline) and the dura was removed. Mice were then mounted under the microscope lens by means of a support glued to the skull, with the cortical surface perpendicular to the optical axis. In vivo imaging was restricted to the apical dendrites in cortical layers 2-3 of the neurons having their soma in layer 5. The mean fluorescence values have been obtained by using a mask able to select only dendrites.
At the end of the in vivo imaging session, mice were sacrificed by cervical dislocation and the brain was extracted and sectioned with a vibratome in cold (4 °C) cutting solution containing 120 mM NaCl, 2.5 mM KCl, 0.5 mM CaCl2, 2 mM MgCl2, 1 mM NaH2PO4, 26 mM NaHCO3, 2.5 mM MgSO4, 10 mM glucose, 0.57 mM ascorbic acid, 2 mM Na pyruvate and 2 mM kynurenic acid. Coronal slices (350 μm thick) were allowed to recover in oxygenated cutting solution without kynurenic acid and with 1 mM CaCl2 for 15 min. In vitro imaging was performed on slices perfused in oxygenated (95% O2, 5% CO2) and heated (34°C) recording medium (120 mM NaCl, 2.5 mM KCl, 2 mM CaCl2, 1 mM MgCl2, 1 mM NaH2PO4, 26 mM NaHCO3, 10 mM glucose). All procedures were approved by and carried out according to the Italian Health Institute and their guidelines.
2.5 Cell culture and transfection
HEK 293 cells, from American Type Culture Collection (WSS-1 cells 21) were grown in Dulbecco’s modified Eagle’s medium (Gibco) and supplemented with 10% FBS (Gibco), 1 mM sodium pyruvate, 2 mM L-glutamine and 10 μg l−1 penicillin-streptomycin. Subconfluent cells were plated in polylysine (Sigma)-coated 35-mm diameter coverglasses (WillCo-dish) and transfected with pcDNA3-YFP plasmid using Effectene reagent (Qiagen) following the manufacturer’s protocol. Cells were maintained in a 5% CO2 atmosphere at 37 °C and were imaged 2 days after transfection. Spectra of both HEK 293 and of neurons in acute slice have been obtained as follows: the mean value for each cell was measured at each wavelength, and then each spectrum was normalized onto its integral. Nine spectra of HEK cells and 6 spectra of neurons in acute slice were averaged.
2.6 Image settings
Images were acquired with a water immersion objective (Olympus LUMPLFLN, 60x, numerical aperture: 1.0) at a resolution of 512 x 512 pixels at zoom 2, leading to a field of 102 x 102 µm and a nominal linear sampling of 0.2 µm per pixel. The intensity of each pixel was corrected by subtracting the mean value of background measured when the beam shutter was closed, and dividing each pixel for its illumination / detection efficiency profile obtained by imaging a broadband-emitting and homogenous dye (rhodamine 6g).
3. Results and discussion
Different components in the brain, such as blood and extracellular matrix, can alter the spectral composition of the light that propagates through. These effects are likely to impact differently imaging in vivo or in slices, given the different state of perfusion of the two preparations. In order to analyze this issue, we measured the spectra of YFP protein in tissue and in cultured cells. First, we measured the two-photon excitation spectra of YFP in a single layer of HEK 293 cells. Since in this case the cells are separated from the objective only by saline solution, the excitation path is not affected by scattering. We performed the same measurements in vivo and in brain slices from the visual cortex of mice expressing YFP.
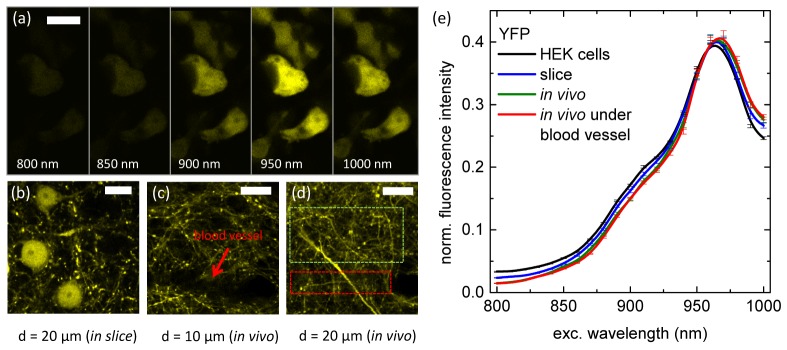
Five of the 21 frames of the whole spectrum of HEK 293 cells are shown in Fig. 5(a). Three YFP expressing neurons of the layer 5 in acute slice are shown in Fig. 5(b). Imaging in slice was performed 20 µm below the section surface. In vivo imaging of the apical dendrites of the neurons of layer 5 at a depth of 10 µm under the surface of the cortex is shown in Fig. 5(c). The dark area in the bottom part of Fig. 5(c) is due to a small blood vessel. Imaging of the apical dendrites under the region imaged in Fig. 5(c) is shown in Fig. 5(d), at a depth of 20 µm from the surface. The red and the green rectangles represent respectively the area directly below the blood vessel and the area not covered by that vessel.
Fig. 5.
(a) Two-photon images of YFP expressing HEK 293 cells at different excitation wavelengths and at fixed excitation power (3mW). Only 5 of the 21 images of the whole spectrum are shown. (b) two-photon microscopy of layer-5 neurons excited at 960 nm. Imaging is performed in acute slice at a depth of 20 µm from the slice surface. (c) In vivo two-photon microscopy of dendrites in layers 2-3 of the somatosensory cortex. Imaging was performed 10 µm under the surface. The dark areas are indicative of superficial blood vessels. (d) Imaging in a region immediately under that vessel, at a depth of 20 µm. The red rectangle indicates the area immediately underneath the blood vessel. (e) two-photon excitation spectra of YFP expressed in HEK 293 cells (black), in layer-5 neurons in slice (blue), and in vivo (layers 2-3) under a blood vessel (red) and far from it (green). The last two spectra (the red one and the green one) are subtly different (see Fig. 6(a)), the red spectrum superimposes partially onto the green one. Scale bars: 20 µm.
The spectra of these areas have been collected and are shown in green and red respectively in Fig. 5(e), together with the spectrum collected from HEK 293 (in black) that provides the spectral reference obtained in absence of scattering and absorption. The error bars of Fig. 5(e) represent standard errors. The in vivo spectra and their standard errors were obtained by measuring the average fluorescence of the dendrites by repeating the stack acquisition 3 times.
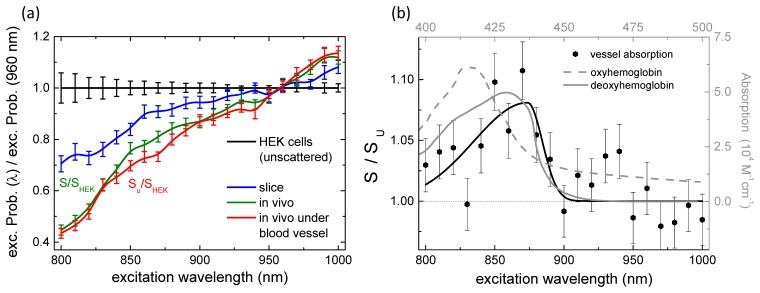
Interestingly, the spectra obtained in the various conditions are subtly but significantly different. To better appreciate the discrepancy, Fig. 6(a) shows the ratio of each spectrum with the zero scattering one obtained from HEK 293 cells. These data suggest that this divergence, which is wavelength dependent, is due to both scattering and absorption phenomena, which occur in the tissues traveled by the laser beam. The higher the amount of scattering and absorption, the lower is the two-photon excitation. Indeed, scattering is higher at lower wavelengths, scaling as λ−4, and this seems to be the major responsible for the overall behavior of the monotone wavelength-dependant spectra deformation. Details of these curves are probably given by absorption of different tissues and fluids. We can exclude that this is only due to blood absorption, since it is observed, even if at a smaller degree, also in acute slice: here blood is not present and scattering is anyway expected to be lower.
Fig. 6.
(a) Scaling of probability for two-photon excitation in scattering tissue as a function of wavelength, i.e. in slice (blue), in vivo under a blood vessel (red) and far from it (green). Data are obtained by dividing each YFP excitation spectrum by the reference spectrum obtained in scattering-free conditions (HEK 293), and by normalizing at 1 at 960nm. (b) Ratio between the in vivo YFP two-photon excitation spectra obtained far from the blood vessel (S) or directly underneath (Su). The error bars come from standard error propagation. This spectrum deformation is interpreted as caused by absorption phenomena and has been compared to the one-photon absorption of oxyhemoglobin (dashed gray line) and deoxyhemoglobin (solid grey line) peaked around 430 nm (top-right axes) (reproduced from Clay et al., 2007).
In particular, the small differences between the red and green curves of Fig. 5(e) and 6(a) in the range 800-900 nm could be caused by absorption by blood, since they are acquired below a blood vessel and in a nearby region not affected by it (see Fig. 5(d), red and green rectangles respectively). The ratio between these curves S and Su is shown in Fig. 6(b). This can be interpreted as linked to the absorption spectrum of the vessel shown in Fig. 5(c). The peak around 860 nm has been compared with the absorption of oxyhemoglobin and deoxyhemoglobin at half wavelength [17,18] (Fig. 6(b)). We can notice how the observed absorption is compatible with a contribution from deoxyhemoglobin.
4. Conclusion
Different fluorescence based sensors which are ratiometric in excitation [19–24] are usually calibrated in scattering free conditions, such as in cultured cells or in FPLC purified protein and then they are used for in vivo or in slice measurements [23–25]. However, we have shown that the full characterization of the two-photon excitation spectra reveals a strong impact of the brain tissue on the light propagation. By developing a portable tool that easily allows getting excitation spectra in vivo, we demonstrated that tissues have a considerable impact on two-photon excitation spectra. This finding, and the tool we developed, can potentially impact in vivo measures requiring the determination of fluorescence yields or of any spectral changes of a fluorophore.
Acknowledgments
The study was supported by Telethon grants GGP13187 and GGP12265 to Gian Michele Ratto, by the flagship project NanoMax (Nanobrain), and by PRIN 2009XPTWM2 to Stefano Luin.
References and links
- 1.Tuchin V., “Light scattering study of tissues,” Phys. Uspekhi 40(5), 495–515 (1997). 10.1070/PU1997v040n05ABEH000236 [DOI] [Google Scholar]
- 2.Jacques S. L., “Optical properties of biological tissues: a review,” Phys. Med. Biol. 58(11), R37–R61 (2013). 10.1088/0031-9155/58/11/R37 [DOI] [PubMed] [Google Scholar]
- 3.Kornuta J. A., Nipper M. E., Dixon J. B., “Low-cost microcontroller platform for studying lymphatic biomechanics in vitro,” J. Biomech. 46(1), 183–186 (2013). 10.1016/j.jbiomech.2012.09.031 [DOI] [PMC free article] [PubMed] [Google Scholar]
- 4.Pineño O., “ArduiPod Box: a low-cost and open-source Skinner box using an iPod Touch and an Arduino microcontroller,” Behav. Res. Methods 46(1), 196–205 (2014). 10.3758/s13428-013-0367-5 [DOI] [PubMed] [Google Scholar]
- 5.Schubert T. W., D’Ausilio A., Canto R., “Using Arduino microcontroller boards to measure response latencies,” Behav. Res. Methods 45(4), 1332–1346 (2013). 10.3758/s13428-013-0336-z [DOI] [PubMed] [Google Scholar]
- 6.Teikari P., Najjar R. P., Malkki H., Knoblauch K., Dumortier D., Gronfier C., Cooper H. M., “An inexpensive Arduino-based LED stimulator system for vision research,” J. Neurosci. Methods 211(2), 227–236 (2012). 10.1016/j.jneumeth.2012.09.012 [DOI] [PubMed] [Google Scholar]
- 7.Sheinin A., Lavi A., Michaelevski I., “StimDuino: An Arduino-based electrophysiological stimulus isolator,” J. Neurosci. Methods 243, 8–17 (2015). 10.1016/j.jneumeth.2015.01.016 [DOI] [PubMed] [Google Scholar]
- 8.D’Ausilio A., “Arduino: a low-cost multipurpose lab equipment,” Behav. Res. Methods 44(2), 305–313 (2012). 10.3758/s13428-011-0163-z [DOI] [PubMed] [Google Scholar]
- 9.Alves A., Silva H., Lourenc A., Fried A., “BITalino: a biosignal acquisition system based on Arduino,” Proceeding of the 6th Conference on Biometical Electronicsand Devices (BIODEVICES) (2013). [Google Scholar]
- 10. http://www.arduino.cc
- 11.P. Artoni, “Spectrumino: an Arduino Due based tool for spectroscopy,” Github (2016) [Retrieved 12 January 2016] https://gist.github.com/pietroartoni/
- 12. http://www.compuphase.com/software_termite.htm
- 13. http://fritzing.org/projects/spectrumino
- 14. http://pdfserv.maximintegrated.com/en/ds/MAX3222-MAX3241.pdf
- 15. http://www.netbsd.org/ports/sandpoint/ttl2rs232.html
- 16.Vinegoni C., Lee S., Aguirre A. D., Weissleder R., “New techniques for motion-artifact-free in vivo cardiac microscopy,” Front. Physiol. 6, 147 (2015). 10.3389/fphys.2015.00147 [DOI] [PMC free article] [PubMed] [Google Scholar]
- 17.Clay G. O., Millard A. C., Schaffer C. B., Aus-der-Au J., Tsai P. S., Squier J. A., Kleinfeld D., “Spectroscopy of third-harmonic generation: evidence for resonances in model compounds and ligated hemoglobin,” J. Opt. Soc. Am. B 23(5), 932–950 (2006). 10.1364/JOSAB.23.000932 [DOI] [Google Scholar]
- 18.Clay G. O., Schaffer C. B., Kleinfeld D., “Large two-photon absorptivity of hemoglobin in the infrared range of 780-880 nm,” J. Chem. Phys. 126(2), 025102 (2007). 10.1063/1.2404678 [DOI] [PubMed] [Google Scholar]
- 19.Bizzarri R., Arcangeli C., Arosio D., Ricci F., Faraci P., Cardarelli F., Beltram F., “Development of a novel GFP-based ratiometric excitation and emission pH indicator for intracellular studies,” Biophys. J. 90(9), 3300–3314 (2006). 10.1529/biophysj.105.074708 [DOI] [PMC free article] [PubMed] [Google Scholar]
- 20.Bizzarri R., Serresi M., Luin S., Beltram F., “Green fluorescent protein based pH indicators for in vivo use: a review,” Anal. Bioanal. Chem. 393(4), 1107–1122 (2009). 10.1007/s00216-008-2515-9 [DOI] [PubMed] [Google Scholar]
- 21.Liu Z., Zhang C., Chen Y., He W., Guo Z., “An excitation ratiometric Zn2+ sensor with mitochondria-targetability for monitoring of mitochondrial Zn2+ release upon different stimulations,” Chem. Commun. (Camb.) 48(67), 8365–8367 (2012). 10.1039/c2cc33648k [DOI] [PubMed] [Google Scholar]
- 22.Wokosin D. L., Loughrey C. M., Smith G. L., “Characterization of a range of fura dyes with two-photon excitation,” Biophys. J. 86(3), 1726–1738 (2004). 10.1016/S0006-3495(04)74241-1 [DOI] [PMC free article] [PubMed] [Google Scholar]
- 23.Zhu A., Ding C., Tian Y., “A two-photon ratiometric fluorescence probe for Cupric Ions in Live Cells and Tissues,” Sci. Rep. 3, 2933 (2013). 10.1038/srep02933 [DOI] [PMC free article] [PubMed] [Google Scholar]
- 24.Raimondo J. V., Joyce B., Kay L., Schlagheck T., Newey S. E., Srinivas S., Akerman C. J., “A genetically-encoded chloride and pH sensor for dissociating ion dynamics in the nervous system,” Front. Cell. Neurosci. 7, 202 (2013). 10.3389/fncel.2013.00202 [DOI] [PMC free article] [PubMed] [Google Scholar]
- 25.Baek N. Y., Heo C. H., Lim C. S., Masanta G., Cho B. R., Kim H. M., “A highly sensitive two-photon fluorescent probe for mitochondrial zinc ions in living tissue,” Chem. Commun. (Camb.) 48(38), 4546–4548 (2012). 10.1039/c2cc31077e [DOI] [PubMed] [Google Scholar]


