Abstract
The suprachiasmatic nucleus (SCN) is the locus of the master circadian clock, setting the daily rhythms in physiology and behavior and synchronizing these responses to the local environment. The most important of these phase-setting cues derive from the light-dark cycle and reach the SCN directly via the retinohypothalamic tract (RHT). The SCN contains anatomically and functionally heterogeneous populations of cells. Understanding how these neurons access information about the photic environment so as to set the phase of daily oscillation requires knowledge of SCN innervation by the RHT. While retinal innervation of the SCN has long been a topic of interest, the information is incomplete. In some instances, studies have focused on the caudal aspect of the nucleus, which contains the core region. In other instances, subregions of the nucleus have been delineated based on projections of where specific peptidergic cell types lie, rather than based on double or triple immunochemical staining of distinct populations of cells. Here, we examine the full extent of the mouse SCN using cholera toxin β (CTβ) as a tracer to analyze RHT innervation in triple-labeled sagittal sections. Using specific peptidergic markers to identify clusters of SCN cells, we find 3 distinct patterns. First is an area of dense RHT innervation to the core region, delineated by gastrin-releasing peptide (GRP) and vasoactive intestinal peptide (VIP) immunoreactive cells. Second is an area of moderate RHT fiber clusters, bearing arginine-vasopressin (AVP)–positive cells that lie close to the core. Finally, the outermost, shell, and rostral AVP-containing regions of the SCN have few to no detectable retinal fibers. These results point to a diversity of inputs to individual SCN cell populations and suggest variation in the responses that underlie photic phase resetting.
Keywords: SCN, suprachiasmatic nucleus, retinohypothalamic tract, retina, circadian rhythms
The suprachiasmatic nucleus (SCN) is the locus of the brain’s master circadian clock, serving to set the phase of both physiological and behavioral circadian rhythms throughout the body (Antle and Silver, 2005; Mohawk et al., 2012). Located in the anterior hypothalamus, this bilateral nucleus consists of ~20,000 peptidergically diverse cells, localized in distinct clusters through its spatial extent. Light is the most salient signal to set the phase of biological rhythms, and the SCN receives photic input directly via the retinohypothalamic tract (RHT) (Hendrickson et al., 1972; Moore and Lenn, 1972). Characterizing retinal input to the SCN is therefore key to understanding mechanisms of entrainment and resetting of circadian rhythms by light. Such information is also important for the understanding of the functional connectome of the SCN.
Retinal innervation of the mammalian SCN, including that of the mouse, has been extensively investigated, with some inconsistencies among reports (reviewed in Morin and Allen, 2006). Of specific interest in many studies has been the density of RHT input to the 2 broad functional domains of the SCN—the “core” inner aspect of the SCN, lying closest to the optic chiasm and characterized by the presence of vasoactive intestinal peptide (VIP) and gastrin-releasing peptide (GRP)–containing cells in the mouse, and the “shell” outer aspect of the nucleus, characterized by the presence of arginine-vasopressin (AVP)–containing cells (Miller et al., 1996; Abrahamson and Moore, 2001). At issue is whether RHT projections are largely constrained to the core region, whether they also reach other regions of the nucleus, and the relative density of fibers in each of these areas.
Initial reports using autoradiography to trace RHT projections indicated innervation of the entire nucleus (Cassone et al., 1988). However, later studies using cholera toxin β (CTβ) to trace retinal input to the SCN came to varying conclusions. Abrahamson and Moore (2001) examined RHT innervation of the hypothalamus, including the SCN, in sample coronal sections in the rostral, mid, and caudal regions of the mouse SCN, using CTβ for tract tracing. Overall, the results indicated that the RHT projects predominantly to the SCN core and that the medial and dorsomedial shell are almost devoid of fibers. More specifically, they note that in the rostral third of the SCN, RHT fibers are located primarily ventrally. In the middle third of the SCN, the dorsomedial and far ventrolateral regions (shell) are devoid of CTβ-labeled fibers. In the caudal third of the nucleus, labeled fibers are in the core. In this carefully documented work, the delineation of core and shell areas was achieved in Nissl-stained sections: immunocytochemical peptidergic staining was performed in a different series of sections than those used for tract tracing, and therefore identification of associations with specific regional cell clusters was not attempted. Morin and colleagues (2006) examined RHT using triple-label immunocytochemistry (ICC) with 2 fluorophores for CTβ tract tracing to assess the contribution from each eye, as well as Nissl staining or AVP immunoreactivity (ir) to delineate SCN. These authors note that the densest region of innervation is the ventrolateral SCN, with some innervation throughout the entire nucleus. They used a semi-quantitative method to evaluate the density of ipsi- and contralateral retinal terminal fields in various parts of the SCN. Here, both coronal and horizontal sections point to the presence of a dense terminal sector in the ventrolateral SCN and sparse RHT terminals near the midline and dorsomedially adjacent to the third ventricle, evident at all SCN levels. In this detailed study, RHT afferents in the rostral-most region of the SCN (see Figure 1 in Abrahamson and Moore, 2001) were not discussed. In a third study, the question of RHT input to the hypothalamus was further addressed using transgenic mice to label afferents arising mainly from the M1 intrinsically photosensitive retinal ganglion cells (ipRGCs) (Hattar et al., 2006; Ecker et al., 2010). Here the goal was to identify even very weak projections of the ipRGCs, so that brain areas known to have dense RHT projections, such as the SCN, appeared very dark and overstained, thereby masking possible regional differences in density. In addition, the alkaline phosphatase reporter and the colorimetric histochemical method used in this work produce a reaction product that diffuses away from the cellular elements that actually contain the enzyme, again exaggerating the area of staining.
With regard to SCN innervation by the RHT, several questions remain unanswered. RHT innervation from the full rostral to caudal extremes of the SCN has yet to be examined, as previous reports generally neglect the rostral-most (and, sometimes, the caudal-most) aspects of the nucleus. In addition, delineation of peptides characteristic of SCN subregions using double- or triple-label protocols is required to ascertain the extent of retinal innervation of specific clusters of peptidergic cells. To assess RHT projections along the full rostro-caudal extent of the SCN and to delineate input to distinct SCN subregions, we examined the entire extent of the SCN in sagittal sections, using CTβ tract tracing following monocular or binocular injection. Either GRP neurons (identified by green fluorescent protein immunoreactivity (GFP-ir), as in Karatsoreos et al., 2004) or VIP-ir neurons were used to delineate the core SCN, and AVP delineated the shell and marked the dorsal borders of the nucleus. In addition, PERIOD2 protein (PER2) was used as a second marker of the full extent of the SCN.
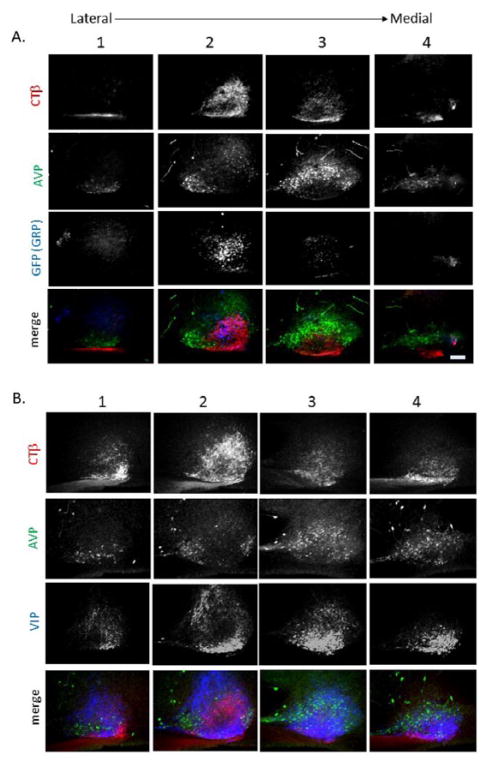
In sagittal sections, the main body of each SCN nucleus is ovoid and ~350 μm dorso-ventral × 600 μm rostro-caudal × 350 μm midline-lateral. In addition, each nucleus has a rostral, fingerlike projection measuring ~150 to 200 μm (Abrahamson and Moore, 2001). In sagittal sections, the core region is labeled by VIP- and GRP-containing cells (Figure 1A, columns 2 and 3) as was previously described in coronal sections (Karatsoreos et al., 2004). Evaluation of the distribution of CTβ-labeled RHT fibers in relation to AVP and green fluorescent protein or VIP cells in sagittal sections indicates marked regional variations in RHT fiber density through the extent of the SCN (Figure 1). Supplemental Figure S1 shows the SCN on both sides of the brain in the animal shown in Figure 1A, providing a view of the variation due to the precise location of the cut in sectioning the tissue.
Figure 1.
Photomicrographs show SCN in triple-labeled, alternate sagittal sections proceeding from the lateral (column 1) through the medial (column 4) extent of the nucleus. In 1 animal, injected bilaterally (A), sections were stained for cholera toxin β (CTβ) to reveal retinohypothalamic tract (RHT) fibers (top row), arginine-vasopressin (AVP) to delineate the shell (second row), and green fluorescent protein (GFP) to indicate the core (third row). To show the relationships among these, the images were merged (bottom row). In a second animal, injected unilaterally (B), vasoactive intestinal peptide (VIP) (third row) was used to delineate the core, while the remaining labels were as in (A). Scale bar = 100 μm.
In the sagittal sections, at the lateral-most extreme of the SCN, delineated by AVP-ir neurons and devoid of GFP-ir neurons, RHT innervation is extremely sparse (Figure 1A, column 1). More medially, dense RHT innervation is observed over a great extent of the SCN, within the GFP-ir core (Figure 1A, column 2). Also, some RHT projections are seen in the inner ring of AVP-ir cells in the shell but are largely absent from the rostral area and outer ring of AVP-ir cells. More medially (Figure 1A, column 3), retinal fibers are lacking in the rostral fingerlike extension and in the outer ring of AVP cells in the rostral, dorsal, and caudal extremes of the main body of the nucleus. Finally, close to the midline, AVP-ir neurons lie below the third ventricle, but this SCN area lacks any RHT fibers (Figure 1A, column 4). Note that in this figure, our transgenic mouse (in which GFP was the marker for GRP-containing cells) provided the advantage of allowing visualization of cell bodies that are otherwise obscured by extensively arborizing GRP-ir fibers (Karatsoreos et al., 2004).
Figure 1B differs from Figure 1A in that VIP, rather than GFP, is used as a marker for the core. The sections in Figure 1B lie somewhat medial to those in Figure 1A but demonstrate the same general pattern of RHT fiber distribution. Of note, in the lateral SCN (Figure 1B, column 2), RHT fibers are coextensive with the ventral strip of VIP neurons. Here, extensive VIP fibers extend dorsally but avoid the central area where GRP cells lie (Karatsoreos et al., 2004). In the medial SCN, VIP cells and their processes overlap with regions of RHT innervation within the SCN core. The AVP-ir rostral SCN area and its fingerlike extension can be seen (in Figure 1B, column 3, row 2). There are no detectable CTβ fibers in this rostral-most region.
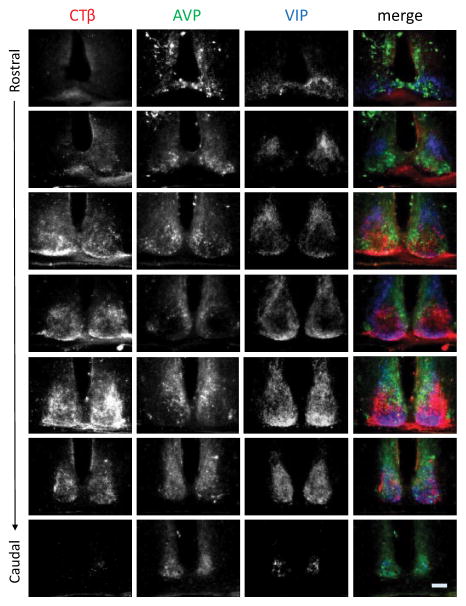
To relate the above results to the more commonly studied coronal views of the SCN, we present a rostral-to-caudal series of coronal sections stained for CTβ, AVP, and VIP (Figure 2). Both the extreme rostral and caudal AVP populations lack RHT innervation as visualized by CTβ, when observed in the coronal plane (rows 1, 2, and 7). The core area (defined by absence of AVP and/or presence of VIP cells) occupies the mid-SCN (rows 3–6) and courses from the middle to the lateral edge of the nucleus (Yan and Silver, 2002).
Figure 2.
Photomicrographs show triple-labeled SCN in alternate coronal sections from the rostral (top row) through the caudal-most (bottom row) extent of the nucleus of a representative animal injected unilaterally with cholera toxin β (CTβ) and stained for CTβ, arginine-vasopressin (AVP), and VIP. The merged images are shown in the 4th column. Scale bar =100μm.
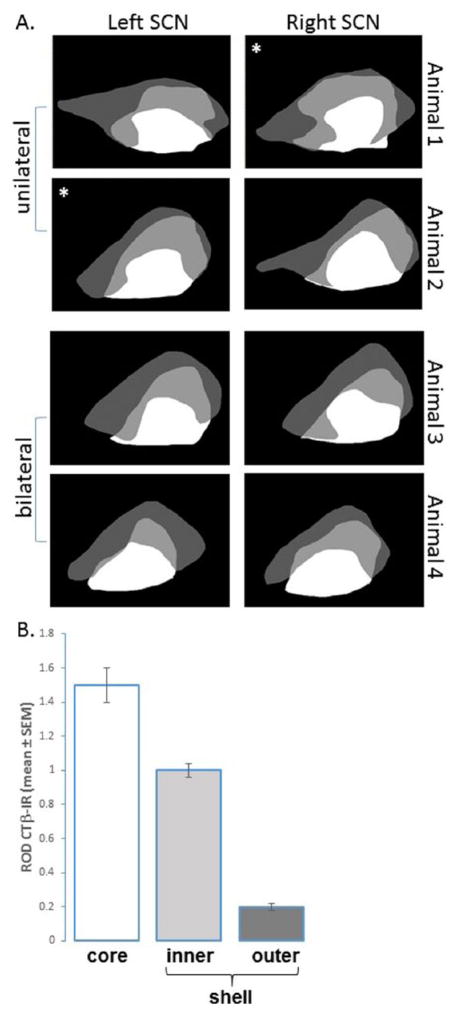
The specialized organization described above is consistent among animals and is shown in schematics for AVP-ir neurons and RHT projections in the SCN from 4 mice, representative of the 7 animals examined in the sagittal view (Figure 3A). The schematics are based on sections with the AVP cell populations corresponding to Figure 1A and B, columns 2 and 3, respectively. The small differences seen between sections may be due to interanimal variations (Figure 1A vs. Figure 1B) or to slight differences in sectioning (Suppl. Figure S1).
Figure 3.
(A) Schematic of sagittal sections through the SCN showing distribution of cholera toxin β (CTβ) stained retinohypothalamic tract (RHT) fibers and arginine-vasopressin (AVP)–immunoreactive (ir) neurons in 4 representative animals (2 bilaterally and 2 unilaterally injected intraocularly with CTβ). Areas of CTβ staining lacking AVP are in white, those with overlapping CTβ fibers and AVP neurons are in light gray, and those bearing AVP but lacking CTβ fibers are in dark gray. In unilaterally CTβ injected animals, the asterisk marks the side injected. (B) Bar graph shows the quantification of CTβ staining in the SCN in the core, inner shell, and outer shell.
Figure 3B provides a quantitative assessment of the relative optical density of CTβ-labeled RHT fibers in these 3 SCN regions. As there were no differences in RHT distribution between unilaterally and bilaterally injected animals (as previously reported in Abrahamson and Moore, 2001; Morin et al., 2006), the data presented in Figure 3 were combined in the analysis of RHT density. The results indicate that the core region has dense retinal fiber staining; an inner ring of AVP-ir neurons lies within a region of less dense retinal fibers, while an outer ring of AVP cells includes very few detectable RHT fibers.
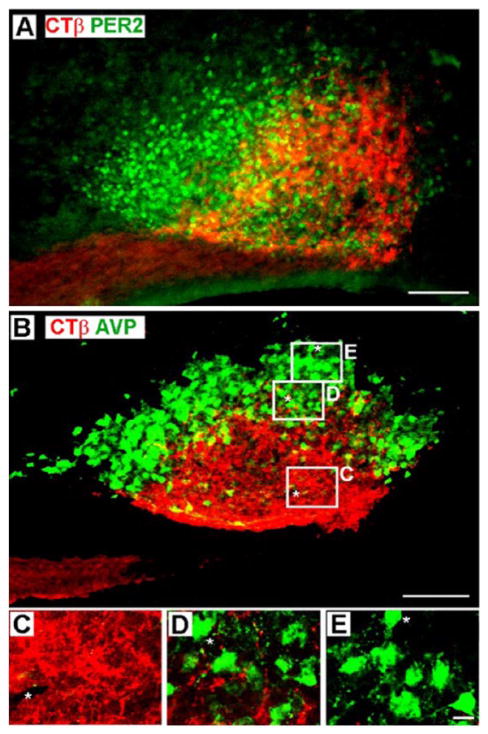
To confirm the outer boundaries of the SCN in sagittal sections, we examined CTβ staining in sections labeled with PER2 (Figure 4A). The results confirm the general pattern described in sections labeled with AVP (Figure 4B and Figure 1), in which there are dense RHT fibers in the core, an inner ring where PER2 and CTβ overlap, and an outer ring where PER2 but no CTβ is detected. In addition, one can detect an area of less dense RHT fibers in the central core area, as previously reported (Morin et al., 2006).
Figure 4.
(A) Epifluorescence photomicrograph of the SCN of an animal injected unilaterally in the eye with cholera toxin β (CTβ). Here, the extent of the nucleus is revealed by using PERIOD2 (PER2) staining, while arginine-vasopressin (AVP) was used for this purpose in comparable sections shown in Figure 1 and below. (B) Confocal photomicrographs show CTβ-labeled retinohypothalamic tract (RHT) fibers in a sagittal SCN section using AVP-ir cells to delineate the shell. The white boxes in this figure show the location of confocal scans presented below at higher magnification and reveal the pattern of RHT arborization in the core (C), inner shell (D), and outer shell (E). For orientation, landmarks for each image are indicated by an asterisk. (A) Scale bar = 100 μm; section thickness = 50 μm. (B) Scale bar = 100 μm; z-axis = 5 μm. (C, D, E) Scale bar = 10 μm; z-axis = 1 μm.
To evaluate distribution of RHT fibers at higher resolution, we examined fiber density in the core area and in the inner and outer ring of AVP cells in the SCN in confocal scans (Figure 4B–E). The results show dense fiber arborization in the core (C), sparse arborization in the inner ring (D), and no detectable fibers in the outer ring of AVP-positive cells (E).
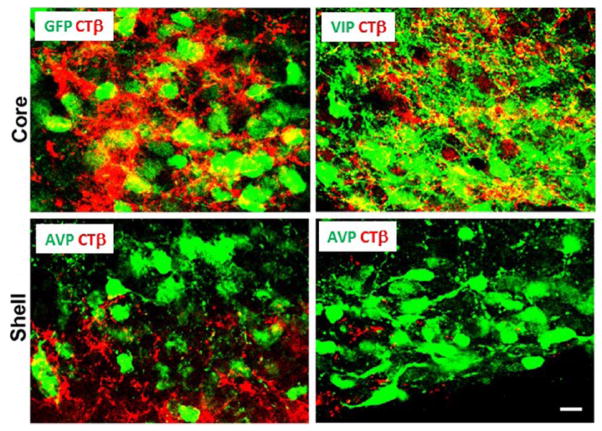
To evaluate distribution of RHT appositions in relation to AVP, VIP, and GFP-ir neurons, we used confocal microscopy (Figure 5). The results show that RHT fibers make many appositions with GFP cells (left top panel) and VIP cells and fibers (right top panel) in the SCN core. In contrast, few appositions are seen on AVP cell bodies in the inner ring of AVP cells (left bottom panel) and none in the outer ring (right bottom panel).
Figure 5.
Confocal photomicrographs show appositions of retinohypothalamic tract (RHT) fibers onto green fluorescent protein (GFP), vasoactive intestinal peptide (VIP), and arginine-vasopressin (AVP)–containing neurons in the SCN. The upper panels show sections stained for cholera toxin β (CTβ) fibers and either GFP or VIP cells lying in the core. The lower panels show AVP cells lying in the inner (left) and outer (right) shell. Scale bar = 10 μm; z-axis = 1 μm. Yellow areas represent the overlap of RHT fibers (red) and peptidergic neurons (green), indicating RHT appositions onto the peptidergic cells and fibers.
The present study revisited the question of density of RHT fibers in the SCN using triple-label immunochemistry in sagittal sections. The protocol used enabled visualization of fibers through the entire nucleus and facilitated visualization of distinct subregions by using AVP or PER2 as markers for the shell, as well as VIP or GFP as markers for the core following injection of CTβ into the eye. The findings support the view that the retinal innervation of the SCN is not homogeneous (Morin, 2013) and contribute to the understanding of the regional distribution of RHT fibers to the SCN in relation to specific peptidergic cell types. Specifically, the greatest density of RHT fibers lies in the GFP/VIP-delineated core, and even this area contains a relatively sparser zone in its center. The shell area, defined by AVP cells, has an inner ring of sparse RHT fibers of lesser density than that of the core and an outer ring of cells where RHT fibers are rarely detected. The rostral-most part of the SCN, a little-studied aspect of the nucleus, is lacking in RHT fibers. The results were confirmed using both light and confocal microscopy. These aspects would be hard to detect in the absence of markers for RHT fibers and SCN cell types in the same section. Although the following methods do not speak directly to the issue of fiber density in various SCN subregions, functional studies of the time course of FOS, PER protein, and Per mRNA expression support the general conclusion that the core region is the first to respond to an acute light pulse (Castel et al., 1997; Yan and Silver, 2002, 2004).
A constraint in the current work is the possibility that the CTβ tracing method used herein is not sufficiently sensitive to detect all axons and connections. Such an issue might be addressed by using transsynaptic tracing or double-label immunoelectron microscopic methodologies. At the present time, such studies are onerous, although new automated methods may be forthcoming (Kim et al., 2014).
In summary, the results of this study indicate a regionally distinct pattern of RHT innervation, with differential density of fiber distribution in subregions of the SCN. The findings are consistent with prior descriptions of RHT fiber distribution in the SCN, previous findings are extended by delineating associations with specific subtypes of SCN peptidergic cells, and the little studied rostral-most SCN region is characterized as free of detectable RHT fibers. Such information is key to understanding how photic cues reset the phase of cell-based oscillators of the SCN through actions on the networks of coupled cells of this nucleus.
Acknowledgments
We thank Dr. Paul Witkovsky for helpful discussion and review of an earlier draft of the manuscript. This work was supported by NSF grant 125605 and NINDS grant NS37919 to R.S.
Footnotes
NOTE
Supplementary material is available on the journal’s web-site at http://jbr.sagepub.com/supplemental.
References
- Abrahamson EE, Moore RY. Suprachiasmatic nucleus in the mouse: Retinal innervation, intrinsic organization and efferent projections. Brain Res. 2001;916(1–2):172–191. doi: 10.1016/s0006-8993(01)02890-6. [DOI] [PubMed] [Google Scholar]
- Antle MC, Silver R. Orchestrating time: Arrangements of the brain circadian clock. Trends Neurosci. 2005;28(3):145–151. doi: 10.1016/j.tins.2005.01.003. [DOI] [PubMed] [Google Scholar]
- Cassone VM, Speh JC, Card JP, Moore RY. Comparative anatomy of the mammalian hypothalamic suprachiasmatic nucleus. J Biol Rhythms. 1988;3(1):71–91. doi: 10.1177/074873048800300106. [DOI] [PubMed] [Google Scholar]
- Castel M, Belenky M, Cohen S, Wagner S, Schwartz WJ. Light-induced c-Fos expression in the mouse suprachiasmatic nucleus: Immunoelectron microscopy reveals co-localization in multiple cell types. Eur J Neurosci. 1997;9(9):1950–1960. doi: 10.1111/j.1460-9568.1997.tb00762.x. [DOI] [PubMed] [Google Scholar]
- Ecker JL, Dumitrescu ON, Wong KY, Alam NM, Chen SK, LeGates T, Renna JM, Prusky GT, Berson DM, Hattar S. Melanopsin-expressing retinal ganglion-cell photoreceptors: Cellular diversity and role in pattern vision. Neuron. 2010;67(1):49–60. doi: 10.1016/j.neuron.2010.05.023. [DOI] [PMC free article] [PubMed] [Google Scholar]
- Hattar S, Kumar M, Park A, Tong P, Tung J, Yau KW, Berson DM. Central projections of melanopsin-expressing retinal ganglion cells in the mouse. J Comp Neurol. 2006;497(3):326–349. doi: 10.1002/cne.20970. [DOI] [PMC free article] [PubMed] [Google Scholar]
- Hendrickson AE, Wagoner N, Cowan WM. An autoradiographic and electron microscopic study of retino-hypothalamic connections. Z Zellforsch Mikrosk Anat. 1972;135(1):1–26. doi: 10.1007/BF00307084. [DOI] [PubMed] [Google Scholar]
- Karatsoreos IN, Yan L, LeSauter J, Silver R. Phenotype matters: Identification of light-responsive cells in the mouse suprachiasmatic nucleus. J Neurosci. 2004;24(1):68–75. doi: 10.1523/JNEUROSCI.1666-03.2004. [DOI] [PMC free article] [PubMed] [Google Scholar]
- Kim JS, Greene MJ, Zlateski A, Lee K, Richardson M, Turaga SC, Purcaro M, Balkam M, Robinson A, Behabadi BF, et al. Space-time wiring specificity supports direction selectivity in the retina. Nature. 2014;509(7500):331–336. doi: 10.1038/nature13240. [DOI] [PMC free article] [PubMed] [Google Scholar]
- Miller JD, Morin LP, Schwartz WJ, Moore RY. New insights into the mammalian circadian clock. Sleep. 1996;19(8):641–667. doi: 10.1093/sleep/19.8.641. [DOI] [PubMed] [Google Scholar]
- Mohawk JA, Green CB, Takahashi JS. Central and peripheral circadian clocks in mammals. Annu Rev Neurosci. 2012;35:445–462. doi: 10.1146/annurev-neuro-060909-153128. [DOI] [PMC free article] [PubMed] [Google Scholar]
- Moore RY, Lenn NJ. A retinohypothalamic projection in the rat. J Comp Neurol. 1972;146(1):1–14. doi: 10.1002/cne.901460102. [DOI] [PubMed] [Google Scholar]
- Morin LP. Neuroanatomy of the extended circadian rhythm system. Exp Neurol. 2013;243:4–20. doi: 10.1016/j.expneurol.2012.06.026. [DOI] [PMC free article] [PubMed] [Google Scholar]
- Morin LP, Allen CN. The circadian visual system, 2005. Brain Res Rev. 2006;51(1):1–60. doi: 10.1016/j.brainresrev.2005.08.003. [DOI] [PubMed] [Google Scholar]
- Morin LP, Shivers KY, Blanchard JH, Muscat L. Complex organization of mouse and rat suprachiasmatic nucleus. Neuroscience. 2006;137(4):1285–1297. doi: 10.1016/j.neuroscience.2005.10.030. [DOI] [PubMed] [Google Scholar]
- Yan L, Silver R. Differential induction and localization of mPer1 and mPer2 during advancing and delaying phase shifts. Eur J Neurosci. 2002;16(8):1531–1540. doi: 10.1046/j.1460-9568.2002.02224.x. [DOI] [PMC free article] [PubMed] [Google Scholar]
- Yan L, Silver R. Resetting the brain clock: Time course and localization of mPER1 and mPER2 protein expression in suprachiasmatic nuclei during phase shifts. Eur J Neurosci. 2004;19(4):1105–1109. doi: 10.1111/j.1460-9568.2004.03189.x. [DOI] [PMC free article] [PubMed] [Google Scholar]


