

Abstract
Soft tissue sarcomas (STS) are a rare and heterogeneous group of malignant tumors that are often treated via surgical resection. Inadequate resection can lead to local recurrence and decreased survival rates. In this study, we investigate the hypothesis that near-infrared (NIR) autofluorescence can be utilized for tumor margin analysis by differentiating STS from the surrounding normal tissue. Intraoperative in vivo measurements were acquired from 30 patients undergoing STS resection and were characterized to differentiate between normal tissue and STS. Overall, normal muscle and fat were observed to have the highest and lowest autofluorescence intensities, respectively, with STS falling in between. With the exclusion of well-differentiated liposarcomas, the algorithm's accuracy for classifying muscle, fat, and STS was 93%, 92%, and 88%, respectively. These findings suggest that NIR autofluorescence spectroscopy has potential as a rapid and nondestructive surgical guidance tool that can inform surgeons of suspicious margins in need of immediate re-excision.
Soft tissue sarcomas (STS) are a rare and heterogeneous group of malignant tumors that arise from mesenchymal progenitors for a variety of tissue types such as muscle, fat, cartilage, blood vessels, and nerves. As a result, there are over 50 different subtypes of STS, each with their own name, classification, and prognosis [1]. STS can occur anywhere in the body, but most originate in an extremity (59%), the trunk (19%), the Retroperitoneum (15%), or the head and neck (9%) [2].
Despite the heterogeneity of STS subtypes, these sarcomas often manifest similarly as localized masses within a muscular compartment, which makes them ideal for surgical resection. Hence, the mainstay of local treatment is to excise the tumor completely with a wide margin of normal tissue to ensure that all malignant cells are removed from the tumor bed while avoiding unnecessary damage to the surrounding muscle, blood vessels, nerves, and bone. Incomplete resection of tumors has been shown to be a primary cause of local recurrence [3]. For patients with residual STS, additional therapies such as postoperative radiation and/or re-excision are often required, which can lead to increases in patient morbidity and health care costs [4–6].
Current surgical guidance and margin assessment methods are limited and highlight the need for an improved approach to ensure complete resections. Pre-operative magnetic resonance imaging (MRI) can provide a general evaluation of the tumor's size and allows for image-guided surgery; however, resolution is limited and the technique suffers from low sensitivity [7]. Intraoperatively, frozen section biopsies are often acquired for pathologic inspection. This process can take 30–60 min and is prone to sampling errors, especially when assessing large tumor beds [8]. Ultimately, the definitive evaluation of margin status relies on postoperative serial sectioning of the resected tumor and analysis using full-range histopathology techniques. However, results may take from several days to over a week for processing, which may limit treatment options for the surgeon and patient if a positive margin is found.
In terms of current research methods for tumor margin evaluation, optical techniques have been a relatively popular area of study due to their potential to provide quick, automated, and nondestructive assessment of tissue health. Techniques such as optical coherence tomography allow for morphological studies akin to physical biopsies [9], while other techniques, such as Raman spectroscopy, allow for extensive biochemical analysis [10]. However, due to the rarity of the disease, the majority of research for STS margin evaluation has been limited to in vitro and animal studies.
Of these optical modalities, autofluorescence spectroscopy is a technique for measuring the intrinsic light emissions from natural biological fluorophores that are excited by a light source. It does not require the use of any toxic exogenous contrast agents, and has been shown to differentiate between normal and neoplastic tissue based on changes in fluorophore concentrations and environment related to disease progression [11]. Compared with other optical techniques, autofluorescence spectroscopy is relatively easy to implement and can provide a quick and cost-effective method for discriminating between diseased and normal tissue. However, because of the large number of known intrinsic fluorophores with excitation in the ultraviolet or visible wavelength range, few researchers have studied near infrared (NIR) autofluorescence for disease detection [11].
In this Letter, we investigate the hypothesis that NIR autofluorescence spectra can be used to differentiate in vivo STS from the surrounding normal tissue commonly encountered within a surgical tumor bed.
Intraoperative in vivo autofluorescence spectra were collected under written informed consent guidelines as approved by the Vanderbilt University Institutional Review Board. Thirty subjects were recruited at the Vanderbilt University Medical Center (VUMC) from among patients screened for STS excisional surgery. A detailed breakdown of tissue types, number of patients, and number of measurements can be seen in Table 1.
Table 1. Recruitment Table Listing Tissue Type, Number of Patients, and Number of Measurements Collected for This Study.
| Tissue Type | Patients | Measurements |
|---|---|---|
| Normal muscle | 26 | 215 |
| Normal fat | 28 | 170 |
| Well-differentiated liposarcoma | 6 | 63 |
| Myxofibrosarcoma | 2 | 30 |
| Undifferentiated pleomorphic sarcoma | 2 | 40 |
| Sclerosing epithelioid fibrosarcoma | 2 | 19 |
| Pleomorphic rhabdomyosarcoma | 1 | 15 |
| Pleomorphic liposarcoma | 1 | 14 |
| Pleomorphic myxoid liposarcoma | 1 | 10 |
The mobile spectroscopy system consists of a custom-designed 7 × 1 fiberoptic probe (EmVision LLC, Loxahatchee, Florida) connected to a HoloSpec f/1.8i imaging spectrograph (Kaiser Optical Systems Inc., Ann Arbor, Michigan) equipped with a deep depletion charge coupled device (Princeton Instruments, Trenton, New Jersey, SPEC-10:256BR). The probe's light source consists of a 785 nm diode laser (Innovative Photonic Solutions, Monmouth Junction, New Jersey, I0785MM0350MS) and output power at the probe's tip was regulated to 80 mW. Each spectrum's wavelength axis was calibrated with a neon-argon light source. In addition, the wavelength-dependent response of the system was calibrated using a secondary reflective standard to a NIST-certified quartz-tungsten-halogen lamp (Oriel Instruments, Irvine, California, 63355).
After each tumor was completely excised, the sterilized fiberoptic probe was handed to the surgeon. During each measurement, all ambient light within the operating room was turned off and/or covered. Measurements were made from various tissues within the tumor bed, which included control healthy tissue such as muscle, fat, nerves, bone, and blood vessels as identified by the surgeon. Afterward, a small incision was made on the excised tumor and measurements were made within the tumor's interior. STS subtype was confirmed via postoperative histopathology.
Measurements were acquired using 0.5-s exposures summed over five accumulations. Five sets of measurements were acquired at each tissue of interest.
Spectral data was smoothed using a Savitzky–Golay filter and fit to a seventh order polynomial in order to extract the autofluorescence profile for each sample from 810 to 918 nm [12].
To account for the varying patient-dependent range of autofluorescence intensities, each patient's data set was standardized using min-max feature scaling to a range between 0 and 1. An unpaired student's t-test was utilized to determine significant differences between tissue types based on the spectral area under the curve.
Features from the standardized data, including area under the curve and slopes from five equal segments of the spectra, were used to generate a predictive classifier algorithm based on multinomial logistic regression [13]. Area under the curve was selected, as many of the spectra did not exhibit an autofluorescence peak within the acquired spectral range. Slopes were chosen in order to incorporate spectral line shape into the model. While other methods such as polynomial fitting could have been applied, a simple slope based approach was selected, as it is less computationally intensive and would allow for future work toward real-time processing. Five slopes were chosen in order to minimize testing error and overfitting. These include the slopes from 810 to 830 nm, 830 to 850 nm, 850 to 871 nm, 871 to 894 nm, and 894 to 918 nm.
The algorithm was then tested to differentiate normal muscle, normal fat, and STS using leave-one-patient-out cross-validation. During this process, one patient's set of measurements would be excluded and a model would be trained using the remaining data sets before being tested on the previously excluded measurements. In order to avoid bias, each model was trained and tested independently for all 30 patients without the use of an aggregate model. Due to the rarity of specific STS subtypes as seen in Table 1, our study was not powered for subtype differentiation.
Average raw autofluorescence for each tissue type measured in this study can be seen in Fig. 1(a). Average raw autofluorescence spectra including 95% confidence intervals for normal muscle, normal fat, and all STS can be seen in Fig. 1(b). Standardized area under the curve for each tissue was calculated in order to generate a single value for comparing the overall intensity differences between normal muscle, normal fat, and STS as shown in Fig. 2. An unpaired student's t-test was performed and significant differences (p ≪ 0.01) were observed within each group. From both Figs. 1(a), 1(b), and 2, it can be seen that normal muscle and fat within the tumor bed have both the highest and lowest autofluorescence intensities, respectively, while STS intensities tend to fall in between. Due to STS heterogeneity, a larger spread in confidence interval was observed for the STS autofluorescence intensitites.
Fig. 1.
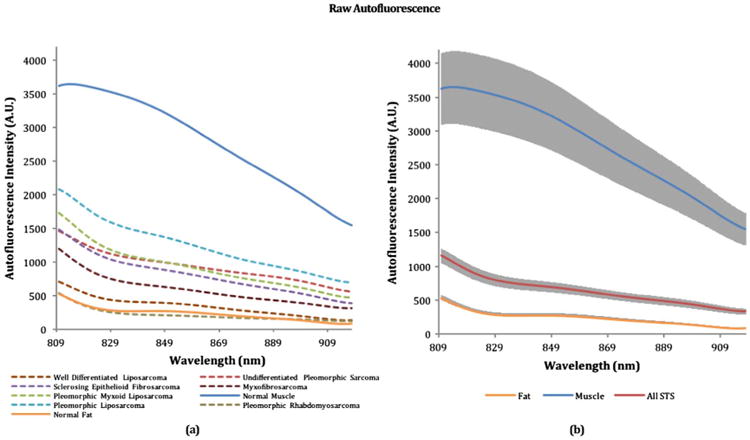
Raw autofluorescence spectra resulting from a 785 nm excitation source. (a) Average raw spectra for each tissue type. (b) Average raw spectra with 95% confidence intervals for normal muscle, normal fat, and all STS's averaged into a single spectrum.
Fig. 2.
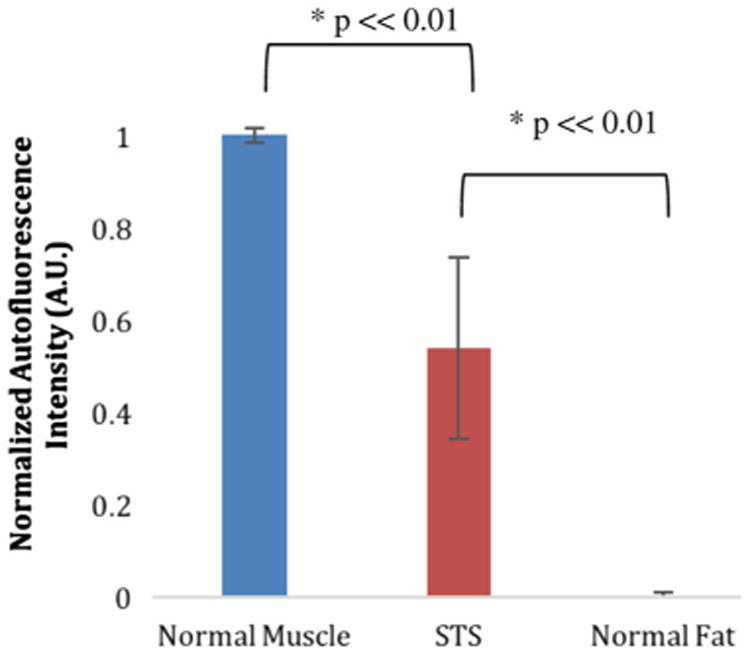
Standardized fluorescence area under the curve distribution for normal muscle, STS, and normal fat. Error bars indicate 95% confidence interval. Significant differences are marked with an asterisk.
Features from the standardized spectra were subsequently used in a classification algorithm based on multinomial logistic regression, which was then tested using leave-one-patient-out cross-validation. The total performance from all individual tests can be seen in the confusion matrices shown in Table 2 and 3, where each row represents a true class and each column represents a predicted class. Correctly identified classes are located in the diagonal. The algorithm's accuracy in classifying normal muscle, normal fat, and all STS was 89%, 84%, and 56%, respectively. With the exclusion of well-differentiated liposarcomas, the algorithm's accuracy in classifying normal muscle, normal fat, and STS increased to 93%, 92%, and 88%, respectively.
Table 2. Confusion Matrix: Normal Tissue Versus STS.
| Prediction | ||||
|---|---|---|---|---|
|
| ||||
| Muscle | Fat | STS | ||
| Actual | Muscle | 192 | 1 | 22 |
| Fat | 0 | 144 | 26 | |
| STS | 11 | 73 | 107 | |
Table 3. Confusion Matrix: Normal Tissue Versus STS Excluding Well-Differentiated Liposarcomas.
| Prediction | ||||
|---|---|---|---|---|
|
| ||||
| Muscle | Fat | STS | ||
| Actual | Muscle | 200 | 10 | 5 |
| Fat | 0 | 158 | 12 | |
| STS | 5 | 10 | 113 | |
To the best of our knowledge, this is the first ever NIR autofluorescence study of STS within human patients. Due to the rarity of the disease, a majority of STS optical analysis in the past has been limited to in vitro and animal studies. While various optical modalities have been explored for disease detection, NIR autofluorescence has largely been ignored due to the lack of known biological fluorophores beyond the visible spectrum. However, during the course of this study, the presence of NIR autofluorescence within the human body was observed, most notably within normal muscle tissue. The presented results suggest that this autofluorescence could be utilized to develop a surgical guidance tool for differentiating between STS and the surrounding normal tissue with deeper interrogation depths afforded by the use of NIR wavelengths.
The key observation can be seen in the raw spectra of Figs. 1(a) and 1(b), where normal muscle exhibits a much stronger autofluorescence signal compared to normal fat or any STS subtype. Correspondingly, STS autofluorescence was found to span the intensity range between normal muscle and fat depending on subtype. When the data was standardized to account for interpatient variability as seen in Fig. 2, this trend continued to be consistent with significant differences (p ≪ 0.01) observed between each tissue type based on overall intensity alone. Using multinomial logistic regression, we were able to develop a classification algorithm for differentiating tissue types based on the standardized spectra, which was then tested using a robust leave-one-patient-out validation technique. Despite the broad spectral line shapes, it was possible to identify classification features based on the spectral shape and overall autofluorescence intensities.
Since the two predominant normal tissues within a STS tumor bed are muscle and fat, there was a strong clinical motivation to test the algorithm's capability for discriminating between normal muscle, normal fat, and STS. From the results presented in Table 2, it can be seen that our model has high accuracy for identifying normal tissues but a much lower accuracy for detecting STS. The reason for this discrepancy is due to one specific STS subtype, well-differentiated liposarcomas, which in prior research has been shown to have histological similarities to normal fat despite atypia [14]. Consequently, the autofluorescence profile of this STS subtype shares close similarities to that of normal fat. As one of the most commonly diagnosed STS subtypes [15], it constituted a large majority of our STS data set, which subsequently lowered the accuracy for differentiating STS from normal fat. When well-differentiated liposarcomas were excluded from the study, a significant increase in accuracy was observed as shown in Table 3.
From a clinical standpoint, the inability to differentiate this particular subtype from the surrounding normal fat has a negligible effect on surgical outcome, as well-differentiated liposarcomas are one of the lowest grade liposarcomas with the least metastatic potential. Proper treatment that includes preoperative MRI scans, marginal surgical excision, and postoperative radiation often have five-year disease specific survival rates close to 95% [16,17]. This is because well-differentiated liposarcomas are often surrounded by large regions of normal fat that can be completely excised without risk of affecting vital tissue such as normal muscle, blood vessels, or nerves. The same cannot be said of any other STS subtype. Even for those that share a lipomatous origin, other subtypes may develop in or around vital tissue, which can hinder an attempt at complete tumor resection, thus highlighting the need for an improved intraoperative margin assessment tool. Due to the rare and highly heterogeneous nature of each individual STS subtype, the current study was limited to classification between diseased and nondiseased tissue. Separation of well-differentiated liposarcomas from normal fat, along with further subtype differentiation, may be possible with the use of a more specific optical modality such as NIR and high wavenumber Raman spectroscopy.
The basis for NIR autofluorescence within in vivo muscle is currently unknown at this time and further studies will have to be conducted. From the spectra presented in Fig. 1, it can be seen that normal muscle has an intensity peak near 813 nm, while STS and normal fat may have peaked prior to our spectral range. This suggests that there may be two fluorophores present within the tumor bed, one of which is unique to normal muscle. Porphyrin derivatives have been hypothesized as a possible source of NIR autofluorescence; however, the longest emitting known porphyrins are currently confined to the visible wavelength regime up to 700 nm [11]. For future work, we will further characterize the autofluorescence signal and investigate its biochemical and morphological origins.
In terms of clinical impact, the results of this study suggest that an optical device based on NIR autofluorescence alone could allow for intraoperative tumor margin assessment. If successful, it would allow for real-time and automated feedback to the surgeon regarding suspicious margins that may need to be excised in order to achieve complete tumor resection. This would significantly improve the management of STS with respect to time, patient morbidity, and healthcare costs.
The results of this study suggest that despite broad spectral line shapes, NIR autofluorescence spectroscopy can be used to differentiate in vivo STS from the surrounding normal muscle and fat. This was accomplished by generating a classifier algorithm based on multinomial logistic regression with overall autofluorescence intensity and slopes from five segments of the spectra used as inputs. With the exclusion of well-differentiated liposarcomas, the algorithm was able to perform with 88% accuracy when classifying STS from other normal tissues. In addition, a strong NIR autofluorescence signal from normal muscle was observed that has not, to the best of our knowledge, been reported in past literature. The identity of this intrinsic fluorophore is currently unknown and will be the subject of future work.
Acknowledgments
We would like to thank Dr. Herbert Schwartz, Dr. Jennifer Halpern, Dr. Krishna Reddy, Dr. Nathan Mesko, and all participating surgical personnel for their patience and assistance in this work.
Funding. National Cancer Institute (NCI) (F31CA200358); Orthopaedic Research and Education Foundation (OREF) (#14-010); Vanderbilt Orthopaedic Institute; Vanderbilt University School of Medicine.
Footnotes
OCIS codes: (170.6280) Spectroscopy, fluorescence and luminescence; (170.6935) Tissue characterization; (170.1610) Clinical applications; (170.6510) Spectroscopy, tissue diagnostics.
References
- 1.Demetri GD, Antonia S, Benjamin RS, Bui MM, Casper ES, Conrad EU, DeLaney TF, Ganjoo KN, Heslin MJ, Hutchinson RJ, Kane JM, Letson GD, McGarry SV, O'Donnell RJ, Paz IB, Pfeifer JD, Pollock RE, Randall RL, Riedel RF, Schupak KD, Schwartz HS, Thornton K, von Mehren M, Wayne J. J Natl Compr Cancer Network. 2010;8:318630. doi: 10.6004/jnccn.2010.0049. [DOI] [PubMed] [Google Scholar]
- 2.Cormier JN, Pollock RE. Cancer J Clin. 2004;54:94. doi: 10.3322/canjclin.54.2.94. [DOI] [PubMed] [Google Scholar]
- 3.Alamanda VK, Crosby SN, Archer KR, Song Y, Schwartz HS, Holt GE. Acta Oncol. 2013;52:793. doi: 10.3109/0284186X.2012.711953. [DOI] [PubMed] [Google Scholar]
- 4.Atean I, Pointreau Y, Rosset P, Garaud P, De-Pinieux G, Calais G. Cancer Radiotherapie. 2012;16:661. doi: 10.1016/j.canrad.2012.05.021. [DOI] [PubMed] [Google Scholar]
- 5.Blakely ML, Spurbeck WW, Pappo AS, Pratt CB, Rodriguez-Galindo C, Santana VM, Merchant TE, Prichard M, Rao BN. J Pediatric Surg. 1999;34:672. doi: 10.1016/s0022-3468(99)90353-6. [DOI] [PubMed] [Google Scholar]
- 6.Gronchi A, Casali PG, Mariani L, Miceli R, Fiore M, Lo Vullo S, Bertulli R, Collini P, Lozza L, Olmi P, Rosai J. J Clin Oncol. 2005;23:96. doi: 10.1200/JCO.2005.04.160. [DOI] [PubMed] [Google Scholar]
- 7.Gould SW, Agarwal T, Benoist S, Patel B, Gedroyc W, Darzi A. J Magn Reson Imaging. 2002;15:114. doi: 10.1002/jmri.10037. [DOI] [PubMed] [Google Scholar]
- 8.Shives TC. Clin Orthop Relat Res. 1993;289:32. [PubMed] [Google Scholar]
- 9.Carbajal EF, Baranov SA, Manne VG, Young ED, Lazar AJ, Lev DC, Pollock RE, Larin KV. J Biomed Opt. 2011;16:020502. doi: 10.1117/1.3541789. [DOI] [PubMed] [Google Scholar]
- 10.Manoharan R, Wang Y, Boustany NN, Brennan JF, III, Baraga JJ, Dasari RR, Van Dam J, Singer S, Feld MS. Proc SPIE. 1994;2328:128. [Google Scholar]
- 11.Lakowicz JR. Principles of Fluorescence Spectroscopy. Springer; 2006. [Google Scholar]
- 12.Lieber CA, Mahadevan-Jansen A. Appl Spectrosc. 2003;57:1363. doi: 10.1366/000370203322554518. [DOI] [PubMed] [Google Scholar]
- 13.Johnson RA, Wichern DW. Applied Multivariate Statistical Analysis. Prentice Hall; 2007. [Google Scholar]
- 14.Evans HL, Soule EH, Winkelmann RK. Cancer. 1979;43:574. doi: 10.1002/1097-0142(197902)43:2<574::aid-cncr2820430226>3.0.co;2-7. [DOI] [PubMed] [Google Scholar]
- 15.Singer S, Antonescu CR, Riedel E, Brennan MF. Ann Surg. 2003;238:358. doi: 10.1097/01.sla.0000086542.11899.38. [DOI] [PMC free article] [PubMed] [Google Scholar]
- 16.Crago AM, Singer S. Curr Opin Oncol. 2011;23:373. doi: 10.1097/CCO.0b013e32834796e6. [DOI] [PMC free article] [PubMed] [Google Scholar]
- 17.Dalal KM, Kattan MW, Antonescu CR, Brennan MF, Singer S. Ann Surg. 2006;244:381. doi: 10.1097/01.sla.0000234795.98607.00. [DOI] [PMC free article] [PubMed] [Google Scholar]