

ABSTRACT
ADAR1 is a double-stranded RNA (dsRNA) editing enzyme that specifically converts adenosine to inosine. ADAR1 is ubiquitously expressed in eukaryotes and participate in various cellular processes such as differentiation, proliferation and immune responses. We report here a new proteomics study of HEK293T cells with and without ADAR1 overexpression. The up- and down-regulated proteins by ADAR1 overexpression are identified by liquid chromatography-tandem mass spectrometry (LC-MS/MS) followed by label-free protein quantification. Totally 1,495 proteins (FDR < 0.01) are identified, among which 211 are up- and 159 are down-regulated for at least 1.5-fold (n = 3, p < 0.05). Gene ontology analysis reveals that these ADAR1-regulated proteins are involved in protein translation and cell cycle regulation. Bioinformatics analysis identifies a closely related network consistent for the protein translation machinery and a tightly connected network through proliferating cell nuclear antigen (PCNA)-interactions. Up-regulation of the proteins in the PCNA-mediated cell proliferation network is confirmed by Western blotting. In addition, ADAR1 overexpression is confirmed to increase cell proliferation in HEK293T cells and A549 cells. We conclude that ADAR1 overexpression modulates the protein translation and cell cycle networks through PCNA-mediated protein-protein interaction to promote cell proliferation in HEK293 cells.
KEYWORDS: ADAR1, biotechnology, cell proliferation, mass spectrometry, proteomics, protein translation
Introduction
Adenosine deaminase acting on RNA (ADAR) is a family of double-stranded RNA (dsRNA) editing enzymes that specifically converts adenosine to inosine in dsRNA. In mammals, ADAR1, ADAR2 and ADAR3 have been identified. ADAR1 is ubiquitously expressed in several organs and exhibits several unique features such as 2 putative Z-DNA binding domains,1 3 dsRNA binding repeats, an adenosine deaminase domain and nuclear localization signal (NLS-c).2-4 ADAR1 is ubiquitously expressed in eukaryotes and important for various cellular processes, such as differentiation, proliferation and immune responses. Notably, ADAR1 is involved in immune response and is essential for suppression of interferon signaling.5,6 Recently, ADAR1 is reported to participate in RNA and MDA5-driven autoimmunity by down-regulating MDA5-MAVS RNA sensing pathway and preventing activation of the innate immune system.7-9
Notably, ADAR1 is embryonically lethal and essential in embryonic development. ADAR1-deficient embryonic stem cells affect the development of the liver, bone marrow, spleen, thymus and blood in adult chimeric mice.10 Fibroblasts from ADAR1 null embryos are prone to apoptosis induced by serum deprivation and widespread apoptosis has been detected in many tissues in mice homozygous for an ADAR1 null mutation. ADAR1-deficient haematopoietic stem cells are incapable of surviving and essential in adult hematopoiesis through its RNA editing activity.11 In addition, loss of ADAR1 in human induced pluripotent stem cells (iPS) promotes caspase3 -mediated apoptotic cell death, which is consistent with the necessity of ADAR1 in iPS cell survival.12
The fact that downregulation of ADAR1 inhibits cell growth leads to the hypothesis that overexpression of ADAR1 would promote cell proliferation. In this study, we aim to analyze the proteomic effect of ADAR1 overexpression in HEK293 cells using liquid chromatography-tandem mass spectrometry (LC-MS/MS) followed by label-free protein quantification. The up- and down-regulated proteins by ADAR1 overexpression are identified. Bioinformatics tools are used to understand the molecular and cellular functions of ADAR1-regulated proteins by comparing with knowledge-based databases. A closely related network consistent for the protein translation machinery and a tightly connected network through proliferating cell nuclear antigen (PCNA)-interactions are identified and validated by western blot analysis and cell assays.
Material and methods
Plasmid construction
The full-length mouse ADAR1 cDNA sequence coding for amino acids 1-1178 of mouse ADAR1 (GenBank Accession NM_001146296.1 GI: 226371676) with a His tag on the N terminus was cloned into the pEGFP-N1 vector, and the construct was named N1_ADAR1. A mouse mutant ADAR1 cDNA sequence without a deaminase domain including NLS-c (GenBank Accession NM_001146296.1 GI: 226371676) with a His tag on the N terminus was cloned into the pEGFP-N1 vector, and the construct was named N1_mutant. The full-length ADAR1 can enter the cell nucleus and edit dsRNA with a deaminase domain including NLS-c. The mutant ADAR1 is retained in the cytoplasm and cannot edit dsRNA without a deaminase domain and NLS-c.
Cell culture and transfection
The human kidney cell line H293T was cultured in Dulbecco's modified Eagle's medium (DMEM; Invitrogen) supplemented with 2 mM glutamine, 200 µg/mL streptomycin, 200 U/mL penicillin and 10% heat-inactivated fetal bovine serum (Gibco) and maintained at 37°C with 5% CO2. DNA transfection was performed using Lipofectamine 2000 (Invitrogen) according to the manufacturer's recommendation. In brief, H293T cells (4–6×10⁵ cells) seeded on 100 mm dishes were incubated with a mixture of 80 µg of purified plasmid DNA and 80 µl of Lipofectamine 2000 for 48 h. The constructs used for transfection included (a) N1_ADAR1, a mouse ADAR1 p150 expression vector with a His tag on the N terminus; and (b) N1_mutant, a mouse ADAR1 mutant expression vector with a His tag on the N terminus. Control cells were generated by transfection with N1_mutant.
Protein extraction for in vitro RNA editing and quantitative proteomics
Full-length and mutant ADAR1-expressing plasmids were transfected into human HEK293T cells in 100-mm dishes using Lipofectamine 2000 reagent according to the manufacturer's instructions (Invitrogen). After 48 h, the cells transfected with either full-length or truncated ADAR1 were harvested by centrifugation at 800×g for 10 min at 4°C. The cell pellets were washed 3 times with ice-cold PBS (0.1 M Na2HPO4, 0.15 M NaCl, pH 7.5), suspended in 1 ml of chilled RIPA lysis buffer [Millipore 20–188; 0.5 M Tris-HCl (pH 7.4), 1.5 M NaCl, 2.5% deoxycholic acid, 10% NP-40, and 10 mM EDTA] containing a protease inhibitor cocktail (Roche) and sonicated. Each lysate was centrifuged at 12,000×g for 30 min at 4°C, and the supernatant was collected. The protein concentration was determined using a bicinchoninic acid (BCA) assay (Beyotime, China).
Preparation of dsRNA substrate and in vitro editing assay
A 50-bp long synthetic dsRNA substrate was prepared from a sense/antisense pair of RNA oligonucleotides (Sense strand, 5′-CGCGCGCGCGCGGGACAAAUUAACCAAGGAAAAUAACAAGGACAGGGACC-3′; antisense strand, 5′-GGUCCCUGUCCUUGUUAUUUUCCUUGGUUAAUUUGUCCCGCGCGCGCGCG-3′). For dsRNA editing assay, 1 fmol/ml dsRNA substrate was incubated with 0.5 ml of cell lysates expressing the full-length or mutant ADAR1 in buffer D [20 mM HEPES (pH 7.9), 0.1 M KCl, 20% glycerol and 0.2 mM EDTA] at 37°C for 2 h. The reaction was stopped by proteinase K digestion. The dsRNA was recovered by phenol/chloroform extraction and ethanol precipitation. The recovered dsRNA was reverse-transcribed using a primer (5′-GACACGGATCCACACAACGGTCCCTGTCC-3′) and reverse transcriptase (Thermo Scientific). The cDNA was amplified by PCR using the following primers: 5′-GTGAATTCGCGCGCGCGCGG-3′ and 5′-GACACGGATCCACACAAC-3′. The PCR products were subcloned into pcDNA 3.0 (Invitrogen) and sequenced. A positive editing event will produce an A to G point mutation in the positive strand or a T to C mutation in the negative strand of the synthetic dsRNA substrate.
In-solution trypsin digestion
For quantitative proteomics analysis, cell lysates (200 µg) were subjected to trypsin digestion. Cell lysate was reduced with 20 mM dithiothreitol (DTT; 56°C, 30 min), alkylated with 50 mM iodoacetamide (26°C, 20 min in the dark) and digested with sequencing-grade modified trypsin (1:50 w/w; Sigma) at 37°C for 24 h. The solution was filtered by centrifugation at 15,000×g for 30 min in a 10k Amicon Ultra-0.5 filter (Millipore). The filtered peptides were then desalted using ZipTip C18 columns (Sigma). After the filtered peptides were loaded into ZipTip C18 columns (Sigma), the columns were washed 3 times with 0.1% trifluoroacetic acid to desalt the samples and were eluted with elution buffers containing 50% methanol/0.1% formic acid (FA). The desalted peptides were collected, dried in a SpeedVac and stored at −20°C until further analysis.
LC-MS/MS analysis
The peptides were separated by high pressure liquid chromatography (HPLC, Thermo EASY-nLC System) and analyzed using a hybrid linear ion trap-Orbitrap mass spectrometer (Thermo LTQ Orbitrap Velos Elite, Thermo Scientific). For each analysis, the sample was trapped on a C18 precolumn and then on a C18 reversed-phase analytical column. The peptides were eluted from the column with a linear solvent gradient to wash the column (A: 0.1% FA in water; B: 100% acetonitrile /0.1% FA) for 120 min at a flow rate of 200 nL/min (5 min of 95% buffer A, a 95 min gradient from 5%–45% buffer B, a 10 min gradient from 45%–90% buffer B, and a 5 min gradient of 90% buffer B). Peptides were analyzed in positive ion mode. MS spectra were acquired in profile mode using the Orbitrap analyzer in the m/z range between 300 and 1800 at 60,000 resolutions. MS/MS analysis was performed in the collision-induced dissociation (CID) mode. Every sample was run in triplicate with the same methods.
Data analysis and peptide identification
Collision-induced dissociation (CID) data for each sample was searched using Proteome Discoverer 1.4 (Thermo Fisher Scientific) against the Swiss-Prot human database (downloaded Oct 21, 2014; 340928 entries). All searches used the following parameters: mass tolerances in MS and MS/MS modes were 15 ppm and 0.8 Da, respectively. Trypsin was designated as the enzyme, and up to 2 missed cleavages were allowed. Carbamidomethyl (C) was searched as a fixed modification, whereas oxidation (M) was searched as a variable modification. The cutoff of false discovery rate (FDR) at the peptide level was set to 0.01.
Label-free quantification
Label-free quantification of all 6 runs was analyzed using Progenesis LC-MS software (version 4.1; Nonlinear Dynamics, UK). In Progenesis LC-MS software, trypsin was designated as the enzyme, 2 missed cleavages were allowed, and the human proteome from Swiss-Prot was used as a background proteome. The fixed modification was Carbamidomethyl (C), and the variable modification was oxidation (M). The mutant_exp2 sample was set as the reference, and data processing was aligned. Among the statistically significant proteins detected by the ANOVA test (p < 0.05), protein abundances that changed less than 1.5-fold (ADAR1/mutant) were discarded.
Bioinformatics analysis of the differentially abundant proteins
For the ontological analysis, the lists of regulated proteins were submitted to the PANTHER ((http://www.pantherdb.org/) database with their UniProt accession number to analyze protein functions that were regulated upon ADAR1 overexpression. For the protein network analysis, the lists of identified proteins were submitted to the STRING (http://www.string-db.org/ database with their UniProt accession numbers from HUMAN.
Immunoblot analysis
Western blot analyses were performed on cell extracts from ADAR1- and mutant-transfected cells. The proteins were lysed and extracted in ice-cold RIPA lysis buffer containing 0.5 M Tris-HCl (pH 7.4), 1.5 M NaCl, 2.5% deoxycholic acid, 10% NP-40, 10 mM EDTA and a protease inhibitor cocktail (Roche) by centrifugation at 12,000×g for 30 minutes. The protein extracts (50 µg) were resolved by sodium dodecyl sulfate polyacrylamide gel electrophoresis (SDS-PAGE) and were electrotransfered to nitrocellulose (NC) membranes (Millipore; 0.45 um). The membranes were probed with anti-His tag (1:3,000; Sigma, cat lot #:H1029;USA), anti-PCNA (1:1,000; CST, cat lot #:2586; USA), anti-XRCC5 (1:1,000;CST,cat lot #:2180;USA), anti-PRPF19 (1:1,000; Abcam, cat lot #:ab126776;UK), anti-exportin-5 (1:500; Abcam,cat lot #:ab57491;UK) and anti-tubulin (1:1,000; Abcam, cat lot #:ab80779;UK) antibodies. Quantification of the protein gel blot results was performed using ImageJ software.
Cell proliferation assay
EDU cell proliferation assay
HEK293T cells and A549 cells (2500 cells/well) were seeded in triplicate in 24-well plates (Nunc) and were incubated in DMEM with 10% bovine serum (Gibco) for 12 h at 37°C. Four groups of cells (2 groups of HEK293T cells and 2 groups of A549 cells; 3 wells per group) were transfected with either ADAR1 or mutant plasmids for 36 h. Next, 50 μM EdU labeling medium was added to the cell culture, which was then incubated for 2 h at 37°C under 5% CO213 according to the manufacturer's instructions of an EdU DNA Cell Proliferation Kit (Guangzhou Ribobio Co., Ltd., China). The labeled cells were fixed in 4% paraformaldehyde (pH 7.4) for 30 min and incubated with glycine for 5 min. After the cells were washed with PBS, staining with Apollo working solution was performed at room temperature for 30 min. After the cells were washed with 0.5% Triton X-100 in PBS, they were incubated with Hoechst 33342 dye in the dark at room temperature for 30 min, followed by observation under an inverted fluorescence microscope (Olympus, Japan). More than 5 random fields per well were captured at 200× magnification. Image-Pro Plus 6.0 software (IPP 6.0) was used to calculate the percentage of EdU-positive cells (identified by Apollo® 643 fluorescence) in all cells (identified by Hoechst 33342 nuclei staining).
MTT cell proliferation assay
Cell proliferation was tested using a 3-(4,5-dimethylthiazol-2-yl)-2, 5-diphenyl tetrazolium bromide (MTT) assay. For the assay, HEK293T cells and A549 cells were seeded into 96-well plates at a density of 3×10³ cells per well in 100 ul of DMEM (10% FBS) in 5 replicates (20 wells for ADAR1 group and Mutant group) and incubated for 24 h, respectively. DNA transfection was performed using Lipofectamine 2000 (Invitrogen) according to the manufacturer's recommendation. In brief, cells (3×10³ cells) seeded on a well were incubated with a mixture of 0.8 µg of purified plasmid DNA and 0.8 µl of Lipofectamine 2000. The plasmids used for transfection included N1_ADAR1 and N1_mutant. After 48 h of incubation, 10 µl of MTT solution was added per well. After 4 h of incubation, the media were carefully discarded and the formazan crystals were dissolved with 100 µl of DMSO. Plates were kept on orbital shaker for 5 min and optical density (O.D.) was measured using varioskan flash (Thermo) at 570 nm and 630 nm. The absorbance at 570 nm was measured with the absorbance at 630 nm subtracted to account for the plastic well and cellular debris.14
Proliferation index (PI)15 was calculated by [(O.D. of test sample − O.D. of 0h control)/ O.D. of 0h control]. 0h control: 3 × 10³ cells/well.
Results and discussion
ADAR1 overexpression in HEK293T cells
To analyze the molecular effect of ADAR1 overexpression, ADAR1 was introduced into HEK293T cells by transient expression. To this end, the full-length ADAR1 and a truncated mutant lacking the deaminase catalytic domain and the C-terminal nuclear localization signal (NLS-c) (Fig. 1a) were sub-cloned under the CMV promoter and fused with a 6xHis tag for detection. Expression was confirmed by transfection of HEK293T cells and detected by Western blot analysis using the antibody against the 6xHis tag (Fig. 1b). To examine the editing activity of ADAR1, a synthetic dsRNA containing 16 adenosines (AACAAUAAAAGGAACCAAUUAAACA) (Fig. 1c) was incubated with the cell lysates expressing ADAR1 or the truncated mutant. After editing, the substrate dsRNA was recovered by RT-PCR with the specific primers. The RT-PCR products were analyzed by sequencing. The edited adenosines were identified as A-to-G mutations in the positive strand cDNA or as T-to-C mutations in the negative strand cDNA. As expected, no mutation was detected at the adenosine positions when cell lysates expressing the mutant were used, indicating low levels of endogenous dsRNA editing activity. However, significant T-to-C mutations in the negative cDNA strand were observed when HEK293T cells were transfected with the full-length ADAR1 (Fig. 1d). The frequency of over-expressing ADAR1-mediated dsRNA editing, which was defined as the percentage of A-to-G mutations in the positive strand or of T-to-C mutations in the negative strand of the synthetic dsRNA, varied at different positions of the substrate (Fig. 1e). Markedly, adenosine at position 8 of the substrate was completely edited, suggesting that the level of dsRNA editing was dramatically increased in HEK293T cells by transient expression of full-length ADAR1 with the deaminase domain. Therefore, the full length ADAR1 enhanced dsRNA editing activity whereas the truncated ADAR1 mutant lacking the deaminase domain and NLS-c did not, which served as the negative biological control in HEK293t cells.
Figure 1.

Establishing ADAR1 overexpression in HEK293T cells. (a) Domain structure of the full-length ADAR1 (1–3537 bps, GenBank # NM_001146296) and the truncated mutant lacking the deaminase domain (1–2286 bps). The cDNAs were cloned into the pEGFP-N1 vector under the CMV promoter. NES, nuclear export signal; α and β, Z-DNA binding domain; dsRBD 1, 2 and 3, dsRNA binding domain; NLS-c, nuclear localization signal in deaminase domain. (b) The expression of ADAR1 and the mutant was examined in HEK293T cells by western blot analysis using the antibody against the His-tag. Tubulin: internal control. (c) The dsRNA substrate were chemically synthesized and annealed for in vitro editing assay. The primers for reverse transcription (RT) and PCR were indicated for amplification and sequencing. The dsRNA sequence that were exposed for editing: 1.AACAAUAAAAGGAACCAAUUAAACA.25. (d) Sequencing of the RT-PCR products of the dsRNA substrate (the negative cDNA sequence is shown). Note, A-to-I editing on dsRNA was transcribed as A-to-G mutations on the positive cDNA strand and as T-to-C mutations on the negative cDNA strand. (e) The relative levels of dsRNA editing activity were defined as the percent of the edited adenosines over the edited and unedited adenosines at 16 adenosine positions (p < 0.001, n = 3, t-test).
Proteins regulated by ADAR1 overexpression in HEK293 cells
To understand the effects of ADAR1 overexpression on proteomics of HEK293T cells, cell lysates with transient expression of full-length ADAR1 or the truncated mutant were digested with trypsin. The peptide mixtures were separated by C18 reverse-phase liquid chromatography followed by MS/MS analysis using Orbitrap Elite mass spectrometer. The peptide MS/MS spectra were searched against the human protein database using Sequest and Mascot search engines to identify the proteins in the cell lysates. In total, 1495 non-redundant proteins were identified from HEK293T cells expressing ADAR1 and the mutant with high confidence (FDR < 0.01) (Table 1, Supplemental Table S1). For quantification, ion intensities of the peptides were considered proportional to their amounts and qualified peptides were used to quantitate the proteins.16 As a result, the levels of 370 proteins in ADAR1 overexpresssion group were up- or downregulated for at least 1.5-fold in comparison with the mutant group (p < 0.05, t-test, n = 3) (Supplemental Table S1). Among the ADAR1-regulated proteins, 211 were up- and 159 down-regulated. Thus, ADAR1 over-expression resulted in a significant proteomic change in HEK293T cells.
Table 1.
Identification of proteins from HEK293 cells over-expressing ADAR1/mutanta.
| ADAR1 |
Mutant |
||||||||
|---|---|---|---|---|---|---|---|---|---|
| Exp1 | Exp2 | Exp3 | Sumb | Exp1 | Exp2 | Exp3 | Sumb | Totalc | |
| Protein # | 1061 | 987 | 985 | 1299 | 1021 | 961 | 948 | 1243 | 1495 |
| Peptide # | 3711 | 3460 | 3431 | 5033 | 3434 | 3281 | 3214 | 4616 | 6127 |
| Alignmentd | 87.2 | 88.0 | 88.5 | 96.5 | 100 | 96.6 | |||
Identification was considered only with high confidence (p < 0.05 and FDR < 0.01).
Exp1, Exp2 and Exp3: 3 independent experiments; sum: non-redundant proteins or peptides.
Total non-redundant proteins or peptides.
Similarity of the identified peptides between samples compared with Mutant Exp2.
Gene ontology analysis of ADAR1-regulated proteins
To understand the molecular functions, the 370 proteins that were regulated by ADAR1 overexpression were compared with the proteins in the PANTHER database (http://www.pantherdb.org) (Supplemental Table S2).16 Based on biological processes, 219 proteins (59.2%) were involved in metabolic process (mostly protein translation) (Fig. 2), 134 proteins (36.2%) were closely related to cellular process (among which 58 were involved in cell cycle process), 66 proteins (17.7%) were relevant to intracellular localization (mainly to nuclear transportation), and 60 proteins (16%) were relevant to biological regulation (among which 9 were involved in translation regulation). Therefore, for molecular mechanisms, the proteins that were regulated by ADAR1 overexpression were predominately involved in protein translation and transportation. For cellular process, these proteins likely mediated cell cycle and cell proliferation.
Figure 2.

Ontological categories of the up- and down-regulated proteins by PANTHER. (a) The category name, number and percent of the up- and downregulated proteins (Supplementary Table S2) are shown by the center pie chart: 1. Metabolic process (GO: 0008152), 219, 59.5%; 2. Cellular process (GO: 0009987), 134, 36.2%; 3. Localization (GO: 0051179), 66, 17.7%; 4. Biological regulation (GO: 0065007), 60, 16.1%; 5. Developmental process (GO: 0032502), 48, 12.9%; 6. Cellular component organization or biogenesis (GO: 0071840), 48, 12.9%; 7. Response to stimulus (GO: 0050896), 30, 8.1%; 8. Multicellular organismal process (GO: 0032501), 20, 5.4%; 9. Immune system process (GO: 0002376), 19, 5.1%. The proteins in the first 3 categories were further classified; the results are shown in the 3 smaller pie charts. (b) Purple and blue represent the numbers of up- and down-regulated proteins, respectively.
Protein translation and cell cycle networks mediated by ADAR1 overexpression
To understand the cellular functions, the up- and downregulated proteins by ADAR1 overexpression were connected through protein-protein interaction networks using STRING prediction algorithms (http://string-db.org (Supplemental Table S3).17 Among 72 proteins in the category of protein translation and cell cycle regulation, 61 proteins were classified to 2 major networks using confident interaction methods (Fig. 3). The first conterminous network consisted of 29 proteins that were well connected to protein translation. These included 4 ribosomal protein small units (RPS5, RPS3, RPS13, and RPS10), 7 ribosomal protein large units (RPL7, RPL10, RPL22, RPL28, RPL35, RPL36A, and MRPL49), 6 eukaryotic translation initiation factors (EIF3A, EIF3G, EIF3I, EIF3L, EIF4G2 and EIF5B), and 2 eukaryotic translation elongation factors (EEF1A1 and EEF1A2). These proteins were clearly part of the protein translation machinery and important for cell proliferation and growth. The rest 32 proteins formed the second network that was centered at proliferating cell nuclear antigen (PCNA) important for cell cycle regulation. PCNA, which was known as a marker protein for cell proliferation, was a conterminous protein to apparently communicate between the protein translation and cell cycle networks through protein-protein interactions. It suggested by the interaction networks that ADAR1 overexpression could affect protein translation to promote cell proliferation and growth.
Figure 3.

Protein translation and cell cycle interaction networks of the up- and downregulated proteins. 61 ADAR1-regulated proteins were matched with protein translation and cell cycle networks (Supplemental Table S3) based on the STRING databases (http://string-db.org). Unconnected nodes (proteins) were deleted. PCNA was shown as a conterminous protein between the protein translation and cell cycle interaction networks.
The PCNA interaction network mediated by ADAR1 overexpression
To further understand the cell cycle network, the proteins in this category were connected by STRING through high confident protein-protein interactions. A 9-protein PCNA interaction network was identified (Supplemental Table S3) (Fig. 4a). In this network, 6 proteins were up-regulated by ADAR1 overexpression, which included X-ray repair cross-complementing protein 5(XRCC5), pre-mRNA processing factor 19(PRPF19), nuclear auto antigenic sperm protein (NASP), PCNA, hepatoma-derived growth factor (HDGF) and nuclear distribution C (NUDC). In addition, 3 proteins were down-regulated in this network, including DNA polymerase (POLA1), isoform 2 of kinesin-like protein KIF15 (KIF15) and ribonucleotide reductase large subunit (RRM1). Notably, sequence analysis revealed that all proteins in the PCNA interaction network contained the PCNA interaction domains, either the KA boxes.18 and/or PIP-boxes19,20 (Table 2). In our label-free quantification, PCNA peptides were aligned by their retention time and accurate masses.17,21 PCNA was upregulated by 2-fold with a MASCOT Score of 186 (p < 0.001, n = 3) (Fig. 4b, c).
Figure 4.
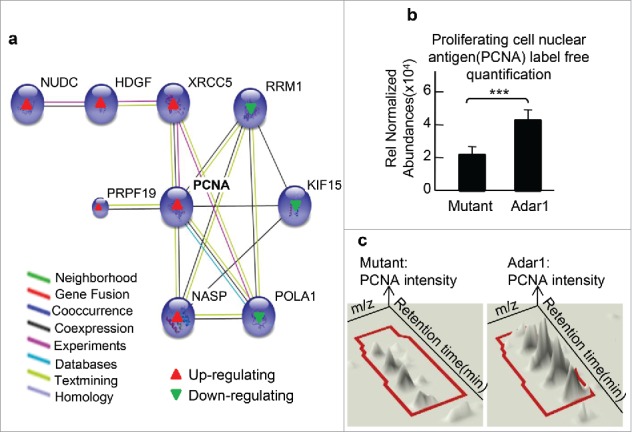
Cell proliferation interaction network of the up- and down-regulated proteins by ADAR1 over-expression (a) K-mean classification of the 6 up-regulated and 3 downregulated protein network in ADAR1 over-expressing cells. (b) PCNA quantification analysis. Normalized abundance of PCNA was 4.2 × 10⁴ ± 0.25 in ADAR1 over-expressing cells and 2.1 × 10⁴ ± 0.06 in the control group (***, p < 0.001, n = 3). (c) Intensities of PCNA peptide based on the retention time and accurate masses (m/z) in LC-MS/MS analysis were indicated.
Table 2.
PCNA interaction proteins in the networks.
| PRPF19 | Pre-mRNA processing factor 19 | 76_KALQDEWDAV_85 | KA-box |
| XRCC5 | X-ray repair cross-complementing protein 5 | 547_QVTAQEIF_554 | PIP-box |
| NASP | Nuclear autoantigenic sperm protein | 327_KAVLEQLV_334 572_QLNLCSQF_565 | PIP-box KA-box |
| POLA1 | DNA polymerase | 361_QPGVVFLF_368 1251_QFRVHHY_1257 | 2x PIP |
| KIF15 | Isoform 2 of Kinesin-like protein | 301_QTPPESF_307 322_QEAMLFF_328 475_QKEPCLF_481 | 3x PIP |
| RRM1 | Ribonucleoside-diphosphate reductase large subunit | 506_QGLADAF_512 | PIP-box |
Note: KA-box: K-A-(A/L/I)-(A/L/Q)-x-x-(L/V); x: any residue; PIP-box: Q-xx-(h)-x-x-(a)-(a); h: moderately hydrophobic residues L, I, M, A, V and P; a: highly hydrophobic aromatic residues F, Y and W.
Based on bioinformatics information, the proteins in the PCNA network are important for cell proliferation. In general, PCNA is known to facilitate polymerase accessibility during the elongation step of DNA synthesis through the KA- and PIP-boxes. PCNA regulates eukaryotic DNA replication by increasing the polymerase's accessibility during elongation of the leading strand. It binds proteins that are involved in DNA replication, DNA repair, and cell cycle control.18 PCNA forms a sliding platform that mediates the interaction of proteins with DNA.19 Nevertheless, PRPF19 also contains KA-box-related sequence to interact with PCNA. PRPF19 is a transcription elongation factor necessary for full transcriptional activity.22 PRPF19 also plays important roles in repressing cell cycle arrest and inhibiting apoptosis.23 Depletion of PRPF19 results in cellular apoptosis24 whereas overexpression of PRPF19 facilitates cell survival.25 Thus, upregulation of PRPF19 by over-expressing ADAR1 is expected to promote cell proliferation. Similarly, XRCC5 interacts with PCNA through its PIP-box that binds preferentially to fork-like ends of double-stranded DNA in a cell cycle-dependent manner. XRCC5 is associated with breast cancer26 and overexpressed in several types of cancers.27,28 Thus, upregulation of XRCC5 is reasoned to promote cell proliferation. Next, NASP is a non-histone chromatin-binding protein required for DNA replication, cell cycle progression and cell proliferation. NASP also contains a PIP-box-related sequence and a KA-box related sequence to interact with PCNA. NASP is frequently expressed in ovarian cancer (OVCA) tissues and often used as a biomarker for early cancer detection and treatment.29,30 Next, NUDC is fundamentally important in both eukaryotic cell proliferation and spindle formation during mitosis.31 Down-regulation of NUDC mRNA inhibits cell proliferation. The NUDC protein is highly expressed in nasopharyngeal cells compared to nasopharyngeal non-cancerous tissues 32 and its upregulation is found in a variety of non-neoplastic dividing cells.33 Thus, it is consistent that NUDC upregulation is associated with cell proliferation in ADAR1 over-expressed cells. Finally, HDGF is reported to be a predictive and prognostic marker for several types of cancer 34 and overexpressed in ovarian cancer cell lines.35 HDGF is also shown to stimulate proliferation of hepatoma cells in vitro.36 Thus, upregulation of HDGF is also associated with cell proliferation. Taken together, bioinformatics information of ADAR1-regulated proteins was consistent with the conclusion that the PCNA interaction network was important for ADAR1 over-expression to communicate with the protein translation network and upregulate cell proliferation.
Validation of the up-regulated proteins by western blot analysis
In addition to mass spectrometry-based label-free assays, we further confirmed the proteins that were upregulated by over-expressing ADAR1 using immune assay. To this end, total lysates of cells transfected with ADAR1 or its mutant were resolved by SDS-PAGE and transferred onto nitrocellulose membrane. For protein gel blot analysis, the membrane was incubated with antibodies directed against human PCNA. To normalize the amounts of cell lysate, an antibody directed against tubulin was used as a control. Consistent with label-free quantification, PCNA expression increased 2.0-fold (p < 0.01, n = 3) (Fig. 5a) when ADAR1 was overexpressed. Similarly, X-ray repair cross-complementing protein 5 (XRCC5) and pre-mRNA processing factor 19 (PRPF19) expression levels were confirmed by western blot analysis using antibodies directed against human XRCC5 and PRPF19 (Fig. 5b, c). Quantification using ImageJ software demonstrated that XRCC5 increased 1.6-fold (p < 0.01, n = 3) and that PRPF19 increased 1.76-fold (p < 0.01, n = 3). Notably, Exportin-5 was not directly connected through the PCNA interaction domains; however, Exportin-5 was shown to mediate nuclear exportation of cellular components necessary for protein translation, including Elongation Factor 1-α 1(eEF1A), tRNA and signal recognition particle RNA (SRP RNA).37,38 Exportin-5 might interact with ADAR1 through dsRNA and the nucleocytoplasmic shuttling signals of full-length ADAR1 [35]. Up-regulation of Exportin-5 was confirmed by Western blot analysis (Fig. 5d).
Figure 5.
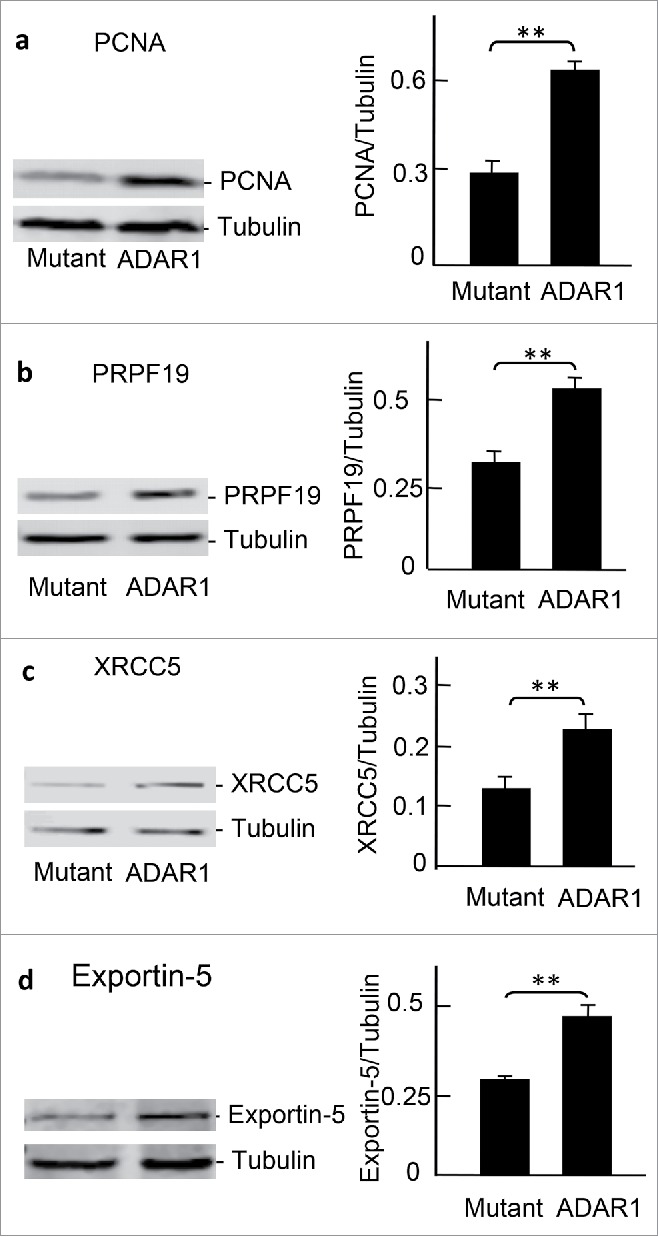
Validation of the upregulated proteins by protein gel blot analysis HEK293T cells were transfected with ADAR1 and its mutant and cell lysates were analyzed by western blot using antibodies against(a) PCNA (**, ADAR1/mutant = 2.01 ± 0.21, p<0.01, n = 3), (b) PRPF19 (**, ADAR1/mutant = 1.76 ± 0.12, p < 0.01, n = 3), (c) XRCC5 (**, ADAR1/mutant = 1.6 ± 0.2, p < 0.01, n = 3), and (d) Exportin-5 (**,ADAR1/mutant = 1.56 ± 0.16, p < 0.01, n = 3). The blots were digitalized by ImageJ software and intensities normalized with tubulin.
Enhanced cell proliferation with ADAR1 overexpression in 293T cells and A549 cells
To support the results from quantitative proteomics, 5-Ethynyl-2′deoxyuridine (EDU) and 3-(4,5-dimethylthiazol-2-yl)-2, 5-diphenyl tetrazolium bromide (MTT) were used to measure the proliferation of HEK293T cells and A549 cells with or without ADAR1 overexpression. EDU was previously shown to label the newly synthesized DNA by a red fluorescence color and used to quantitatively measure cell proliferation.39 In our study, the total DNA was also determined by staining with Hoechst 33342 to normalize HEK293T cells with and without ADAR1 overexpression. The ratio of HEK293T cells between EDU and Hoechst fluorescent signals was 0.58 ± 0.08 with and 0.26 ± 0.04 without ADAR1 overexpression; the ratio of A549 cells between EDU and Hoechst fluorescent signals was 0.24 ± 0.04 with and 0.15 ± 0.01 without ADAR1 overexpression (Fig. 6a and b). In consistent with the conclusion from quantitative proteomics, ADAR1 overexpression upregulated PtdIns of HEK293T cell (p < 0.01, n = 3) and cell proliferation of A549 cells for 1.6-fold (p<0.01, n = 3).
Figure 6.

Cellular assay to confirm that ADAR1 over-expression promotes cell proliferation. HEK293T cells and A549 cells were transfected with ADAR1 and the mutant. (a) Edu (red) was used to detect the proliferating cells by labeling the newly synthesized DNA, and Hoechst 33342 (blue) to measure the background by staining total cellular DNA. Images were acquired using a fluorescence microscope (magnification: 200x; scale bar = 50 μm). (b) The images were digitalized using Image-Pro Plus 6.0 to quantify the fluorescence signals from EdU and Hoechst. The ratio(EdU/Hoechst) was used to evaluate newly synthesized and total DNA or the levels of cell proliferation. The ratio of HEK293T cells between EDU and Hoechst fluorescent signals was 0.58±0.08 with and 0.26 ± 0.04 without ADAR1 overexpression (**, p < 0.01, n = 3); the ratio of A549 cells between EDU and Hoechst fluorescent signals was 0.24 ± 0.04 with and 0.15 ± 0.01 without ADAR1 overexpression (**, p < 0.01, n = 3). (c) MTT assay. The results of MTT cell proliferation assay showed that the proliferation index (PtdIns) of HEK293T cells was 1.59 ± 0.20 with and 0.79 ± 0.10 without ADAR1 overexpression (***, p < 0.001, n = 5); the PI of A549 cells was 0.96 ± 0.14 with and 0.59 ± 0.14 without ADAR1 overexpression (***, p<0.001, n = 5).
MTT can also be used for cell proliferation assay.14,15 The results of MTT cell proliferation assay showed that the proliferation index (PtdIns)15 of HEK293T cells was 1.59 ± 0.20 with and 0.79 ± 0.10 without ADAR1 overexpression; the PI of A549 cells was 0.96±0.14 with and 0.59 ± 0.14 without ADAR1 overexpression (Fig. 6c). With MTT assay, ADAR1 overexpression upregulated PtdIns of HEK293T cells for 2.0-fold (p < 0.001, n = 5) and PI of A549 cells for 1.6-fold (p < 0.001, n = 5).
Conclusions
By shotgun proteomics and label-free quantification, we identified 211 up- and 159 downregulated proteins in HEK293T cells with ADAR1 overexpression. Ontological analysis demonstrated that these ADAR1-regulated proteins were closely related to protein translation and cell cycle regulation. Protein interaction analysis indicated that the ADAR1-regulated proteins were well connected through the protein translation and cell cycle networks to regulate cell proliferation. Upregulation of the proteins in the PCNA-mediated cell proliferation network including PCNA, XRCC5, PRPF19 and a nucleocytoplasmic shuttling protein Exportin-5 were further validated by protein gel blot analysis. Finally, enhanced proliferation was confirmed by labeling the newly synthesized DNA of HEK293T cells and A549 cells with ADAR1 overexpression. Taken together, the molecular and cellular functions of the ADAR1-regulated proteins were summarized in a putative diagram (Fig. 7).
Figure 7.
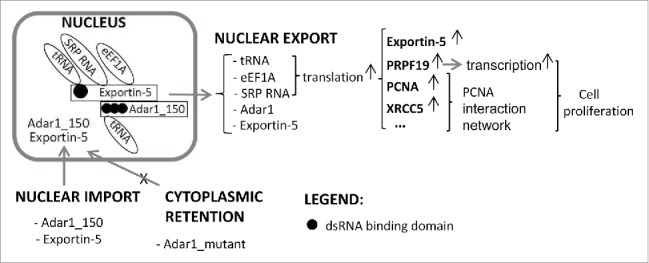
A putative diagram of cell proliferation affected by ADAR1 overexpression. In the putative diagram, overexpression of the nucleocytoplasmic shuttling protein ADAR1 enhanced the function of exportin-5 and accelerates the exportation of proteins for the translation machinery, which upregulates the protein translation and cell cycle networks through the PCNA interaction network, leading to cell proliferation.
Supplementary Material
Abbreviations
- ADAR1
Adenosine deaminase acting on dsRNA (full-length ADAR1)
- Mutant
ADAR1 without a deaminase domain
- NLS-c
nuclear localization signal
- PCNA
Proliferating cell nuclear antigen
- STRING
Search Tool for the Retrieval of Interacting Genes.
Disclosure of potential conflicts of interest
No potential conflicts of interest were disclosed.
Acknowledgments
This study was the result of work partially supported with the resources and facilities of the VA Boston Healthcare System, USA, and of the Cancer Research Center, Shandong University, China.
Funding
This work was supported by grants from the National Natural Science Foundation of China (#31471322 and #30928031) and Shandong Province Major Science and Technology Project (2015ZDXX0802A02).
References
- [1].Eckmann CR, Jantsch MF. The RNA-editing enzyme ADAR1 is localized to the nascent ribonucleoprotein matrix on Xenopus lampbrush chromosomes but specifically associates with an atypical loop. J Cell Biol 1999; 144:603-15; PMID:10037784; http://dx.doi.org/ 10.1083/jcb.144.4.603 [DOI] [PMC free article] [PubMed] [Google Scholar]
- [2].Patterson JB, Thomis DC, Hans SL, Samuel CE. Mechanism of interferon action: double-stranded RNA-specific adenosine deaminase from human cells is inducible by alpha and gamma interferons. Virol 1995; 210:508-11; PMID:7618288; http://dx.doi.org/ 10.1006/viro.1995.1370 [DOI] [PubMed] [Google Scholar]
- [3].Weier HU, George CX, Greulich KM, Samuel CE. The interferon-inducible, double-stranded RNA-specific adenosine deaminase gene (DSRAD) maps to human chromosome 1q21.1-21.2. Genomics 1995; 30:372-5; PMID:8586444; http://dx.doi.org/ 10.1006/geno.1995.0034 [DOI] [PubMed] [Google Scholar]
- [4].Nie Y, Zhao Q, Su Y, Yang JH. Subcellular distribution of ADAR1 isoforms is synergistically determined by three nuclear discrimination signals and a regulatory motif. J Biol Chem 2004; 279:13249-55; PMID:14711814; http://dx.doi.org/ 10.1074/jbc.M312753200 [DOI] [PubMed] [Google Scholar]
- [5].Hartner JC, Walkley CR, Lu J, Orkin SH. ADAR1 is essential for the maintenance of hematopoiesis and suppression of interferon signaling. Nat Immunol 2009; 10:109-15; PMID:19060901; http://dx.doi.org/ 10.1038/ni.1680 [DOI] [PMC free article] [PubMed] [Google Scholar]
- [6].John L, Samuel CE. Induction of stress granules by interferon and down-regulation by the cellular RNA adenosine deaminase ADAR1. Virol 2014; 454:299-310; PMID:24725957; http://dx.doi.org/ 10.1016/j.virol.2014.02.025 [DOI] [PMC free article] [PubMed] [Google Scholar]
- [7].Mannion NM, Greenwood SM, Young R, Cox S, Brindle J, Read D, Nellåker C, Vesely C, Ponting CP, McLaughlin PJ, et al.. The RNA-editing enzyme ADAR1 controls innate immune responses to RNA. Cell Rep 2014; 9:1482-94; PMID:25456137; http://dx.doi.org/ 10.1016/j.celrep.2014.10.041 [DOI] [PMC free article] [PubMed] [Google Scholar]
- [8].Liddicoat BJ, Piskol R, Chalk AM, Ramaswami G, Higuchi M, Hartner JC, Li JB, Seeburg PH, Walkley CR. RNA editing by ADAR1 prevents MDA5 sensing of endogenous dsRNA as nonself. Science 2015; 349:1115-20; PMID:26275108; http://dx.doi.org/ 10.1126/science.aac7049 [DOI] [PMC free article] [PubMed] [Google Scholar]
- [9].Pestal K, Funk CC, Snyder JM, Price ND, Treuting PM, Stetson DB. Isoforms of RNA-editing enzyme ADAR1 independently control nucleic acid sensor MDA5-driven autoimmunity and multi-organ development. Immunity 2015; 43:933-44; PMID:26588779; http://dx.doi.org/ 10.1016/j.immuni.2015.11.001 [DOI] [PMC free article] [PubMed] [Google Scholar]
- [10].Wang Q, Miyakoda M, Yang W, Khillan J, Stachura DL, Weiss MJ, Nishikura K. Stress-induced apoptosis associated with null mutation of ADAR1 RNA editing deaminase gene. J Biol Chem 2004; 279:4952-61; PMID:14613934; http://dx.doi.org/ 10.1074/jbc.M310162200 [DOI] [PubMed] [Google Scholar]
- [11].XuFeng R, Boyer MJ, Shen H, Li Y, Yu H, Gao Y, Yang Q, Wang Q, Cheng T. ADAR1 is required for hematopoietic progenitor cell survival via RNA editing. Proc Natl Acad Sci U S A 2009; 106:17763-8; http://dx.doi.org/ 10.1073/pnas.0903324106 [DOI] [PMC free article] [PubMed] [Google Scholar]
- [12].Katayama S, Shimoda K, Takenaga Y. Loss of ADAR1 in human iPS cells promotes caspase3-mediated apoptotic cell death. Genes Cells 2015; 20:675-80; http://dx.doi.org/ 10.1111/gtc.12261 [DOI] [PubMed] [Google Scholar]
- [13].Momcilovic O, Choi S, Varum S, Bakkenist C, Schatten G, Navara C. Ionizing radiation induces ataxia telangiectasia mutated-dependent checkpoint signaling and G(2) but not G(1) cell cycle arrest in pluripotent human embryonic stem cells. Stem Cells 2009; 27:1822-35; PMID:19544417; http://dx.doi.org/ 10.1002/stem.123 [DOI] [PMC free article] [PubMed] [Google Scholar]
- [14].Osibote E, Noah N, Sadik O, McGee D, Ogunlesi M. Electrochemical sensors, MTT and immunofluorescence assays for monitoring the proliferation effects of cissus populnea extracts on Sertoli cells. Reprod Biol Endocrinol 2011; 9:65; http://dx.doi.org/ 10.1186/1477-7827-9-65 [DOI] [PMC free article] [PubMed] [Google Scholar]
- [15].Verma A, Prasad KN, Singh AK, Nyati KK, Gupta RK, Paliwal VK. Evaluation of the MTT lymphocyte proliferation assay for the diagnosis of neurocysticercosis. J Microbiol Methods 2010; 81:175-8; PMID:20211664; http://dx.doi.org/ 10.1016/j.mimet.2010.03.001 [DOI] [PubMed] [Google Scholar]
- [16].Mi H, Muruganujan A, Casagrande JT, Thomas PD. Large-scale gene function analysis with the PANTHER classification system. Nat Protocols 2013; 8:1551-66; PMID:23868073; http://dx.doi.org/ 10.1038/nprot.2013.092 [DOI] [PMC free article] [PubMed] [Google Scholar]
- [17].Szklarczyk D, Franceschini A, Kuhn M, Simonovic M, Roth A, Minguez P, Doerks T, Stark M, Muller J, Bork P, et al.. The STRING database in 2011: functional interaction networks of proteins, globally integrated and scored. Nucleic Acids Res 2011; 39:D561-8; PMID:21045058; http://dx.doi.org/ 10.1093/nar/gkq973 [DOI] [PMC free article] [PubMed] [Google Scholar]
- [18].Xu H, Zhang P, Liu L, Lee MY. A novel PCNA-binding motif identified by the panning of a random peptide display library. Biochem 2001; 40:4512-20; PMID:11284708; http://dx.doi.org/ 10.1021/bi010103+ [DOI] [PubMed] [Google Scholar]
- [19].Warbrick E. The puzzle of PCNA's many partners. Bio Essays 2000; 22:997-1006; PMID:11056476. [DOI] [PubMed] [Google Scholar]
- [20].Jonsson ZO, Hindges R, Hubscher U. Regulation of DNA replication and repair proteins through interaction with the front side of proliferating cell nuclear antigen. EMBO J 1998; 17:2412-25; PMID:9545252; http://dx.doi.org/ 10.1093/emboj/17.8.2412 [DOI] [PMC free article] [PubMed] [Google Scholar]
- [21].Theron L, Gueugneau M, Coudy C, Viala D, Bijlsma A, Butler-Browne G, Maier A, Béchet D, Chambon C. Label-free quantitative protein profiling of vastus lateralis muscle during human aging. Mol Cell Proteomics 2014; 13:283-94; http://dx.doi.org/ 10.1074/mcp.M113.032698 [DOI] [PMC free article] [PubMed] [Google Scholar]
- [22].Chanarat S, Seizl M, Strasser K. The Prp19 complex is a novel transcription elongation factor required for TREX occupancy at transcribed genes. Genes Dev 2011; 25:1147-58; PMID:21576257; http://dx.doi.org/ 10.1101/gad.623411 [DOI] [PMC free article] [PubMed] [Google Scholar]
- [23].Yin J, Zhu JM, Shen XZ. New insights into pre-mRNA processing factor 19: a multi-faceted protein in humans. Biol Cell / Under Auspices Euro Cell Biol Organ 2012; 104:695-705; PMID:22967061; http://dx.doi.org/ 10.1111/boc.201200011 [DOI] [PubMed] [Google Scholar]
- [24].Zhang N, Kaur R, Lu X, Shen X, Li L, Legerski RJ. The Pso4 mRNA splicing and DNA repair complex interacts with WRN for processing of DNA interstrand cross-links. J Biol Chem 2005; 280:40559-67; PMID:16223718; http://dx.doi.org/ 10.1074/jbc.M508453200 [DOI] [PubMed] [Google Scholar]
- [25].Lu X, Legerski RJ. The Prp19/Pso4 core complex undergoes ubiquitylation and structural alterations in response to DNA damage. Biochem Biophys Res Commun 2007; 354:968-74; PMID:17276391; http://dx.doi.org/ 10.1016/j.bbrc.2007.01.097 [DOI] [PMC free article] [PubMed] [Google Scholar]
- [26].Rajaei M, Saadat I, Omidvari S, Saadat M. Association between polymorphisms at promoters of XRCC5 and XRCC6 genes and risk of breast cancer. Medical Oncol 2014; 31:885; PMID:24615008; http://dx.doi.org/ 10.1007/s12032-014-0885-8 [DOI] [PubMed] [Google Scholar]
- [27].Hosoi Y, Watanabe T, Nakagawa K, Matsumoto Y, Enomoto A, Morita A, Nagawa H, Suzuki N. Up-regulation of DNA-dependent protein kinase activity and Sp1 in colorectal cancer. Int J Oncol 2004; 25:461-8; PMID:15254745. [PubMed] [Google Scholar]
- [28].Chang HW, Kim SY, Yi SL, Son SH, Song do Y, Moon SY, Kim JH, Choi EK, Ahn SD, Shin SS, et al.. Expression of Ku80 correlates with sensitivities to radiation in cancer cell lines of the head and neck. Oral oncol 2006; 42:979-86; PMID:16472552; http://dx.doi.org/ 10.1016/j.oraloncology.2005.12.016 [DOI] [PubMed] [Google Scholar]
- [29].Ali-Fehmi R, Chatterjee M, Ionan A, Levin NK, Arabi H, Bandyopadhyay S, Shah JP, Bryant CS, Hewitt SM, O'Rand MG, et al.. Analysis of the expression of human tumor antigens in ovarian cancer tissues. Cancer Biomarkers 2010; 6:33-48; PMID:20164540. [DOI] [PMC free article] [PubMed] [Google Scholar]
- [30].Alekseev OM, Richardson RT, Tsuruta JK, O'Rand MG. Depletion of the histone chaperone tNASP inhibits proliferation and induces apoptosis in prostate cancer PC-3 cells. Reprod Biol Endocrinol 2011; 9:50; http://dx.doi.org/ 10.1186/1477-7827-9-50 [DOI] [PMC free article] [PubMed] [Google Scholar]
- [31].Zhang MY, Huang NN, Clawson GA, Osmani SA, Pan W, Xin P, Razzaque MS, Miller BA. Involvement of the fungal nuclear migration gene nudC human homolog in cell proliferation and mitotic spindle formation. Exp Cell Res 2002; 273:73-84; PMID:11795948; http://dx.doi.org/ 10.1006/excr.2001.5414 [DOI] [PubMed] [Google Scholar]
- [32].Chen YQ, Li TY, Qu SH, Tang XJ. [Expression and effects of nuclear distribution C (NUDC) protein in nasopharyngeal carcinoma cell lines]. Ai Zheng = Aizheng = Chinese J Cancer 2006; 25:708-12. [PubMed] [Google Scholar]
- [33].Suzuki SO, McKenney RJ, Mawatari SY, Mizuguchi M, Mikami A, Iwaki T, Goldman JE, Canoll P, Vallee RB. Expression patterns of LIS1, dynein and their interaction partners dynactin, NudE, NudEL and NudC in human gliomas suggest roles in invasion and proliferation. Acta Neuropathologica 2007; 113:591-9; PMID:17221205; http://dx.doi.org/ 10.1007/s00401-006-0180-7 [DOI] [PubMed] [Google Scholar]
- [34].Liu Y, Sun J, Yang G, Liu Z, Guo S, Zhao R, Xu K, Wu X, Zhang Z. Downregulation of the expression of HDGF attenuates malignant biological behaviors of hilar cholangiocarcinoma cells. Mol Med Reports 2015; 12:4713-9; PMID:26081074. [DOI] [PubMed] [Google Scholar]
- [35].Giri K, Pabelick CM, Mukherjee P, Prakash YS. Hepatoma derived growth factor (HDGF) dynamics in ovarian cancer cells. Apoptosis 2015; 21(3):329-39; http://dx.doi.org/ 10.1007/s10495-015-1200-7 [DOI] [PubMed] [Google Scholar]
- [36].Kishima Y, Yamamoto H, Izumoto Y, Yoshida K, Enomoto H, Yamamoto M, Kuroda T, Ito H, Yoshizaki K, Nakamura H. Hepatoma-derived growth factor stimulates cell growth after translocation to the nucleus by nuclear localization signals. J Biol Chem 2002; 277:10315-22; PMID:11751870; http://dx.doi.org/ 10.1074/jbc.M111122200 [DOI] [PubMed] [Google Scholar]
- [37].Calado A, Treichel N, Muller EC, Otto A, Kutay U. Exportin-5-mediated nuclear export of eukaryotic elongation factor 1A and tRNA. EMBO J 2002; 21:6216-24; PMID:12426393; http://dx.doi.org/ 10.1093/emboj/cdf620 [DOI] [PMC free article] [PubMed] [Google Scholar]
- [38].Takeiwa T, Taniguchi I, Ohno M. Exportin-5 mediates nuclear export of SRP RNA in vertebrates. Genes Cells 2015; 20:281-91; http://dx.doi.org/ 10.1111/gtc.12218 [DOI] [PMC free article] [PubMed] [Google Scholar]
- [39].Flomerfelt FA, Gress RE. Analysis of cell proliferation and homeostasis using EdU labeling. Methods Mol Biol 2016; 1323:211-20; PMID:26294411; http://dx.doi.org/ 10.1007/978-1-4939-2809-5_18 [DOI] [PMC free article] [PubMed] [Google Scholar]
Associated Data
This section collects any data citations, data availability statements, or supplementary materials included in this article.