Abstract
Aim:
The PreFRP web server extracts sequence and basic information of a protein structure and groups amino acid residues in a protein into three important types such as high, moderate, and weak fluctuating residues.
Materials and Methods:
The server takes a protein data bank file or an amino acid sequence as input and prints the probability of amino acid residues to fluctuate. The server also provides a link to Jmol, a molecular visualization program to visualize the high, moderate, and weak fluctuating residues in three different colors.
Results:
Prediction and visualization of fluctuating amino acid residues in proteins may help to understand the complex three-dimensional structure of proteins and may further help in docking and mutation experiments.
Availability:
The web server is freely accessible through the web page of the author's institution http://www.mpi.edu.in/prefrp/link.html.
Key words: Binding site, carbon content, conformation change, fluctuation residues, intrinsic disorder
INTRODUCTION
Identifying potential binding sites of the proteins is a challenging task for the computational molecular biologists. There are different methods to identify the binding sites of the given protein structure such as homology-based approach,[1] energy-based approach,[2] and surface area-based approach.[3] All the methods incorporate the information about the amino acid flexibility or rigidity to predict the binding sites of a protein. Conformational changes upon protein-protein binding play a vital role in the functioning of proteins in the cell.[4] There is a variety of conformational changes such as residue fluctuations, domain motions, physico-chemical changes, secondary structural changes, and disordered to ordered transitions.[5,6,7,8,9,10] Several statistical models are available to study residue fluctuations in protein structures to understand molecular recognition processes, which are discussed in many papers.[11,12,13]
The fluctuating nature of intrinsically disordered proteins is believed to contribute to binding with other proteins to perform numerous cellular functions. Identification of fluctuation residues can be done by studying various parameters such as size, B-factors, crystal packing, and physico-chemical properties of amino acid residues.[12] In the present work, we have developed a probability-based method which relies on carbon content and grouping of high, moderate, and weak fluctuating residues in a given protein databank file. The carbon content of amino acid residues in proteins may help to classify residues into hydrophobic and hydrophilic.[14,15,16,17,18] Considering the above facts, we have developed a web server to identify the fluctuation residues in proteins which may help in finding binding sites, disordered regions, and understand the role of amino acid residues in forming compact functional three-dimensional structures of proteins.
METHODS
The amino acid sequence and Protein Data Bank[19] file is used as input. The input coordinate file is then processed to extract basic information such as protein name, number of residues, source organism, and experiment used to solve the structure. The number of carbons present in each residue is calculated. Based on the carbon content of the residue and classification of 20 amino acid residues into high (G, A, S, P, and D), moderate (T, E, N, K, C, Q, R, and V), and weak fluctuating residues (H, L, M, I, Y, F, and W), amino acid residues are ranked in a protein by using the following formula.

Where,
P is the probability of an amino acid to fluctuate
Nc is the Number of carbon atoms in a residue i
N is the total number of atoms in a residue i
Rc is the Rank constant based on Ruvinsky et al., (2010) classification of fluctuating residues
For high fluctuating, Rc is –2; moderate, Rc is –1; and weak, Rc is 2
WEB SERVER
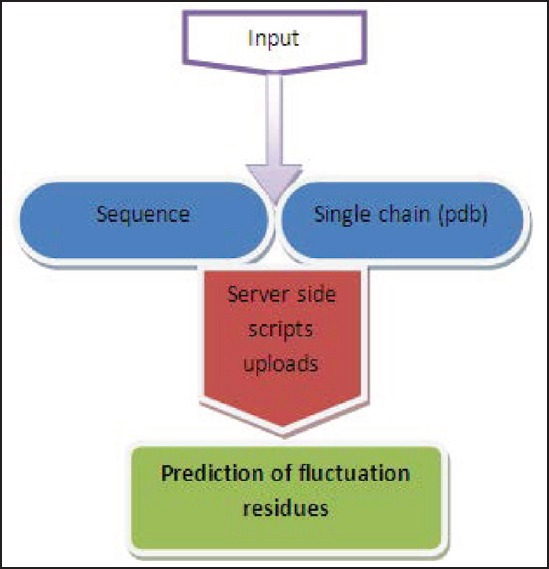
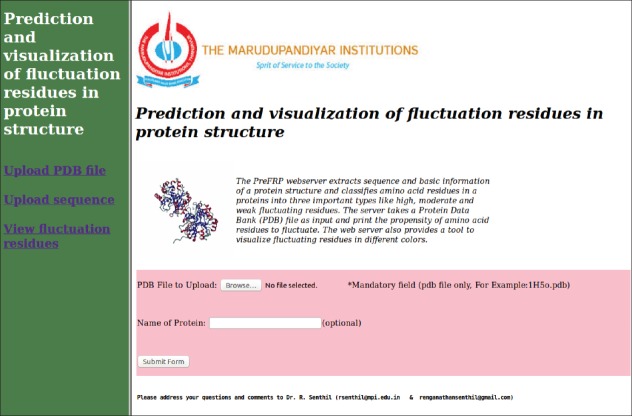
The web server allows a user to upload a sequence or protein data bank file to identify fluctuating residues in proteins. The server computes sequence composition, probability of the residue fluctuations, prediction of secondary structure propensity, percentage of carbon atom and fluctuated residues in protein sequence, and prediction of residue-residue mediation potential. The schematic design of the web server is represented as a flowchart in Figure 1. The screen shot of the web server is shown in Figure 2. Furthermore, the fluctuation residues can be visualized in three colors by clicking the “View fluctuation residues” link present in the left panel of the main page.
Figure 1.

Schematic design of webserver
Figure 2.
Screenshot of the webserver
IMPLEMENTATION AND ACCESS
The web server has been developed using CGI PERL programs. Processes such as the extraction of amino acid sequences, calculation of propensity, prediction of secondary structure, and mediation potential were done using PERL in Linux. The main page “form,” results, and information page were designed using HTML. The web server is freely accessible from the institution page of the author, at http://www.mpi.edu.in/prefrp/link.html.
ADVANTAGES
The information provided by the web server may help the user to carry out further structural and conformational analysis on proteins. Furthermore, the probability scores provided on the results page are very helpful for users who wish to perform docking, mutation, or dynamics studies. A link to Jmol is also presented using which a user can view the fluctuation residues in three-dimension.[20]
LIMITATIONS
Due to storage limitations in the server, the protein coordinates files cannot be fetched from the server and should be accessed from RCSB. Furthermore, the server does not have precomputed results.
Financial support and sponsorship
Nil.
Conflicts of interest
There are no conflicts of interest.
Acknowledgments
K.M. Saravanan thanks University Grants Commission for the award of Dr. D.S. Kothari Post-Doctoral Fellowship (Grant No. F.13-932/2013 [BSR]).
REFERENCES
- 1.Laurie AT, Jackson RM. Q-SiteFinder: An energy-based method for the prediction of protein-ligand binding sites. Bioinformatics. 2005;21:1908–16. doi: 10.1093/bioinformatics/bti315. [DOI] [PubMed] [Google Scholar]
- 2.Gromiha MM, Yokota K, Fukui K. Energy based approach for understanding the recognition mechanism in protein-protein complexes. Mol Biosyst. 2009;5:1779–86. doi: 10.1039/B904161N. [DOI] [PubMed] [Google Scholar]
- 3.Jones S, Thornton JM. Analysis of protein-protein interaction sites using surface patches. J Mol Biol. 1997;272:121–32. doi: 10.1006/jmbi.1997.1234. [DOI] [PubMed] [Google Scholar]
- 4.Ruvinsky AM, Kirys T, Tuzikov AV, Vakser IA. Structure fluctuations and conformational changes in protein binding. J Bioinform Comput Biol. 2012;10:1241002. doi: 10.1142/S0219720012410028. [DOI] [PMC free article] [PubMed] [Google Scholar]
- 5.Koshland DE., Jr Enzyme flexibility and enzyme action. J Cell Comp Physiol. 1959;54:245–58. doi: 10.1002/jcp.1030540420. [DOI] [PubMed] [Google Scholar]
- 6.Dunker AK, Lawson JD, Brown CJ, Williams RM, Romero P, Oh JS, et al. Intrinsically disordered protein. J Mol Graph Model. 2001;19:26–59. doi: 10.1016/s1093-3263(00)00138-8. [DOI] [PubMed] [Google Scholar]
- 7.Tsai CJ, Kumar S, Ma B, Nussinov R. Folding funnels, binding funnels, and protein function. Protein Sci. 1999;8:1181–90. doi: 10.1110/ps.8.6.1181. [DOI] [PMC free article] [PubMed] [Google Scholar]
- 8.Csermely P, Palotai R, Nussinov R. Induced fit, conformational selection and independent dynamic segments: An extended view of binding events. Trends Biochem Sci. 2010;35:539–46. doi: 10.1016/j.tibs.2010.04.009. [DOI] [PMC free article] [PubMed] [Google Scholar]
- 9.Saravanan KM, Balasubramanian H, Nallusamy S, Samuel S. Sequence and structural analysis of two designed proteins with 88% identity adopting different folds. Protein Eng Des Sel. 2010;23:911–8. doi: 10.1093/protein/gzq070. [DOI] [PubMed] [Google Scholar]
- 10.M Saravanan K, Selvaraj S. Search for identical octapeptides in unrelated proteins: Structural plasticity revisited. Biopolymers. 2012;98:11–26. doi: 10.1002/bip.21676. [DOI] [PubMed] [Google Scholar]
- 11.Bahar I, Atilgan AR, Demirel MC, Erman B. Vibrational dynamics of folded proteins: Significance of slow and fast motions in relation to function and stability. Phys Rev Lett. 1998;80:2733. [Google Scholar]
- 12.Ruvinsky AM, Vakser IA. Sequence composition and environment effects on residue fluctuations in protein structures. J Chem Phys. 2010;133:155101. doi: 10.1063/1.3498743. [DOI] [PMC free article] [PubMed] [Google Scholar]
- 13.Yogurtcu ON, Gur M, Erman B. Statistical thermodynamics of residue fluctuations in native proteins. J Chem Phys. 2009;130:095103. doi: 10.1063/1.3078517. [DOI] [PubMed] [Google Scholar]
- 14.Senthil R, Rajasekaran E. Comparative analysis of carbon distribution and hydropathy plot. J Adv Biotech. 2009;8:30–1. [Google Scholar]
- 15.Rajasekaran E, Rajadurai M, Vinobha C.S, Senthil R. Are the proteins being hydrated during evolution? J Comput Intell Bioinform. 2008;1:115–8. [Google Scholar]
- 16.Senthil R, Rajasekaran E. Carbon distribution in enzymes involved in neural disorder. J Res Dev. 2009;6:6–11. [Google Scholar]
- 17.Jayaraj V, Vijayasarathy M, Geerthana R, Senthil R, Rajasekaran E. Pattern recognition in proteins based on carbon content. J Comput Intell Bioinform. 2009;2:99–102. [Google Scholar]
- 18.Senthil R, Rajasekaran E. (2012) Computational studies on role of carbon atom in proteins – Phenylalanine hydroxylase protein. J Comput Intell Bioinform. 2012;5:189–92. [Google Scholar]
- 19.Berman HM, Westbrook J, Feng Z, Gilliland G, Bhat TN, Weissig H, et al. The protein data bank. Nucleic Acids Res. 2000;28:235–42. doi: 10.1093/nar/28.1.235. [DOI] [PMC free article] [PubMed] [Google Scholar]
- 20.Hanson RM. Jmol – A paradigm shift in crystallographic visualization. J Appl Cryst. 2010;43:1250–60. [Google Scholar]


