

Abstract
Cell-penetrating and antimicrobial peptides show remarkable ability to translocate across physiological membranes. Along with factors such as electric potential induced-perturbations of membrane structure and surface tension effects, experiments invoke pore-like membrane configurations during the solute transfer process into vesicles and cells. The initiation and formation of pores are associated with a non-trivial free energy cost, thus necessitating consideration of the factors associated with pore formation and attendant free energetics. Due to experimental and modeling challenges related to the long timescales of the translocation process, we use umbrella-sampling molecular dynamics simulations with a lipid-density based order parameter to investigate membrane pore-formation free energy employing Martini coarse-grained models. We investigate structure and thermodynamic features of the pore in 18 lipids spanning a range of head-groups, charge states, acyl chain lengths and saturation. We probe the dependence of pore-formation barriers on area per lipid, lipid bilayer thickness, membrane bending rigidities in three different lipid classes. The pore formation free energy in pure bilayers and peptide translocating scenarios are significantly coupled with bilayer thickness. Thicker bilayers require more reversible work to create pores. Pore formation free energy is higher in peptide-lipid systems relative to the peptide-free lipid systems due to penalties to maintain solvation of charged hydrophilic solutes within the membrane environment.

1 Introduction
Lipid bilayers are the building blocks used by living organisms to form their cell membrane. The lipid bilayers are extremely thin hydrophobic barriers, approximately 2–5 nm thick. They include diverse chemistry and have complex structure. The defects and pores within lipid bilayers are important but they are transient structures in membrane biology and in biotechnology.1–5 Creating a pore in a biomembrane is central to many biological processes including apoptosis, membrane fusion, transport of molecules and ions for drug delivery and gene therapy.2,6,7 Several physico-chemical methods including a) adding suitable chemical agents8 b) changing physical conditions via electroporation,9 osmotic shock,10 temperature jump,11 and c) adhesion on porous12 or decorated substrates,12 have been developed to increase membrane permeability. Since pores are transient, local, and their sizes are on the nanometer scale, 13–15 it is difficult to characterize them experimentally. However, molecular simulations can probe the molecular-level details of the mechanism and energetics of pore formation in a number of situations.2,15–18
The classic physical model that describes the change in free energy, ΔG to open a circular pore of radius r in membrane at constant surface tension, Γ, was proposed simultaneously by Litster19 and Taupin.20
| (1) |
The first term in equation 1 is the free energy cost of having an edge of perimeter length 2πr, the circumference of the circular pore, exposed to the surrounding medium. The proportionality constant Γl, is the line tension, which has dimension of force. The second term contains the surface tension, Γs, and is the gain in free energy achieved by reducing the membrane area by an amount πr2. Thus, the formation of a pore of radius, r involves a balance between two forces. Optimizing the above expression with respect to radius, r, one obtains a critical pore radius, r* = Γl/Γs. The free energy associated with this radius, r* for this model is ΔG(r*) = πΓl2/Γs, which is formally known as activation barrier of the pore formation process. Although the above model is simple and has an intuitive interpretation, it encounters limitations at small spatial scales. In particular, it ignores nucleation of a hydrophilic trans-membrane pore that involves a rearrangement of lipid molecules from an orientation parallel to membrane normal to perpendicular. Moreover, the model does not take into account microscopic details of the membrane components such as type of head and tail groups of lipid molecule, their length, degree of saturation etc.
To explore the free energy landscape of pore formation, the system must be manipulated in a more systematic fashion, since it is a rare event.1,3,17 Thus, it is extremely difficult and expensive to study the pore formation event using equilibrium atomistic molecular dynamics simulation. However, one can change the model and use enhanced sampling techniques to accelerate, or bias towards, pore formation; this may involve application of an external controlled force to realize the desired event. den Otter and coworkers proposed a method to calculate the free energy profile as function of the pore radius, under desired surface tension, and applied it to a coarse grained amphiphilic model for radii ranging from zero up to the start of the mesoscopic regime.17,18 In this method, they applied a constraint on the local lipid density to maintain pores of fixed sizes and calculate the Helmholtz free energy as a function of the pore radius, which is popularly known as potential of mean constraint force (PMCF) method.21 Tieleman and co-workers used atomistic models of lipid bilayers along with electroporation to enhance the permeability of cellular membrane22,23 by application of an electric field across the bilayer. They enhanced the permeability of cellular membranes by applying mechanical stress and, increased thermal fluctuations on an atomistic model of lipid bilayer by raising temperature.22,23 However, it is difficult to obtain pore formation energetics and there is no control over pore structure.
A broad class of peptidic systems termed cell-penetrating peptides (CPPs) continue to offer an intriguing opportunity to effect cell-specific internalization of molecular cargo with minimal cytotoxicity.24,25 Recent experiments such as x-ray with neutron-reflection,26 solid-state Nuclear Magnetic Resonance Spectroscopy (NMR),27 optical sectioning and state-of-the-art single-molecule microscopy,13 and conductance measurements28 explore the important interaction between CPPs and lipid phosphates that distorts the membrane structure and initiates pore formation. In particular, Wong et al showed that CPPs induce negative Gaussian curvature in actin-encapsulated giant vesicles without receptor,29,30 thus initiating pore formation to allow CPP translocation. Such experiments suggest that the formation of pores (or at the very least, some type of defects) within the membrane may be crucial for translocation of CPPs. Membrane-spanning water pores (i.e. aqueous conduits across the patch of membrane under scrutiny in the simulation) may perhaps be necessary structural elements for CPP translocation via diffusion-like processes.31 In addition to experiments, simulation studies provide insights about pore formation during CPP translocation. Using the all-atom GROMOS87 force field for peptide, Berger force field for lipid and SPC model for water, Huang et al observed an 80kJ/mol reduction in the translocation free energy barrier (from bulk water to bilayer center) due to formation of pores.16 The authors conclude that a water pore spanning the membrane bilayer can lower the free energy barrier relative to the case where only modest water defects (not spanning the entire membrane thickness) are possible. Using simulations with the MARTINI coarse grained model, we observe that a pore-forming pathway for nona-arginine translocation into DPPC lowered the free energy by 90 kJ/mol.15 The presence of a water pore is predicated on structural perturbations of the bilayer itself, and thus that study recapitulates a series of molecular dynamics studies highlighting the intimate connection between translocation of charged peptides in bilayers and some type of structural perturbation at the scales of single (or several) lipid molecules.32,33
Acknowledging the work of den Otter and coworkers, we follow a different approach to study the free energetics of pore formation. We use umbrella sampling molecular simulations and adopt an order parameter (OP) suggested in the work of Tolpekina et al.,17,18 constructing it as a collective variable (CV) to sample the system. The umbrella sampling technique utilizes a harmonic restraint potential which overcomes the sampling issue present in den Otter’s method. We implemented the above OP in PLUMED 2.0 tool and it was patched with Gromacs to perform umbrella sampling (US) simulations. We describe this method in detail in the next section. In the following section, we discuss results of our potentials of mean force (PMF) for pore formation and translocation of cyclic nonaarginine. The important findings and the conclusions of our study are recapitulated in the Summary Section.
The aim of this study is to highlight general trends associated with pore formation free energetics in model lipid bilayers that span a wide spectrum of headgroup types, chain lengths, saturation levels, area per lipid, and tensile properties (i.e. bending rigidities). To achieve sampling over sufficiently long time scales, we adopt coarse-grained force fields to extract observable trends; we address important caveats related to using coarse-grained models at appropriate points in the following discussion. By providing a broad study, we consider that a wide audience may be able to take away significant ideas that generally hold.
2 Methods
2.1 Simulation Details
We use Molecular Dynamics (MD) simulations to study free energetics and other properties related to pore formation in 18 different lipids: DSPC, DHPC, DLPC, DOPC, DOPE, DOPG, DOPS, POPC, POPE, POPG, POPS, DPPG, DHPS, DSPS, DLPS, DPPC, DPPE, DPPS. We explored the free energy cost for the formation of a simple, model pore inside model lipid bilayers along with the translocation of a cationic cell penetrating peptide (CPP), cyclic nonaarginine (Arg9) into such bilayers. We also addressed the structural properties of bilayers in this study. We present the results clustered into three broad classes based on the length, saturation of the hydrocarbon acyl chains and the charge state of the lipid headgroups.
The latest release of the non-polarizable Martini coarse-grained (CG) water model (version 2.2) in combination with the latest non-polarizable Martini lipid and ion model (version 2.0) as developed by Marrink et al34–36 were used to simulate interactions among system components. The Martini non-polarizable CG model is widely used to simulate biomolecular processes such as peptide translocation, vesicle fusion, lipid/surfactant self-assembly micelle formation, and transmembrane pore formation;15,22,37 as such, we employ this force field in order to maintain connection with these previous studies. We acknowledge that the newer polarizable Martini CG force field is a possible choice as well, and suggest future studies to compare pore formation related thermodynamics and structure in future work. The non-polarizable force field is able to characterize peptide-membrane-water-ion systems and capture salient structural and energetic aspects of membrane biophysics.32,35,38 We also mention the BMW-Martini model of Yethiraj and coworkers39,40 which is a competent force field for describing CPP systems; future work will address the properties of this force field in the context of pore formation thermodynamics. Parameters of lipid molecules such as DPPG, DHPS, DSPS, DLPS, DPPS are not available in the default force field. We use available head group and acyl chain force field parameters of lipid molecules to construct the force field of missing lipid molecules. The detailed set of parameters can be found in the Supplementary Information (SI).
All MD simulations were carried out using MPI supported GROMACS software package (version 4.6.3), single precision, patched with the latest version of PLUMED2.0. The simulation cell consists of a rectangular box with 256 lipid molecules (128 lipids per leaflet), surrounded by 7562 water and 150mM NaCl ions (82 sodium and 82 chloride ions). For the anionic lipid system, to keep the system charge neutral, 256 water molecules were substituted to sodium ions. Each lipid system was minimized using the steepest descent method and then equilibrated via constant particle, pressure and temperature (NPT) ensemble molecular dynamics simulations for 500 ns at 1 atm. All the simulations were carried out at 350 K for all lipid bilayers, above their liquid to gel phase transition temperatures (up to 328 K for DSPC). We used a time step of 20 fs and updated the neighbor list every ten steps. The Lennard-Jones (LJ) interactions were calculated by using simple spherical cutoff at a distance of 1.2 nm with a smooth switching function of distances 0.9 nm and 0.0 nm, respectively. The conditionally convergent long range electrostatic interactions was modeled by using PME method with a fourth-order spline and a 0.12 nm grid spacing. Since the non-polarizable Martini force field has been parameterized without PME, we performed an additional set of simulations using spherical cutoffs at a distance of 1.2 nm with a smooth switching function of distances 0.9 nm and 0 nm. The results obtained from the additional simulations are presented in SI (Figure S39–S45). The global dielectric constant εr = 15 is used for the non-polarizable Martini force fields. To maintain the temperature 350 K. we used the velocity rescaling scheme with time constants of τT = 1.0 ps. We used two temperature coupling groups: water and ions were considered as one, and lipids were set as the second group. We use the Parrinello-Rahman coupling scheme with τp = 12.0 ps to maintain the pressure of 1 atm for the systems. To keep the bilayer in a tensionless state, periodic boundary conditions with a semi-isotropic pressure coupling algorithm with a 3.0×10⁻⁴ bar−1 compressibility was used. The LINCS algorithm was used to apply the bond constraint present in Martini force fields.
Although literature reports suggest concerns about the current generation of Martini force field with regard to free energies of pore formation in bilayers, there are several advantages of this force field22 such as the efficiency; the Martini model allows us to perform rapid calculations for numerically intensive free energy calculation, and it successfully captures membrane properties. We stress that this work is aimed at providing a set of pore-formation free energies for various lipid types within a single force field as a reference; here we are not suggesting any judgment about the quality of the force field for use in studying systems in which pore formation occurs.
2.2 Definition of Transmembrane Pore Order Parameter
An unique definition (from both experimental and theoretical perspectives) of a pore in a membrane is in some sense unobtainable, thus necessitating a model of the pore. Here, we consider a pore as a cylindrical, hollow channel, with certain radius, spanning the bilayer across the two membrane leaflets.41,42 The pore allows free passage of water, ions and other components into and out of the membrane. Pore formation entails rearrangement of lipid headgroups resulting in a bilayer structure that may be significantly different from the unperturbed state. For instance, reorientation of headgroups from being orthogonal to the membrane interface to being parallel leads to hydrophilic headgroups lining a pore that can allow polar and charged species to translocate across the membrane.
It is a challenge to observe stable pores in lipids via brute-force molecular dynamics simulations. Pore formation is a rare (activated) event.17 Transmembrane pores are transient entities as indirectly suggested by experimental results. 1,3–5 Such pores are energetically unfavorable (linked to their rare occurrences) and difficult to define by a unique collective variable, or order parameter (OP) to control the pore radius in molecular simulations. In this study, we adapted the OP suggested in the work of Tolpekina et al.,17,18 constructed as a collective variable (CV) for umbrella sampling, and implemented in PLUMED 2.0 tool which is patched with Gromacs. The OP is defined as the weighted number density of lipid atoms surrounding the pore.
| (2) |
Here, ξ is the OP, Γ is the weighted number of lipid atoms, and Γξ=0 and Γξ=1 are the average weighted number of lipid atoms in the membrane at the equilibrated (no pore) state and at the fully-formed pore state with a target restraint radius, R, respectively. The weighting function for the lipid atoms is:
| (3) |
where |Δr⃗(i)| is the lateral distance of the lipid atom to the center of the pore, and Δx(i). Δy(i) are the x and y components of this distance, respectively. Since tanh(3.0) ≈ 1, to simplify the problem, we used a parameter α as a normalization factor of the defined pore radius R, where α = 3.0/R. Γξ=1 is simply the total number of lipid atoms. A harmonic biasing potential is used to restrain the OP ξ to a reference value ξref,
| (4) |
where, Ubias is the biasing potential and k is the force constant. The applied biasing force on atom i is:
| (5) |
Here, is the position vector of atom i. The three Cartesian components of F(r⃗i) are:
| (6) |
The classical virial contribution from the biasing force is Σ(Fi·ri), which was used to correct the total pressure of the system.
2.3 Umbrella Sampling of Membrane Pore Formation
Umbrella sampling (US) molecular dynamics simulations were carried out to study the pore formation free energy of 18 lipids. To obtain the PMFs of membrane pore formation, we used an in-house pore-formation collective variable (CV) code implemented into PLUMED 2.0 source code as the pore OP for lipids (details of this OP is described in above section 2.2). The OP is defined from equation 2 and 3. Γξ=0 and Γξ=1 are obtained from the average weighted number of all the CG lipid atoms. Various experimental and simulation studies13,15,43,44 indicate that the size of the trans-membrane pore is on the nanometer scale, and the suggested sizes are usually below 3.0 nm. We thus set a sufficiently large pore radius of 3.0 nm. Further tests (see Figure S37 in SI) show that pore formation free energy is independent of the choices of the ultimate pore radius (R) for this moderate size of membrane. For each lipid bilayer system, Γξ=0 is calculated from a 500ns equilibrated trajectory, and Γξ=1 is set to the values of total number of CG lipid atoms. We run 21 US windows that range from 0.0 to 1.0 at a spacing of 0.05 along this OP. Each window was sampled for 300 ns simulation time, starting from same initial unperturbed configuration of bilayer. The first 50 ns data for each window was considered as equilibration period and the last 250 ns data were used for free energy calculation. To ensure sufficient overlap of collective variable (OP) between neighboring windows, we employed an arithmetic sequence to assign window force constants. The force constant for the first window (OP=0.0) is set to 500 kJ/mol/nm2, and is sequentially incremented by 500 kJ/mol/nm2 for the adjacent window moving towards larger OP values. In this way, the force constant for the final window is (OP=1.0) 10500 kJ/mol/nm2.
2.4 Umbrella Sampling of Nonaarginine Translocation
Mechanisms of nonaarginine translocation through lipid bilayers using MD simulations have been explored using umbrella sampling methods with defined OPs that are generally coupled to the position of the translocating species along the membrane normal. Recent studies have addressed the influence of aqueous pores, or defects, on translocation free energetics. This leads to the consideration of a pore path and pore-free path where membrane has only water defects in the former and no such defects in the latter. The studies suggest a pore path is capable of assisting nonaarginine translocation through a lipid bilayer as the free energy barrier is less along this path.15,16 In this work, we selected the nonaarginine peptide as model peptide to investigate the relation of peptide assisted pore formation free energy and inherent pore formation free energy of model bilayers in the absence of solute. We use umbrella sampling molecular dynamics simulations to study the translocation of nonaarginine into each lipid bilayer system. We chose the z-dimension distance between the centers of mass of the peptide and bilayer as the OP, and we include 61 umbrella sampling windows ranging from 0.0 to 6.0 nm at a spacing of 0.1 nm along the chosen OP. We applied a harmonic potential with a force constant of 3000 kJ/mol/nm2 to restrain the peptide at each window. The initial configuration of pore in the membrane was generated from the method in our previous study.15 We gradually grow the peptide into the bilayer system at different values of z-position. We sampled each window for 300 ns simulation time, and the first 50 ns data for each window was again considered as equilibration period and rest 250 ns data were used for free energy calculation. The details of the window setup and umbrella sampling method have been described in detail in our recent work.15
By checking OP histograms of each simulation window, we ascertained that sufficient overlap of OP values between adjacent windows was maintained for both US simulations (see histograms in DPPC as an example in Figure S1 and S2 in SI). The weighted histogram analysis method (WHAM) was used for postsimulation unbiasing of umbrella sampling data in this work.45 The Visual Molecular Dynamics (VMD) package46 was used to monitor the simulation, visualization and graphics preparation for this work. The details of the system composition for pore formation and nonaarginine translocation are summarized in Table 1.
Table 1.
Description of initial setup of 18 different bilayer systems those are studied in this work. The table includes both the descriptions of pure and nonaarginine containing bilayer systems.
| Entry | Lipid | NL | Peptide-free Systems | Arg9 Systems | |||||||
|---|---|---|---|---|---|---|---|---|---|---|---|
| Water | Na+ | Cl− | Time | Arg9 | Water | Na+ | Cl− | Time | |||
| 1 | DSPC | 256 | 7562 | 82 | 82 | 300 ns | 1 | 7553 | 82 | 91 | 300 ns |
| 2 | DHPC | 256 | 7562 | 82 | 82 | 300 ns | 1 | 7553 | 82 | 91 | 300 ns |
| 3 | DLPC | 256 | 7562 | 82 | 82 | 300 ns | 1 | 7553 | 82 | 91 | 300 ns |
| 4 | DOPC | 256 | 7562 | 82 | 82 | 300 ns | 1 | 7553 | 82 | 91 | 300 ns |
| 5 | DOPE | 256 | 7562 | 82 | 82 | 300 ns | 1 | 7553 | 82 | 91 | 300 ns |
| 6 | DOPG | 256 | 7306 | 338 | 82 | 300 ns | 1 | 7297 | 338 | 91 | 300 ns |
| 7 | DOPS | 256 | 7306 | 338 | 82 | 300 ns | 1 | 7297 | 338 | 91 | 300 ns |
| 8 | POPC | 256 | 7562 | 82 | 82 | 300 ns | 1 | 7553 | 82 | 91 | 300 ns |
| 9 | POPE | 256 | 7562 | 82 | 82 | 300 ns | 1 | 7553 | 82 | 91 | 300 ns |
| 10 | POPG | 256 | 7306 | 338 | 82 | 300 ns | 1 | 7297 | 338 | 91 | 300 ns |
| 11 | POPS | 256 | 7306 | 338 | 82 | 300 ns | 1 | 7297 | 338 | 91 | 300 ns |
| 12 | DPPG | 256 | 7306 | 338 | 82 | 300 ns | 1 | 7297 | 338 | 91 | 300 ns |
| 13 | DHPS | 256 | 7306 | 338 | 82 | 300 ns | 1 | 7297 | 338 | 91 | 300 ns |
| 14 | DSPS | 256 | 7306 | 338 | 82 | 300 ns | 1 | 7297 | 338 | 91 | 300 ns |
| 15 | DLPS | 256 | 7306 | 338 | 82 | 300 ns | 1 | 7297 | 338 | 91 | 300 ns |
| 16 | DPPC | 256 | 7562 | 82 | 82 | 300 ns | 1 | 7553 | 82 | 91 | 300 ns |
| 17 | DPPE | 256 | 7562 | 82 | 82 | 300 ns | 1 | 7553 | 82 | 91 | 300 ns |
| 18 | DPPS | 256 | 7306 | 338 | 82 | 300 ns | 1 | 7297 | 338 | 91 | 300 ns |
3 Result and Discussion
3.1 Effect of the Transmembrane Pore Formation
3.1.1 Evolution of a Pore Formation in DPPC System
We begin with discussion of critical aspects of the pore formation process within the context of the chosen protocol. To understand the relation between pore formation and order parameter ξ under a harmonic restraint, we selected the widely studied DPPC model system as an example. We applied the harmonic restraint in 21 umbrella sampling windows with a spacing of 0.05 along the order parameter ξ. Figure 1 shows the snapshots along the evolution of the transmembrane pore along the OP ξ. The effective pore is successfully formed with a toroidal shape. The rim of the pore is decorated with the polar headgroups of the lipid molecules, and the hydrocarbon tails are shielded within the membrane. Once the pore is created, water and ions can move freely across the channel (See the Movie M1 in the SI). To characterize pore evolution along the OP ξ in a quantitative manner, we computed the time average density distribution ρ(r, z) of membrane atoms along the OP ξ (see Figure 2). We excluded the first 50 ns data which is regarded as equilibration period during the calculation. This membrane density distribution is further separated into headgroup (containing first 4 beads: NC3, PO4, GL1, GL2) and tail group (containing 8 beads: C1A, C2A, C3A, C4A, C1B, C2B, C3B, C4B) density distributions and those are shown in Figure S21. All density distributions ρ(r, z) of the upper and lower leaflets are symmetric for each window. This is because both leaflets contain equal number of atoms and the harmonic restraint is applied to all the lipid atoms of the bilayer, so that both leaflets experience almost equal amount of net biasing force. Figure 2 shows the gradual pore formation OP, ξ evolving from 0.0 to 1.0. When the average order parameter value < ξ > is smaller than 0.09, there is insignificant change in the density profiles as compared to the unperturbed equilibrated state. At < ξ >=0.13, the membrane starts to curve inward, and head- and tail-group densities begin to decrease at the center of the pore (lateral distance r=0 nm). The membrane surface becomes concave at values of < ξ > between 0.13 and 0.47, and the upper and lower leaflets gradually coalesce to complete formation of the pore. Figure S21 in SI shows the density map of headgroups, which is gradually decreasing at the center of the pore, and finally forms two distinct lobes of symmetric density distribution around the fully formed pore. The figure further demonstrates that the degree of negative curvature of the headgroups at the local region of pore region is developed smoothly. Tail-group density shows similar behavior. We also noticed that lipid headgroups move toward the interior of the membrane, and they are arranged into appropriate manner to adapt to the shape of the pore. The headgroups of both leaflets tend to coalesce at the pore region of the bilayer. The density of tail groups also shows similar behavior. Specifically, we noticed that the density of lipid tail groups starts decreasing at < ξ > = 0.41, indicating that the interactions among tail groups weaken at the pore region. Weakening of such interaction facilitates transmembrane channel formation observed at < ξ > = 0.47. Water molecules and ions move freely from one side of bilayer to the other. Lipid headgroups show similar behavior between 0.41 and 0.47 of < ξ >. Therefore, the values of < ξ > between 0.41 and 0.47 are regarded as a critical region of OP for the pore formation. Once the value of order parameter, < ξ > reaches the critical region, both head and tail groups rearrange and adopt a toroidal-shaped pore as depicted in Figure 1 and Figure 5. The pore radius progressively increases to the restrained size as the value of ξ increases. Along the pore formation path, we observe an apparent bilayer thinning. The thickness of membrane is gradually reduced at the local pore region, which is in agreement with experimental results47 and akin to local thinning effects in the context of hydrophobic mismatch arguments.48,49
Figure 1.
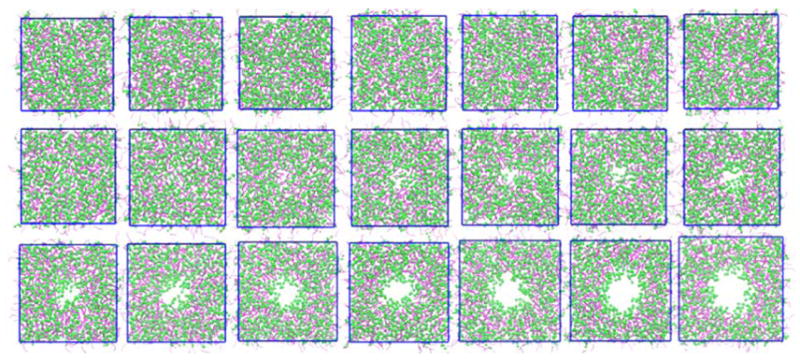
Snapshots of the evolution of pore formation in DPPC system(top view). The final configurations of each of the 20 umbrella sampling windows are shown in the figure. For the sake of clarity, water and ions are not shown. Lipid headgroups (containing first 4 beads: NC3, PO4, GL1, GL2) are represented as green spheres and tails (contains 8 beads: C1A, C2A, C3A, C4A, C1B, C2B, C3B, C4B) are represented as purple lines.
Figure 2.
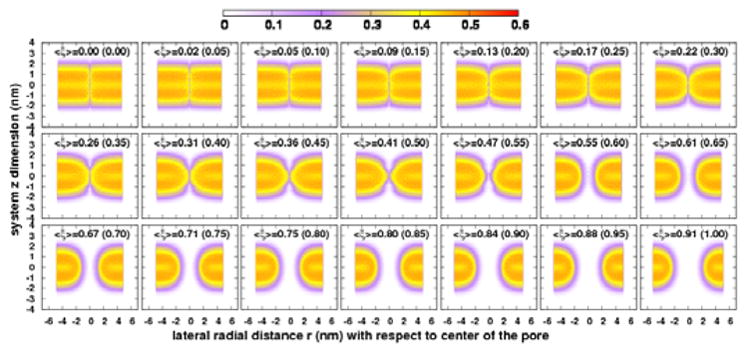
Two dimensional average number density map, ρ(r, z) of DPPC bilayer system for each of the 20 umbrella sampling windows are shown in the figure. The calculated average value of OP, < ξ > for each window is shown at top of the each panel. The values in the parentheses correspond the reference OP for each window. The value, r=0 corresponds the center of the pore in the lateral dimension, and z=0 represents the center of the bilayer in z dimension.
Figure 5.
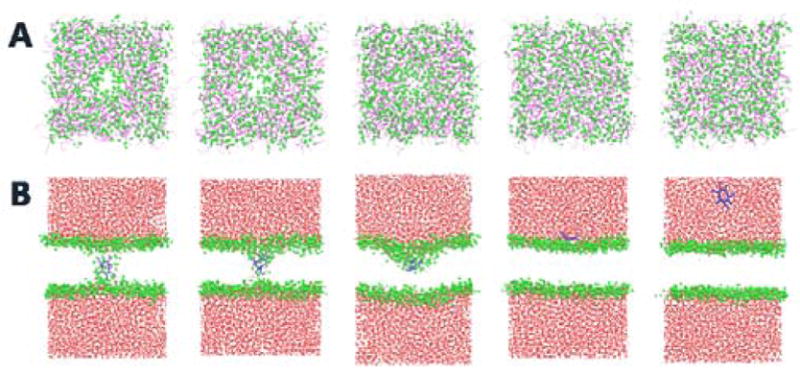
Snapshots of the nonaarginine translocation at different locations. From Left to right, the configurations correspond the z value of distance between the center of mass of peptide and the center of mass of the bilayer restrained at 0.0, 0.3, 0.5, 2.3, and 6.0 nm, respectively. (A) top view of the DPPC system at those locations. For the sake of clarity, water, ions and peptide are not shown. Lipid headgroups are represented as green spheres and tails are represented as purple lines. (B) side view of the corresponding configurations, Lipid tails are are not shown in the figure. Lipid headgroups are represented as green spheres and peptide Arg9 is represented as blue line, water and ions are represented as red points. Once the pore is formed, water and ions move freely into the pore regions.
3.1.2 Potential of Mean Force of a Pore Formation in DPPC System
Pore formation PMF as function of ξ for the DPPC system is shown in Figure 3A. We discuss characteristic features of Figure 3A. First, the free energy barrier to open a pore of radius of 3 nm is around 400 kJ/mol. Furthermore, it appears that the PMF is a combination of two quadratic functions, separated at a value of ξ=0.53. Such a feature of the pore-formation PMF has been reported by den Otter and co-workers using the PMCF method.17,18 However, this kink-like change in the PMF does not correlate exactly with the critical pore formation point discussed in the previous section. As suggested by the density distributions, the critical pore formation < ξ > should be between 0.41 and 0.47. This critical point indicates the formation of transmembrane pore or channel. Once the pore is opened up, the free energy barrier changes significantly from a steep surface to another quadratic surface. Moreover, we tested the sensitivity of free energy profiles on different choices of the pore radius for this system. The results are presented in the SI (Figure S37). We found that the free energy profiles are insensitive to the size of the pore. Moreover, the size of bilayer patches do not alter the PMF profile for pore formation (see Figure S38).
Figure 3.

(A) PMF of the pore formation for DPPC system. The vertical dash lines show the kink position in the PMF at ξ=0.53, and the critical pore formation OP ξ=0.46. (B) Solid line is the change in average lateral area per lipid of DPPC system as a function of the OP and dash line is the fitted polynomial functions of it. Panels (C) and (D) show the correlation between pore formation free energy (ΔG1) and bilayer thickness, and the nucleation free energy (ΔGpore) and bilayer thickness.
We further noticed that the lateral dimension of bilayer is increased during the pore formation. Figure 3B shows the change in average lateral area as a function of the pore formation OP, ξ. Two distinct regions are separated around the critical value of the OP, ξ. For ξ > 0.46, the lateral change in area linearly varies with the OP, ξ. However, beyond the kink position of PMF, the lateral area per lipid drops to a local minimum value, the favorable stable interaction gain resulting from the formation of the initial hydrophilic pore (lined with polar groups that are able to interact with the polar non-membrane components in the system). Following, the lateral area per lipid increases via polynomial dependence on ξ. The free energetic penalty for the expansion of the pore is in part from the elastic resistance of the membrane.
We connect the increase of bilayer lateral area to pore size. We assume that the increase in bilayer area comes from the circular area of a pore with radius Rnet. Under this assumption, we have converted the change in lateral area to the net radius of pore formed inside the membrane along the OP ξ for all the trajectories using . Figure S22 shows our estimated pore radius as function of ξ. The pore starts to form after ξ < 0.46. The actual size of the pore is thus closely approximated as a radius of 1.5 nm. After pore initiation, the net radius decreases slightly from 1.5 nm to 1.4 nm, and then the pore radius approaches its final value near 3 nm.
Our observed changes in lateral dimensions indicates that a constant area (NPAT) or volume (NVT) ensemble may lead to quantitatively different estimates of pore formation free energetics. With the growing of the pore, the lipid atoms are removed from the pore region, resulting in increase of the system lateral area. However, compared to the results obtained from all atom simulations of pore formation of DPPC model system in the NPAT ensemble using PMCF method,18 the current CG DPPC model with US sampling method reproduces qualitatively similar results. Since the bilayer interfacial tension under constant area simulation is artificially larger, the change in free energy would be larger (which is about 500 kJ/mol) as compared to our result.
3.1.3 Hysteresis Test of Potential of Mean Force of a Pore Formation in DPPC System
To observe hysteresis within the current protocol, we performed an additional umbrella sampling MD simulation along the OP, ξ in the reverse direction (from pore state to pore-free state). Instead of using the unrestrained equilibrated lipid bilayer, we set the final configuration of the previous US trajectory at ξref = 1.00 in DPPC model system as the starting structures of all the new US windows. Therefore, we carried out US simulation for another 21 simulation windows for about 300 ns. The new PMF is shown in Figure S23. The PMFs obtained from unperturbed lipid configuration and the fully opened pore starting structure overlap with each other. Thus, we believe that hysteresis is minimal.
To check the activity of pore closure with the CG model, we run 5 replicates of simulations starting with a fully-formed transmembrane pore at ξref = 1.0 in the CG DPPC system, and then release the harmonic restraint. The CG force field leads to all the tested pores spontaneously closing on timescales of the order of 1.5 to 3.5 ns. Pore-closure starts after removing the harmonic restraint. The radius of pore is gradually reduced, as the lipid molecules move from the pore boundaries to the central region of pore, and the headgroups are progressively diffusing out from the pore and reoriented to the membrane normal direction. The lateral dimension of the membrane correspondingly reverts to that of the unperturbed equilibrated state. Water is gradually expelled from the pore. Headgroups in one layer start to lose contact with those in the other as the final pore-closure stage is reached. The density of lipids in the pore region increases gradually, which results in the increase of the thickness. Within 3.5 ns, the pore is fully closed, and the lipids in the pore region relax back to the normal orientation as in the unperturbed state (See the Movie M2 in the SI). Differences in pore closure behaviors between CG and AA force fields (all-atom force fields display no pore closure) may be caused by several reasons. First, the diffusive motion in CG model is effectively about four times as large as that in all atom models.34 Second, the temperature of our systems are comparatively higher. Larger thermal fluctuations of membrane allow the lipids to reassemble to the ordered bilayer within a shorter time period.
3.1.4 Overview of Pore-Formation Free Energetics
To find general relationships between free energetics of membrane pore formation and membrane bilayer properties, we used 18 different lipids for the analyses. Such analyses highlight the key properties of membrane that may be most directly related to the energetics of membrane pore formation. In particular, we calculated the membrane properties such as bilayer area per lipid (APL), thickness (d), bending rigidity (Kc) for all 18 different lipids from their unrestrained equilibrated trajectories. The results are summarized in Table 2. Table 3 shows the properties of membrane where the electrostatic interactions are computed by cutoff method. Calculation details are given in SI. We found the 1,2-dioleoyl-sn-glycero-3-phosphocholine (DOPC) and 1,2-dicaproyl-sn-glycero-3-phospho-L-serine (DHPS) possess the largest and smallest area per lipid with the values of 0.743 nm2 and 0.633 nm2 among all of the lipid bilayer systems considered. The table also shows that the thickest lipid bilayer system is 1,2-Distearoyl-sn-glycero-3-phosphocholine (DSPC) with a value of thickness 4.3 nm, and 1,2-dicaproyl-sn-glycero-3-phosphocholine (DHPC) and DHPS are thinnest (2.4 nm). The largest bending rigidity with a value of 15.84×10⁻²⁰J is obtained for DSPS lipid bilayers, and the DHPC lipid bilayers have smallest value of 5.89 ×10⁻²⁰J.
Table 2.
The equilibrium properties of pure bilayer systems and the free energetic results of pore formation as obtained from pure lipid systems and nonaarginine translocation as obtained from peptide containing bilayer systems. The lipid properties such as area per lipid (APL, nm2), thickness (d, nm), and bending rigidity (Kc, 10−20J) are computed from NPT equilibrated trajectories at 350K. The free energetic results include the PMFs for creating a 3nm radius transmembrane pore (ΔG1), the intrinsic Pore formation PMFs (ΔGnucl), the binding free energy between nonaarginine and membrane (ΔG2), the PMFs of nonaarginine translocation from the global minima to the center of the bilayer (ΔG3), the PMFs of pore formation induced by nonaarginine (ΔGpore). The free energetic results are all shown in unit kJ/mol. The PME method was used to compute electrostatic interactions for generating the trajectories of the bilayer systems.
| Entry | Lipid | APL | d | Kc | ΔG1 | ΔGnucl | ΔG2 | ΔG3 | ΔGpore | state |
|---|---|---|---|---|---|---|---|---|---|---|
| 1 | DSPC | 0.692 | 4.3 | 13.95 | 446.8 | 179.5 | - | 253.8 | 247.9 | pore |
| 2 | DHPC | 0.663 | 2.4 | 5.89 | 99.8 | 32.4 | - | 73.8 | 69.2 | pore |
| 3 | DLPC | 0.672 | 3.1 | 8.97 | 228.2 | 76.7 | - | 141.1 | 136.0 | pore |
| 4 | DOPC | 0.743 | 4.0 | 10.54 | 426.9 | 177.1 | - | 253.2 | 252.3 | pore |
| 5 | DOPE | 0.703 | 4.2 | 7.53 | 555.3 | 200.3 | - | 309.3 | 309.3 | no pore |
| 6 | DOPG | 0.714 | 4.1 | 9.78 | 514.7 | 206.6 | −65.4 | 229.1 | 229.1 | no pore |
| 7 | DOPS | 0.721 | 4.0 | 10.52 | 495.1 | 175.5 | −56.7 | 222.5 | 222.5 | pore |
| 8 | POPC | 0.714 | 3.9 | 10.70 | 384.7 | 151.2 | - | 245.0 | 244.8 | pore |
| 9 | POPE | 0.672 | 4.0 | 8.35 | 516.5 | 205.2 | - | 292.9 | 292.8 | pore |
| 10 | POPG | 0.684 | 3.9 | 10.66 | 482.8 | 173.2 | −67.3 | 217.7 | 217.7 | pore |
| 11 | POPS | 0.691 | 4.0 | 11.60 | 456.0 | 166.8 | −59.7 | 206.3 | 203.3 | pore |
| 12 | DPPG | 0.645 | 3.7 | 12.78 | 443.6 | 162.8 | −66.5 | 202.2 | 200.8 | pore |
| 13 | DHPS | 0.633 | 2.4 | 7.12 | 152.8 | 45.3 | −59.2 | 68.6 | 65.3 | pore |
| 14 | DSPS | 0.664 | 4.4 | 15.84 | 535.5 | 209.5 | −59.4 | 252.1 | 249.5 | pore |
| 15 | DLPS | 0.643 | 3.0 | 10.34 | 287.0 | 107.3 | −61.0 | 127.2 | 124.3 | pore |
| 16 | DPPC | 0.682 | 3.6 | 11.59 | 342.5 | 139.7 | - | 206.5 | 202.0 | pore |
| 17 | DPPE | 0.634 | 3.8 | 9.88 | 487.2 | 171.2 | - | 277.0 | 275.3 | pore |
| 18 | DPPS | 0.654 | 3.8 | 13.44 | 413.8 | 162.4 | −61.5 | 196.7 | 195.9 | pore |
Table 3.
Equilibrium properties of pure bilayer systems using simple cutoff method to compute electrostatic interaction.
| Entry | Lipid | APL | d | Kc | ΔG1 | ΔGnucl | ΔG2 | ΔG3 | ΔGpore | state |
|---|---|---|---|---|---|---|---|---|---|---|
| 1 | DSPC | 0.687 | 4.3 | 13.61 | 453.7 | 186.2 | - | 258.6 | 255.3 | pore |
| 2 | DHPC | 0.658 | 2.5 | 6.09 | 106.3 | 32.4 | - | 79.8 | 75.2 | pore |
| 3 | DLPC | 0.669 | 3.1 | 8.63 | 234.1 | 83.0 | - | 142.6 | 137.2 | pore |
| 4 | DOPC | 0.740 | 4.0 | 10.17 | 431.9 | 177.1 | - | 256.2 | 256.9 | pore |
| 5 | DOPE | 0.702 | 4.2 | 7.52 | 559.4 | 214.5 | - | 291.8 | 291.8 | no pore |
| 6 | DOPG | 0.700 | 4.2 | 7.26 | 555.3 | 195.2 | −38.2 | 235.5 | 235.5 | no pore |
| 7 | DOPS | 0.703 | 4.0 | 8.12 | 549.4 | 223.5 | −29.2 | 247.9 | 247.9 | no pore |
| 8 | POPC | 0.711 | 3.8 | 10.37 | 396.4 | 148.4 | - | 236.4 | 235.8 | pore |
| 9 | POPE | 0.670 | 4.0 | 8.16 | 524.8 | 211.8 | - | 274.4 | 282.9 | pore |
| 10 | POPG | 0.669 | 4.0 | 8.08 | 531.2 | 195.5 | −40.9 | 228.7 | 230.4 | no pore |
| 11 | POPS | 0.671 | 4.0 | 8.92 | 510.4 | 176.1 | −28.3 | 237.4 | 237.1 | pore |
| 12 | DPPG | 0.629 | 3.8 | 9.41 | 494.8 | 165.8 | −40.1 | 232.0 | 231.7 | pore |
| 13 | DHPS | 0.605 | 2.4 | 5.94 | 200.3 | 57.1 | −32.2 | 100.0 | 97.5 | pore |
| 14 | DSPS | 0.643 | 4.4 | 12.79 | 594.1 | 233.6 | −30.6 | 282.0 | 279.4 | pore |
| 15 | DLPS | 0.619 | 3.1 | 8.16 | 341.1 | 96.9 | −30.5 | 154.5 | 153.2 | pore |
| 16 | DPPC | 0.679 | 3.6 | 11.10 | 349.4 | 134.4 | - | 202.0 | 197.5 | pore |
| 17 | DPPE | 0.631 | 3.9 | 10.01 | 493.4 | 202.0 | - | 263.4 | 262.7 | pore |
| 18 | DPPS | 0.631 | 3.8 | 10.59 | 479.1 | 170.7 | −30.9 | 234.1 | 235.3 | pore |
We consider the pore-formation free energy barrier as the intrinsic pore formation free energy, equal to the nucleation free energy, denoted as ΔGnucl. The energetic cost to create a 3 nm radius pore inside the membrane is denoted ΔG1. We calculated intermediate radii, Rnet, of the pore for each configuration of the membrane using the previously described method (see Section 3.1.2). We plotted Rnet as a function of ξ in SI Figure S24 for all lipids. The figure shows that the value of pore radius at around ξ = 0.925 is similar for all lipids. We take the approximate free energy value for pore formation at ξ = 0.925 as ΔG1, corresponding to the radius of a fully-formed pore.
Figure S25 in SI shows no compelling correlation of ΔGnucl and ΔG1 with APL. We found that both the ΔGnucl and ΔG1 are scattered in the range of 0.63 to 0.75 nm2 of APL values. On the contrary, we find that pore formation free energetic barriers are correlated with lipid thickness (see Figure 3C and 3D). This could be rationalized by the strong hydrophobic interactions in the thick bilayers which have long hydrocarbon acyl chains. Separating longer lipids within a bilayer to form a pore requires higher free energy that overcomes the lipid-lipid interactions, especially the tail-tail hydrophobic interaction. Furthermore, Figure S25 in SI reveals that the pore formation free energy of membrane ΔGnucl and ΔG1 are likely associated with the bending rigidity Kc as well. As it is well-known that Kc relates to bilayer thickness, 50–52 it is not surprising that we observe Kc to strongly correlate with pore formation free energy. For a thicker bilayer, the stronger hydrophobic interaction increases the resistance to membrane shape deformation, and decreases the elasticity of the membrane, associated with a large Kc. Higher free energetic penalties are incurred in deforming high-KC membranes away from an equilibrium planar membrane, whereas a membrane with small bending rigidity demands less free energy penalty. To further explore the relationships of headgroup type, charge state, and degree of tail group saturation to pore formation, we sorted the 18 lipids into three broad classes. The results are presented in section 3.3. We first reiterate salient features of Arg9 peptide translocation into a model DPPC bilayer as they relate to the notion of pores in bilayers/membranes.
3.2 Peptide Translocation
3.2.1 Peptide Translocation in DPPC Model Bilayer System
We choose a widely-used cell penetrating peptide, nonaarginine, as a model pore inducing peptide, and the DPPC bilayer system as an example system to discuss underlying peptide translocation free energetics via pore formation paths. Recent studies15,16 suggest that by using umbrella sampling molecular dynamics simulations with both all atomic and coarse grained force fields, the pore-forming path systematically predicts lower free-energy barriers than the pore-free paths. Decomposition of PMFs indicates that the membrane contributes a dominant stabilization effect on the peptide inside the pore, and the major penalty arises from peptide desolvation.15 Further analysis revealed the pore-forming path is entropically favorable due to the increase of microstates in the pore configurations as the peptide moves toward the bilayer center.
Here, we applied similar protocols as in our previous studies to generate pore-containing configurations of a peptide in membrane.15 We calculated PMFs of nonaarginine translocation via pore-forming paths at 350 K using the Martini non-polarizable CG force field with PME. Figure 4A shows the PMF of nonaarginine translocation into model DPPC system along the z distance between the center of mass of peptide and the membrane. The value of largest z distance corresponds to the peptide in the bulk solution, and the value of zero corresponds to the peptide at center of bilayer. Qualitatively, this PMF retains similar features as in our previous studies performed at 323 K.15 The free energy increases monotonically as peptide approaches the membrane interface, and proceeds from the interface of the membrane to bilayer interior. The characteristic kink in the PMF around 0.4 nm, as described in our previous study,15 signifies the emergence of a visible transmembrane pore (see the configurations in Figure 5). We also noticed that the translocation of a nonaarginine through the transmembrane pore is almost barrierless, once the pore is formed (see the inset of Figure 4A). However, the kink position and PMF barrier of this result is slightly different than the previous result as we used higher temperature in the present study. The thermal expansion of membrane reduces the resistance of peptide translocation through the membrane. However, the increase of thermal fluctuation of membrane enhances the undulations which ultimately lower the stability of the pore structure.
Figure 4.

(A) PMF of nonaarginine translocation into model DPPC bilayers along the z distance from bulk water to the center of the bilayer. (B) The corresponding value of average pore order parameter, ξ as calculated from all umbrella sampling windows along the peptide translocation path is shown. The inset of the figures highlight the region contains the transmembrane pore.
Thus, in general the presence of the nonaarginine peptide at the center of the membrane not only induces the pore formation, but also stabilizes the transmembrane pore through the strong interaction between headgroups of lipid molecules present inside the pore and the charged sites of peptide. We also observe that the peptide induced pore stable over the simulation period.
3.2.2 Relation between Peptide Translocation and transmembrane Pore Formation in DPPC Model Bilayer System
Figure 5A shows typical snapshots of nonaarginine translocation configurations at windows corresponding to the bilayer center, inside the bilayer with pore and without pore, water-lipid interface, and bulk water in the model DPPC system. Compared with peptide-free systems, pore configurations are similar, but membrane deformation is no longer symmetric as the system contains a single peptide (see Figure 5B). To extract a relationship between the two free energies (i.e. umbrella sampling pore formation and peptide-induced), we calculated the average value of pore OP, ξ at each z-distance of the peptide in the induced pore forming system. Figure 4B illustrates evolution of the pore formation OP, ξ versus the nonaarginine translocation OP. We used same parameters (i.e. Γξ=0 and Γξ=1) for estimating ξ for this calculation. In Figure 4B, the OP for the peptide translocation is separated into four distinct regions, similar to the nonaarginine translocation PMF. The first region is bulk water from 4.0 to 6.0 nm. The corresponding ξ value is zero. No pore is formed in this region, where the membrane is unperturbed. The second region is at near-interface region ranging from 3.0 to 4.0 nm. As the peptide approaches the membrane, the distances between them come to lie within the non-bonded cutoff of the membrane surface. Since the interaction is not strong enough, there is no severe deformation of the membrane. The third region ranges from about 0.4 to 3.0 nm, where the peptide crosses the interface and moves toward the membrane core. We notice that the average value of ξ is gradually increasing but not large compared to the critical value of ξ. The membrane is constantly being deformed but there is no pore formation, and the free energy barrier for the translocation is increasing in a continuous manner. The fourth region is the pore region that ranges between 0.0 to 0.4 nm. When the peptide reaches this region, the value of ξ sharply rises, indicating onset of pore formation. The corresponding ξ value at the kink is about 0.52, where the z distance between the center of mass of the peptide and the membrane is about 0.35 nm. The value of ξ in this region is slightly larger than the value of critical pore formation ξ, shown in Figure 4B. The peptide translocation barrier in Figure 4A is around 201.9 kJ/mol, larger than the nucleation free energy (found in peptide-free system, 139.7 kJ/mol). The translocation PMF may be considered as free energy for peptide-induced (peptide fills the pore along with membrane deformation) pore formation, as opposed to pore formation free energy due to membrane deformation and water and ion filling the pore in a pure bilayer. The peptide translocation scenario presents transformation from a no pore state to a peptide-containing pore state; the peptide acts like the polar water and ions in the case of no peptide. The difference is rationalized through a combination of factors present in the peptide systems, but it is most likely dominated by the presence of peptide interactions with other system components, interactions that are absent in the scenario of generating a pore in a pure bilayer. First, in this system, the peptide is not symmetrically distributed in the bilayer system, the average structure of the pore state at the same ξ is not the same as the peptide-free system. Due to the asymmetrical distribution of peptide, one leaflet of the membrane is forced to accommodate the peptide. Thus, the density of lipid in the pore is asymmetrically distributed until the peptide reaches bilayer center (see Figure 5B). Second, the highly charged nonaarginine peptide is hydrophilic, and the strong interactions of the peptide with the ions, water and membrane headgroups lead to a high free energy cost for desolvating the peptide and transferring it to membrane interior. These collective effects lead to higher pore formation free energy in the peptide system than in the intrinsic pore formation case. Upon pore initiation, the OP ξ varies within a small range from 0.52 to 0.55 to accommodate the peptide. This implies that there is insignificant change in the pore size during the peptide translocation through the membrane once the pore is formed. The free energy of translocation of nonaarginine through membrane pore is essentially barrierless. The size of the peptide-induced pore in part depends on the globular shape of the peptide. We characterized the globular shape of peptide by calculating its radius of gyration. The peptide radius of gyration decreases from bulk water to bilayer core(see Figure S26). Once the pore is formed, the size of the peptide is almost constant and does not influence pore size.
3.2.3 Relation between Free Energetics of the Nonaarginine Translocation and Pore Formation
The free energetics of peptide translocation from the aqueous medium to bilayer center are summarized in Table 2. For anionic lipid systems, the positively charged peptide is stabilized by the negatively charged headgroups. We find a global PMF minimum at the interface and refer to it as ΔG2. The free energetic change from peptide at interface to peptide at bilayer center is termed ΔG3. Figure 6A shows ΔG3 increases linearly with lipid thickness. In all lipid systems tested, the free energy barriers from the global minima to the kink position are considered as pore formation free energies ΔGpore. Since the PMF changes very little upon reaching the pore formation region, ΔGpore is approximately equal to ΔG3. Figure 6B shows that ΔGpore is also a linear function of the lipid thickness, and the slope is almost the same as ΔG3. There is a similar correlation between the bending rigidity and ΔGpore, but it decorrelates with area per lipid(see Figure S27 in SI). Thus, the linear correlation of the lipid thickness to both the nucleation free energy ΔGnucl in peptide-free system and pore formation ΔGpore of nonaarginine implies that the formation free energy of pore induced by the nonaarginine is also a function of the intrinsic pore formation free energy.
Figure 6.

Panels (A) and (B) are the correlations of bilayer thickness with PMF for transferring nonaarginine peptide from global minimum to the center of the bilayer (ΔG3) and to the position where nonaarginine induces to form a pore (ΔGpore, kink position in PMF), as obtained from 18 different bilayer systems.
3.3 Effect of membrane properties on free energy
A lipid molecule is composed of a hydrophilic head group, and a hydrophobic hydrocarbon tail groups. In this work, we have studied 18 planar lipid bilayers. To systematically explore the transmembrane pore, we made three classifications based on the length, degree of saturation of the hydrocarbon tails and the charge state of the lipid headgroups. Several lipids fall in multiple classes.
The first class contains lipids with equivalent headgroups and tailgroup saturation states, but different tail chain length based on the number of beads in coarse-grained lipid molecular constructs. Two subclasses are defined based on the charge state of the lipid headgroups. The first subclass consists of lipids with zwitterionic/neutral headgroup–DHPC (8 beads), DLPC (10 beads), DPPC (12 beads), DSPC (14 beads), and the second subclass composes of lipids with anionic headgroup–DHPS (8 beads), DLPS (10 beads), DPPS (12 beads), DSPS (14 beads) (note: the number of beads per CG lipid molecule is shown in parentheses).
The second class is defined as lipids with same headgroups and similar length of tail groups but different degrees of saturation state of the hydrocarbon chains. Four subclasses are investigated. The first subclass contains lipids with PC headgroup–DPPC, POPC, DOPC, second subclass contains lipids with PE headgroup–DPPE, POPE, DOPE, third subclass contains lipids with PG headgroup–DPPG, DOPG, POPG, and fourth subclass contains lipids with PS headgroup–DPPS, POPS, DOPS.
The third class is defined as lipids with same tail groups but different headgroups. In this class we have three subclasses of lipids distinguished by the headgroup type. First subclass contains lipids with saturated hydrocarbon tails–DPPC, DPPE, DPPG, DPPS (12 beads): second subclass contains lipids with one saturated and one unsaturated tails–POPC, POPE, POPG, POPS (13 beads); third subclass contains lipids with both unsaturated tails–DOPC, DOPE, DOPG, DOPS (14 beads) (Note: the number of beads per lipid in each subclass is labeled in the parentheses).
3.3.1 Effect of lipid hydrocarbon chain length
3.3.1.1 3 nm Radius of Pore Formation and Intrinsic Pore Formation Free Energy
Figure S28 in SI shows PMFs of class 1 lipids. The left panel shows the subclass of lipids with zwitterionic/neutral headgroup, and the right panel shows the lipids with anionic headgroups. Increasing length of hydrophobic tail of lipid disfavors pore formation. From the PMFs, ΔG1 follows the trend as DHPC < DLPC < DPPC < DSPC for the zwitterionic/neutral lipids. and DHPS < DLPS < DPPS < DSPS for the anionic lipids.
The intrinsic nucleation free energy, ΔGnucl and the free energy to create a 3 nm radius pore, ΔG1 are shown in Table 4. Figure 8 reveals a linear dependence on area per lipid, thickness and bending rigidity of the bilayers in the subclasses of class 1. Both ΔGnucl and ΔG1 increase linearly with increasing thickness of hydrophobic layer. The systems containing PS headgroups require higher free energy cost to open a pore in those two subclasses. The relative change in free energy (i.e. ΔG (PS) = ΔG(PC) + 50kJ/mol) between PC and PS for a fixed chain length is around 50 kJ/mol. We believe such increase in free energy is likely associated with increased headgroup region order in PS lipids (see Figure S29 in SI for the order parameter of the lipid bond). The bending rigidity of PS bilayer systems is larger than the PC systems for a fixed chain length of lipid molecules. Larger bending rigidity resists membrane deformation. Recently, Bennett et al.42 demonstrated pore formation in DLPC, DMPC and DPPC bilayers by moving phosphate group of a single lipid into the center of the bilayer via a lipid flip-flop mechanism. The result qualitatively agrees with our observations. The free energetics of pore formation are more unfavorable as the thickness of bilayer increases. Since a single lipid is restrained as a solute inside the bilayer, the size of the pore was unrestrained in their simulation. However, our study shows that free energy cost to form a pore for thicker bilayer is larger as compared to thinner bilayer.
Table 4.
The equilibrium properties of pure bilayer systems in class 1. The free energetic results of pore formation and nonaarginine translocation for those bilayers are also tabulated. Representation and unit of each of the properties in the table are same as in Table 2.
| Entry | Lipid | APL | d | Kc | ΔG1 | ΔGnucl | ΔG2 | ΔG3 | ΔGpore | state |
|---|---|---|---|---|---|---|---|---|---|---|
| 1 | DHPC | 0.663 | 2.4 | 5.89 | 99.8 | 32.4 | - | 73.8 | 69.2 | pore |
| 2 | DLPC | 0.672 | 3.1 | 8.97 | 228.2 | 76.7 | - | 141.1 | 136.0 | pore |
| 3 | DPPC | 0.682 | 3.6 | 11.59 | 342.5 | 139.7 | - | 206.5 | 202.0 | pore |
| 4 | DSPC | 0.692 | 4.3 | 13.95 | 446.8 | 179.5 | - | 253.8 | 247.9 | pore |
|
| ||||||||||
| 5 | DHPS | 0.633 | 2.4 | 7.12 | 152.8 | 45.3 | −59.2 | 68.6 | 65.3 | pore |
| 6 | DLPS | 0.643 | 3.0 | 10.34 | 287.0 | 107.3 | −61.0 | 127.2 | 124.3 | pore |
| 7 | DPPS | 0.654 | 3.8 | 13.44 | 413.8 | 162.4 | −61.5 | 196.7 | 195.9 | pore |
| 8 | DSPS | 0.664 | 4.4 | 15.84 | 535.5 | 209.5 | −59.4 | 252.1 | 249.5 | pore |
Figure 8.

Top panel shows the correlation of the PMF (ΔG1) for creating a transmembrane pore of 3nm radius with the area per lipid, lipid thickness and bending rigidity of the bilayers, fallen in class 1. The middle and bottom panels show the same correlation with the intrinsic pore formation PMF (ΔGnucl) and nonaarginine induced pore formation PMF (ΔGpore) for the same bilayer systems. The purple lines with red circle symbol shows the PS lipids, and the green lines with blue square symbol shows the PC lipids.
3.3.1.2 Nonaarginine Induced Pore Formation
Nonaarginine translocation PMF, shown in Figure S30 of SI, indicates strong binding with the headgroups of anionic lipids through favorable electrostatic interactions between positively charged peptide and negatively charged headgroups; the corresponding PMF value is 60 kJ/mol lower as compared to other systems. This agrees with experimental studies showing strong association between cationic peptides and anionic lipid membranes.53 The binding affinity between peptide and bilayer is quantitatively similar for the lipids containing identical headgroups. Bilayer thickness does not alter the value of PMF minimum, but rather systematically increases its location with increasing bilayer thickness. Although the anionic lipid bilayers bind strongly with nonaarginine peptide at the membrane interface, the barriers from the minima to the center of the membrane core are still in the same order of magnitude (see the data in Table 4). However, the area per lipid, lipid thickness and bending rigidity are correlated with translocation PMFs for identical headgroups in a subclass, which is in agreement with the thickness effect as discussed in Section (see Figure 8). Longer hydrocarbon chain increases free energetic cost for nonaarginine translocation and pore formation. Finally, we also observed there is no minimum in PMF for all neutral lipid bilayers, suggesting there is weak binding between cationic peptide and headgroups of neutral lipid.
3.3.2 Effect of saturation level of hydrocarbon chain
3.3.2.1 3 nm Radius of Pore Formation and Intrinsic Pore Formation Free Energy
Depending on the level of unsaturation present in the two acyl chains (i.e. sn-1 and sn-2), we consider three different subclasses, 1) all of the bonds present in both acyl chains of a lipid are saturated (i.e. DP type) 2) one of the acyl chain of a lipid is unsaturated and another one is saturated (i.e. PO type) 3) both of the acyl chains of a lipid are unsaturated (i.e. DO type). Lipids in each of the subclasses have identical headgroups, but the degree of tail saturation differs. The order of lipid tails decreases with increasing unsaturation, thus it decreases from DP to DO type lipids. We next try to make a relationship between intrinsic pore formation free energy and the area per lipid for each of the subclasses. Figure S46 in SI shows intrinsic pore formation free energy as a function of the area per lipid. The generic trend that we observed from this analysis is quite similar with the results that we obtained in class 1. The observation is in agreement with our expectation that disorder of lipid chains results in increase of area per lipid. However, for an identical headgroup and similar bilayer thickness, it implies that the level of saturation does alter the pore formation free energy. We also observe that a small change in lipid thickness causes little change in bending rigidity. However, there is no influence of bending rigidity or thickness on pore formation free energy.
3.3.2.2 Nonaarginine Induced Pore Formation
Free energy of translocation of nonaarginine for the four different subclasses is shown in Table 5 (Figure S33 in SI). There is ineffective binding between the charged nonaarginine with the neutral lipid, but strong binding affinity to the anionic headgroups. The free energy of binding between peptide and lipid is 65 to 67 kJ/mol and 56 to 62 kJ/mol for the PG and PS lipids. The peptide induced pore formation free energy does not vary linearly with thickness but rather with APL. This is not surprising and it correlates with intrinsic pore formation free energy obtained from restrained simulations for pure lipid systems. We find that the cost of free energy for peptide translocation into relatively more deformed bilayer is larger as compared to its less deformed form, which contradicts with our expectation. However, we notice that (see the Table 5) the thicker bilayers lead to an increase in free energy of translocation. Thus, our results suggest that the degree of saturation of acyl chain has little influence on the free energy of peptide translocation, but it is primarily influenced by the thickness of bilayer.
Table 5.
The equilibrium properties of pure bilayer systems in class 2. The free energetic results of pore formation and nonaarginine translocation for those bilayers are also tabulated. Representation and unit of each of the properties in the table are same as in Table 2.
| Entry | Lipid | APL | d | Kc | ΔG1 | ΔGnucl | ΔG2 | ΔG3 | ΔGpore | state |
|---|---|---|---|---|---|---|---|---|---|---|
| 1 | DPPC | 0.682 | 3.6 | 11.59 | 342.5 | 139.7 | - | 206.5 | 202.0 | pore |
| 2 | POPC | 0.714 | 3.9 | 10.70 | 384.7 | 151.2 | - | 245.0 | 244.8 | pore |
| 3 | DOPC | 0.743 | 4.0 | 10.54 | 426.9 | 177.1 | - | 253.2 | 252.3 | pore |
|
| ||||||||||
| 4 | DPPE | 0.634 | 3.8 | 9.88 | 487.2 | 171.2 | - | 277.0 | 275.3 | pore |
| 5 | POPE | 0.672 | 4.0 | 8.35 | 516.5 | 205.2 | - | 292.9 | 292.8 | pore |
| 6 | DOPE | 0.703 | 4.2 | 7.53 | 555.3 | 200.3 | - | 309.3 | 309.3 | no pore |
|
| ||||||||||
| 7 | DPPG | 0.645 | 3.7 | 12.78 | 443.6 | 162.8 | −66.5 | 202.2 | 200.8 | pore |
| 8 | POPG | 0.684 | 3.9 | 10.66 | 482.8 | 173.2 | −67.3 | 217.7 | 217.7 | pore |
| 9 | DOPG | 0.714 | 4.1 | 9.78 | 514.7 | 206.6 | −65.4 | 229.1 | 229.1 | no pore |
|
| ||||||||||
| 10 | DPPS | 0.654 | 3.8 | 13.44 | 413.8 | 162.4 | −61.5 | 196.7 | 195.9 | pore |
| 11 | POPS | 0.691 | 4.0 | 11.60 | 456.0 | 166.8 | −59.7 | 206.3 | 203.3 | pore |
| 12 | DOPS | 0.721 | 4.0 | 10.52 | 495.1 | 175.5 | −56.7 | 222.5 | 222.5 | pore |
3.3.3 Effect of lipid headgroup
3.3.3.1 3 nm Radius of Pore Formation and Intrinsic Pore Formation Free Energy
The PMFs of lipid systems in class 3 are shown in Figure S34 in SI. The tail groups of the lipids are identical but their headgroups are different in this class. The change of thickness due to different type of headgroups is trivial for lipids in this class. The results are summarized in Table 6. The PMFs follow the trends: PE > PG ≈ PS > PC. We didn’t observe a strong correlation of the thickness or bending rigidity to the pore formation free energy or nucleation free energy. However, free energies are linear functions of area per lipid for lipids in all three subclasses (see Figure S48 in SI) Increase of the area per lipid causes a decrease of the pore formation free energy. This is likely associated with the interaction of the headgroups. Since the choline is largest of the functional groups present in headgroup region, it assists and accommodates expansion of PC bilayers. However, the presence of an NH3 group in PE bilayers may not support such expansion. The expansion of the area per lipid indicates that those bilayers can easily undergo deformation, and thus it is expected that their bending rigidities are relatively small. Table 6 shows values of APL of bilayers in class 3; these values correlate well with the bending rigidity of bilayers. However, it is important to note that unlike for the lipids in class 2, the pore formation free energy cost for lipids in this class increases with increase of APL.
Table 6.
The equilibrium properties of pure bilayer systems in class 3. The free energetic results of pore formation and nonaarginine translocation for those bilayers are also tabulated. Representation and unit of each of the properties in the table are same as in Table 2.
| Entry | Lipid | APL | d | Kc | ΔG1 | ΔGnucl | ΔG2 | ΔG3 | ΔGpore | state |
|---|---|---|---|---|---|---|---|---|---|---|
| 1 | DPPE | 0.634 | 3.8 | 9.88 | 487.2 | 171.2 | - | 277.0 | 275.3 | pore |
| 2 | DPPG | 0.645 | 3.7 | 12.78 | 443.6 | 162.8 | −66.5 | 202.2 | 200.8 | pore |
| 3 | DPPS | 0.654 | 3.8 | 13.44 | 413.8 | 162.4 | −61.5 | 196.7 | 195.9 | pore |
|
| ||||||||||
| 4 | DPPC | 0.682 | 3.6 | 11.59 | 342.5 | 139.7 | - | 206.5 | 202.0 | pore |
| 5 | POPE | 0.672 | 4.0 | 8.35 | 516.5 | 205.2 | - | 292.9 | 292.8 | pore |
| 6 | POPG | 0.684 | 3.9 | 10.66 | 482.8 | 173.2 | −67.3 | 217.7 | 217.7 | pore |
| 7 | POPS | 0.691 | 4.0 | 11.60 | 456.0 | 166.8 | −59.7 | 206.3 | 203.3 | pore |
| 8 | POPC | 0.714 | 3.9 | 10.70 | 384.7 | 151.2 | - | 245.0 | 244.8 | pore |
|
| ||||||||||
| 9 | DOPE | 0.703 | 4.2 | 7.53 | 555.3 | 200.3 | - | 309.3 | 309.3 | no pore |
| 10 | DOPG | 0.714 | 4.1 | 9.78 | 514.7 | 206.6 | −65.4 | 229.1 | 229.1 | no pore |
| 11 | DOPS | 0.721 | 4.0 | 10.52 | 495.1 | 175.5 | −56.7 | 222.5 | 222.5 | pore |
| 12 | DOPC | 0.743 | 4.0 | 10.54 | 426.9 | 177.1 | - | 253.2 | 252.3 | pore |
3.3.3.2 Nonaarginine Translocation Induced Pore Formation
The free energy for nonaarginine translocation shows the similar behavior to the peptide-free systems (see Figure S36 in SI). We found that the translocation free energy is anti-correlated to the area per lipid for each of the subclasses, shown in Figure S48 in SI. We further noticed that the charge state of the lipid headgroups differentiate the peptide binding events, where there is no local minimum at the interface region for all the PC, PE lipids, but for all the PG and PS there is a minimum depth around 60 kJ/mol. Although the translocation free energy barrier from bulk to the center of the bilayer is relatively smaller in the anionic lipid systems, the free energy from the global minimum to the maximum follows similar trend that we observed in other systems in other classes. Nonetheless, it has been shown experimentally that the cationic peptide can translocate easily through the anionic lipid systems. That might result from strong binding interactions between cationic peptide and anionic headgroups of the lipid systems that causes an increase of the concentration of the peptide near the membrane interface, and increased the probability of peptide uptake into the membrane.54
3.3.4 Free Energetics of Intrinsic Pore Formation vs Peptide Induced Pore Formation
Table 4 summarizes pore formation free energy ΔGpore for the cyclic nonaarginine systems where the kink position in PMF corresponds the nucleation free energy in the pure lipid systems. The free energy costs for creating a pore inside bilayer using nonaarginine peptide is always larger than that obtained directly from restrained simulation for pure lipid systems. Figure 8 presents the peptide pore formation free energy for the bilayers containing lipid molecules with different tail length, as a function of the nucleation free energy for a fixed value of OP ξ. Figure S47 in SI shows that the peptide induced pore formation free energy is a function of the intrinsic pore formation free energy for the bilayers containing lipid molecules with different level of unsaturation. We further found that PE lipids require highest free energy cost for both nonaarginine translocation and the pore formation. The compact structure of the DPPE disfavors peptide translocation and the associated pore formation. We found both of the free energies qualitatively correlated to each other for class 1 and class 2 bilayers but the class 3 bilayers do not follow such correlation. However, the numerical values for peptide induced pore formation are slightly higher as compared to intrinsic pore formation free energy. This is possibly because the desolvation free energy of the cationic peptide is much higher as compared to free energy that causes a disruption of hydrophobic contacts among the lipid tails.
4 Summary
We delineated pore formation free energies in 18 different lipid bilayer systems partitioned into three broad classes based on the length, saturation of hydrocarbon acyl chains and charge state of lipid headgroups. We employed two different methodologies: a) restraining an OP along the pore forming degrees of freedom in pure lipid systems, and b) inserting a cationic peptide into bilayer to induce a pore. Both methods use US simulation protocol where size of the pore was restrained in former methodology, whereas the position of the peptide was restrained in latter methodology. We investigated the intrinsic pore formation free energy, and the cost of free energy to create a pore of 3 nm radius using former methodology for each of the systems. We used cyclic nonaarginine to investigate free energetics of creating a peptide-induced pore inside the bilayers. We had chosen cyclic nonaarginine over other cell penetrating peptides because a) it is one of the most well studied and widely used CPP b) it is short and contains positive charge, and c) can translocate through membrane with or without molecular cargos.24,55 Both experiment and simulation suggest that nonaarginine can induce a transmembrane pore. CPP translocation free energy along pore paths is relatively lower than the pore-free pathways.
The findings suggest that thicker bilayers require larger free energy to deform the membrane, and create a pore. For bilayers of similar thickness, the free energy barriers were further differentiated by the type of the headgroups, and the degree of saturation of the tail groups. The pore-formation free energy using peptide is in general higher than restraining along pore-formation reaction coordinate. Several factors such as a) absence of pore-size control in peptide induced pore formation b) degree of desolvation of cationic peptide, and c) size and charge of peptide, influence observed free energy differences. The bending rigidity is another major parameter that measures the cost of deformation free energy, and it linearly varies with the lipid thickness and structure. Our calculation shows that both of the free energies couple to the bending rigidities of the membrane. However, we find strong correlation between the change in area per lipid and pore formation free energy for each defined class. Importantly, we found that bilayer properties such as APL, thickness, bending rigidity are almost independent of the method of handling electrostatic interactions.
In class 1, lipid molecules contain identical headgroups and degree of saturation level, but with different overall chain length. We observe a positive correlation between the thickness of the bilayer with both free energies. This may be due to the fact that the systems were simulated at high temperature condition. As reported in Marrink’s work, the APL is anti-correlated with the lipid thickness at a temperature below 338 K, where a longer acyl tail gives a smaller lipid area per lipid.34 We simulated our system at 350 K, and found the APL shows a positive correlation with the membrane thickness.
For class 2, the bilayers have almost similar thickness but the degree of saturation level of the tails are different. We mentioned above that the degree of saturation of the tails increases the disorder of the bilayer which as a consequence increases the APL. Here, we found that the cost of both free energies are positively correlated to the APL.
For class 3, lipid molecules having identical tail groups, but they have different headgroups and the thicknesses of the bilayer changes within a narrow range. The APL of bilayers in this class have been changed due to the alteration of the size of the headgroups, which further modifies the free energy of pore formation. However, in this class, the cost of free energy is anti-correlated with APL. The above negative correlation can be explained by the fact that the interspace among lipid molecules present in bilayer increases due to the increase of the size of headgroups.
In general, our study reveals that the free energy to form a pore inside a thick bilayer using a cationic peptide is relatively high due to the strong interaction between cationic peptide and aqueous solvent. Therefore, the desolvation free energy of cationic peptide from bulk to bilayer is large, increasing the cost of free energy. The deformation free energy penalty also increases as the thickness of bilayers increases, which lowers the probability of peptide translocation through bilayer. Thus, it disfavors pore induction. This may be related to force field. Marrink and co-workers showed that a disordered toroidal pore can be generated using the current generation of all atom force field.56,57 However, because of the time scale limitation, it is not known if the observed disordered pores represent a transient phenomena during which peptide translocates across the membrane. In a relatively recent work, use of big multipole water (BMW) with MARTINI lipid demonstrates that modulation of bilayer and CPP structure produces negative Gaussian curvature.39,40 In other word, it induces pore formation. Their findings were also in agreement with experiment. Thus, a combination of the present protocol with BMW-Martini force field may demonstrate lower pore formation free energies; this is a worthy future direction. Studies using BMW-Martini are further warranted.
We found the cost of free energy to form a pore using nonaarginine is a linear function of the intrinsic nucleation free energy cost. We observed that the magnitude of this free energy strongly depends on the thickness and rigidity of the bilayer. We further calculated value of pore formation OP, ξ for the membrane-peptide system to compare results obtained by restraining OP along pore forming degrees of freedom. Interestingly, we observed that the value of peptide induced pore formation free energy is larger as compared to the free energy obtained by restraining OP along pore forming degrees of freedom for a fixed OP, ξ. We argued that several factors such as lipid thickness, hydration penalty, membrane-peptide interaction might involved for the difference between two free energies. Since our peptide is highly hydrophilic, hence desolvation free energy penalty is one of the major factor among all others. Therefore, the peptide dislikes hydrophobic core of the lipid bilayers, and hence lowering trafficking into the bilayer. However, the cost of pore formation free energy may be much lower for the partial or fully hydrophobic peptide, since the peptide-lipid hydrophobic interaction would stabilize the overall free energy of the system.
Unlike neutral lipid systems, we observe a strong binding affinity of nonaarginine with the anionic system due the strong electrostatic interactions. The probability of translocation of those peptide is significantly increased even in dilute solution because they can accumulate at the membrane-water interface, and their collective electrostatic effects enhance the probability of translocation. However, the barrier for the peptide to escape it from the global minimum of PMF for all types of lipids are still on the same order of magnitude.
We believe that this study sheds light on the intrinsic pore formation probability based on the composition of the lipid bilayers, and also presents a novel view of pore formation in peptide systems. The OP allows one to study the free energetics of pore formation in a convenient and accurate way for the membrane systems. This method may also be potentially applied to study the pore formation in mixed lipid systems, asymmetric leaflets, and cholesterol, surfactant effects and so on to investigate the roles of membrane structures. It may also be used to restraint domain formation in a lipid systems.
Supplementary Material
Figure 7.

Correlation between nonaarginine induced pore formation PMF (ΔGpore) in peptide containing bilayer system and intrinsic pore formation PMF (ΔGnucl) as obtained from peptide free bilayer system.
Figure 9.

Correlation between the nonaarginine induced pore formation PMF (ΔGpore) in peptide containing bilayer system and intrinsic pore formation PMF (ΔGnucl) for the bilayer systems in class 1. The purple lines with red circle symbol shows the PS lipids, and the green lines with blue square symbol shows the PC lipids.
Acknowledgments
The authors acknowledge support from the National Science Foundation (CAREER:MCB:1149802). Computational resources are acknowledged via support from National Institutes of Health COBRE:P20-RR015588 in the Chemical Engineering Department and COBRE:P20-RR017716 in the Department of Chemistry and Biochemistry at the University of Delaware. SP thanks N. Patel for fruitful discussion and encouragement for the duration of this work.
Biographies

Yuan Hu received his B.S. degree in chemistry in 2008 and earned his M.S. degree in organic chemistry in 2010, from Wuhan University, China. Subsequently, he decided to continue his research interest from experiment to the deep mechanistic understanding by means of computational biophysics and chemistry. He is currently a Ph.D. candidate in University of Delaware. The main focus of his research is using state-of-art multiscale free energy simulation methods to explore mechanisms and underlying thermodynamic determinants of cellular uptake of cell penetrating peptides into model biological membranes, a challenging problem which continues to attract significant attention.

Sudipta Kumar Sinha obtained his M.Sc.(2005) degree in physical chemistry from the University of Calcutta, Kolkata and Ph.D. (2011) degree in computational biophysical chemistry from Indian Institute of Technology Kharagpur. After a short stay in the Department of Biomedical Engineering at University of California, Davis, he arrived as a postdoctoral fellow at the Department of Chemistry and Biochemistry at University of Delaware. He is currently working on several aspects of membrane biophysics and developing polarizable and charge transfer force fields.

Sandeep Patel is currently Associate Professor in the Department of Chemistry and Biochemistry at the University of Delaware, USA. He attended Drexel University for his Baccalaureate training in Chemical Engineering, and then headed to the Massachusetts Institute of Technology for his Doctoral work in Chemical Engineering. He obtained his Post-Doctoral training in the lab of Professor Charles L. Brooks III while at the Scripps Research Institute in La Jolla, California. Research areas of focus include force field development (particularly polarizable force fields for a variety of biomolecular systems), ion solvation and interfacial behaviors, and membrane biophysics with focus on cell-penetrating peptides and underlying thermodynamic and structural mechanisms of translocation.
Footnotes
Supporting Information Available
Supporting Information includes information on convergence tests for potentials of mean force, density profiles of bilayer systems simulated, charge density profiles, lipid density distributions (as pertaining to pore formation processes), tests of pore formation potential of mean force hysteresis, and potentials of mean force and bilayer properties of lipids broken down in the classes discussed in the main text of the paper. This material is available free of charge via the Internet at http://pubs.acs.org/.
References
- 1.Sandre O, Moreaux L, Brochard-Wyart F. Dynamics of transient pores in stretched vesicles. Proc Nat Aca Sci. 1999;96:10591–10596. doi: 10.1073/pnas.96.19.10591. [DOI] [PMC free article] [PubMed] [Google Scholar]
- 2.Drew Bennett WF, Peter Tieleman D. The Importance of Membrane Defects-Lessons from Simulations. Acc Chem Res. 2014;47:2244–2251. doi: 10.1021/ar4002729. [DOI] [PubMed] [Google Scholar]
- 3.Karatekin E, Sandre O, Guitouni H, Borghi N, Puech PH, Brochard-Wyart F. Cascades of transient pores in giant vesicles: line tension and transport. Biophys J. 2003;84:1734–1749. doi: 10.1016/S0006-3495(03)74981-9. [DOI] [PMC free article] [PubMed] [Google Scholar]
- 4.Anderluh G, Lakey JH. Proteins: membrane binding and pore formation. Vol. 677. Springer; 2011. [PubMed] [Google Scholar]
- 5.Tabaei SR, Rabe M, Zhdanov VP, Cho NJ, Hook F. Single Vesicle Analysis Reveals Nanoscale Membrane Curvature Selective Pore Formation in Lipid Membranes by an Antiviral-Helical Peptide. Nano Letters. 2012;12:5719–5725. doi: 10.1021/nl3029637. [DOI] [PubMed] [Google Scholar]
- 6.Cohen FS, Melikyan GB. The Energetics of Membrane Fusion from Binding, through Hemifusion, Pore Formation, and Pore Enlargement. J Mem Biol. 2004;199:1–14. doi: 10.1007/s00232-004-0669-8. [DOI] [PubMed] [Google Scholar]
- 7.Javadov S, Karmazyn M, Escobales N. Mitochondrial Permeability Transition Pore Opening as a Promising Therapeutic Target in Cardiac Diseases. Cell Physiol Biochem. 2007;20:1–22. doi: 10.1124/jpet.109.153213. [DOI] [PubMed] [Google Scholar]
- 8.Saitoh A, Takiguchi K, Tanaka Y, Hotani H. Nonviral gene therapy: the promise of genes as pharmaceutical products. Proc Nat Aca Sci. 1998;95:1026–1031. [Google Scholar]
- 9.Moroz JD, Nelson P. Dynamically stabilized pores in bilayer membranes. Biophys J. 1997;72:2211–6. doi: 10.1016/S0006-3495(97)78864-7. [DOI] [PMC free article] [PubMed] [Google Scholar]
- 10.De Gennes P, Taupin C. Microemulsions and the flexibility of oil/water interfaces. The Journal of Physical Chemistry. 1982;86:2294–2304. [Google Scholar]
- 11.Lasic DD. Liposomes: from physics to applications. Elsevier; Amsterdam: 1993. [Google Scholar]
- 12.Singhvi R, Kumar A, Lopez GP, Stephanopoulos GN, Wang DI, Whitesides GM, Ingber DE. Engineering cell shape and function. Science. 1994;264:696–698. doi: 10.1126/science.8171320. [DOI] [PubMed] [Google Scholar]
- 13.Ciobanasu C, Siebrasse JP, Kubitscheck U. Cell-Penetrating HIV1 TAT Peptides Can Generate Pores in Model Membranes. Biophys J. 2010;99:153–162. doi: 10.1016/j.bpj.2010.03.065. [DOI] [PMC free article] [PubMed] [Google Scholar]
- 14.Brogden KA. Antimicrobial peptides: pore formers or metabolic inhibitors in bacteria? Nature Rev Microbiol. 2005;3:238–250. doi: 10.1038/nrmicro1098. [DOI] [PubMed] [Google Scholar]
- 15.Hu Y, Liu X, Sinha SK, Patel S. Translocation Thermodynamics of Linear and Cyclic Nonaarginine Into Model DPPC Bilayer Via Coarse-Grained Molecular Dynamics Simulation: Implications of Pore Formation and Nonadditivity. J Phys Chem B. 2014;118:2670–2682. doi: 10.1021/jp412600e. [DOI] [PMC free article] [PubMed] [Google Scholar]
- 16.Huang K, García AE. Free Energy of Translocating an Arginine-Rich Cell-Penetrating Peptide across a Lipid Bilayer Suggests Pore Formation. Biophys J. 2013;104:412–420. doi: 10.1016/j.bpj.2012.10.027. [DOI] [PMC free article] [PubMed] [Google Scholar]
- 17.Tolpekina TV, den Otter WK, Briels WJ. Nucleation free energy of pore formation in an amphiphilic bilayer studied by molecular dynamics simulations. J Chem Phys. 2004;121:12060–12066. doi: 10.1063/1.1815296. [DOI] [PubMed] [Google Scholar]
- 18.Wohlert J, Den Otter W, Edholm O, Briels W. Free energy of a trans-membrane pore calculated from atomistic molecular dynamics simulations. J Chem Phys. 2006;124:154905. doi: 10.1063/1.2171965. [DOI] [PubMed] [Google Scholar]
- 19.Litster J. Stability of lipid bilayers and red blood cell membranes. Phys Lett A. 1975;53:193–194. [Google Scholar]
- 20.Taupin C, Dvolaitzky M, Sauterey C. Osmotic pressure-induced pores in phospholipid vesicles. Biochemistry. 1975;14:4771–4775. doi: 10.1021/bi00692a032. [DOI] [PubMed] [Google Scholar]
- 21.Den Otter W, Briels W. The calculation of free-energy differences by constrained molecular-dynamics simulations. J Chem Phys. 1998;109:4139–4146. [Google Scholar]
- 22.Marrink SJ, Tieleman DP. Perspective on the Martini model. Chem Soc Rev. 2013;42:6801–6822. doi: 10.1039/c3cs60093a. [DOI] [PubMed] [Google Scholar]
- 23.Tieleman DP, Leontiadou H, Mark AE, Marrink SJ. Simulation of Pore Formation in Lipid Bilayers by Mechanical Stress and Electric Fields. J Am Chem Soc. 2003;125:6382–6383. doi: 10.1021/ja029504i. [DOI] [PubMed] [Google Scholar]
- 24.Bechara C, Sagan S. Cell-penetrating peptides: 20 years later, where do we stand? FEBS Lett. 2013;587:1693–1702. doi: 10.1016/j.febslet.2013.04.031. [DOI] [PubMed] [Google Scholar]
- 25.Tuennemann G, Ter-Avetisyan G, Martin RM, Stockl M, Herrmann A, Cardoso MC. Live-cell analysis of cell penetration ability and toxicity of oligo-arginines. J Pept Sci. 2008:469–476. doi: 10.1002/psc.968. [DOI] [PubMed] [Google Scholar]
- 26.Choi D, et al. Insertion mechanism of cell-penetrating peptides into supported phospholipid membranes revealed by X-ray and neutron reflection. Soft Matter. 2012;8:8294–829. [Google Scholar]
- 27.Li S, Su Y, Luo W, Hong M. Water-Protein Interactions of an Arginine-Rich Membrane Peptide in Lipid Bilayers Investigated by Solid-State Nuclear Magnetic Resonance Spectroscopy. J Phys Chem B. 2010;114:4063–406. doi: 10.1021/jp912283r. [DOI] [PMC free article] [PubMed] [Google Scholar]
- 28.Herce HD, Garcia AE, Litt J, Kane RS, Martin P, Enrique N, Rebolledo A, Milesi V. Arginine-Rich Peptides Destabilize the Plasma Membrane, Consistent with a Pore Formation Translocation Mechanism of Cell-Penetrating Peptides. Biophys J. 2009;97:1917–1925. doi: 10.1016/j.bpj.2009.05.066. [DOI] [PMC free article] [PubMed] [Google Scholar]
- 29.Mishra A, Lai GH, Schmidt NW, Sun VZ, Rodriguez AR, Tong R, Tang L, Cheng J, Deming TJ, Kamei DT, Wong GCL. Translocation of HIV TAT peptide and analogues induced by multiplexed membrane and cytoskeletal interactions. Proc Nat Aca Sci. 2011;108:16883–16888. doi: 10.1073/pnas.1108795108. [DOI] [PMC free article] [PubMed] [Google Scholar]
- 30.Mishra A, Gordon V, Yang L, Coridan R, Wong GCL. HIV TAT Forms Pores in Membranes by Inducing Saddle-Splay Curvature: Potential Role of Bidentate Hydrogen Bonding. Angew Chem Int Ed. 2008;47:2986–2989. doi: 10.1002/anie.200704444. [DOI] [PubMed] [Google Scholar]
- 31.Saalik P, Niinep A, Pae J, Hansen M, Lubenets D, Langel U, Pooga M. Penetration without cells: Membrane translocation of cell-penetrating peptides in the model giant plasma membrane vesicles. J Control Release. 2011;153:117–125. doi: 10.1016/j.jconrel.2011.03.011. [DOI] [PubMed] [Google Scholar]
- 32.Hu Y, Ou S, Patel S. Free Energetics of Arginine Permeation into Model DMPC Lipid Bilayers: Coupling of Effective Counterion Concentration and Lateral Bilayer Dimensions. J Phys Chem B. 2013;117:11641–11653. doi: 10.1021/jp404829y. [DOI] [PMC free article] [PubMed] [Google Scholar]
- 33.Ou S, Lucas TR, Zhong Y, Bauer BA, Hu Y, Patel S. Free Energetics and the Role of Water in the Permeation of Methyl Guanidinium across the Bilayer–Water Interface: Insights from Molecular Dynamics Simulations Using Charge Equilibration Potentials. J Phys Chem B. 2013;117:3578–3592. doi: 10.1021/jp400389z. [DOI] [PubMed] [Google Scholar]
- 34.Marrink SJ, de Vries AH, Mark AE. Coarse Grained Model for Semiquantitative Lipid Simulations. J Phys Chem B. 2004;108:750–760. [Google Scholar]
- 35.Marrink SJ, Risselada HJ, Yefimov S, Tieleman DP, de Vries AH. The MARTINI Force Field: Coarse Grained Model for Biomolecular Simulations. J Phys Chem B. 2007;111:7812–7824. doi: 10.1021/jp071097f. [DOI] [PubMed] [Google Scholar]
- 36.Monticelli L, Kandasamy SK, Periole X, Larson RG, Tieleman DP, Marrink SJ. The MARTINI Coarse-Grained Force Field: Extension to Proteins. J Chem Theory Comput. 2008;4:819–834. doi: 10.1021/ct700324x. [DOI] [PubMed] [Google Scholar]
- 37.Hu Y, Patel S. Structural and Thermodynamic Insight into Spontaneous Membrane-Translocating Peptides Across Model PC/PG Lipid Bilayers. J Membr Biol. 2014:1–11. doi: 10.1007/s00232-014-9702-8. [DOI] [PubMed] [Google Scholar]
- 38.Hu Y, Sinha SK, Patel S. Reconciling Structural and Thermodynamic Predictions Using All-Atom and Coarse-Grain Force Fields: The Case of Charged Oligo-Arginine Translocation Into DMPC Bilayers. J Phys Chem B. 2014;118:11973–11992. doi: 10.1021/jp504853t. [DOI] [PMC free article] [PubMed] [Google Scholar]
- 39.Wu Z, Cui Q, Yethiraj A. A New Coarse-Grained Force Field for Membrane-Peptide Simulations. J Chem Theory Comput. 2011;7:3793–3802. doi: 10.1021/ct200593t. [DOI] [PubMed] [Google Scholar]
- 40.Wu Z, Cui Q, Yethiraj A. Why do arginine and lysine organize lipids differently? Insights from coarse-grained and atomistic simulations. J Phys Chem B. 2013;117:12145–12156. doi: 10.1021/jp4068729. [DOI] [PubMed] [Google Scholar]
- 41.Leontiadou H, Mark AE, Marrink SJ. Molecular dynamics simulations of hydrophilic pores in lipid bilayers. Biophys J. 2004;86:2156–2164. doi: 10.1016/S0006-3495(04)74275-7. [DOI] [PMC free article] [PubMed] [Google Scholar]
- 42.Bennett W, Sapay N, Tieleman DP. Atomistic simulations of pore formation and closure in lipid bilayers. Biophys J. 2014;106:210–219. doi: 10.1016/j.bpj.2013.11.4486. [DOI] [PMC free article] [PubMed] [Google Scholar]
- 43.Santo KP, Irudayam SJ, Berkowitz ML. Melittin creates transient pores in a lipid bilayer: results from computer simulations. J Phys Chem B. 2013;117:5031–5042. doi: 10.1021/jp312328n. [DOI] [PubMed] [Google Scholar]
- 44.Lee H, Larson RG. Coarse-grained molecular dynamics studies of the concentration and size dependence of fifth- and seventh-generation PAMAM dendrimers on pore formation in DMPC bilayer. J Phys Chem B. 2008;112:7778–7784. doi: 10.1021/jp802606y. [DOI] [PMC free article] [PubMed] [Google Scholar]
- 45.Kumar S, Rosenberg JM, Bouzida D, Swendsen RH, Kollman PA. THE weighted histogram analysis method for free-energy calculations on biomolecules. I. The method. J Comp Chem. 1992;13:1011–1021. [Google Scholar]
- 46.Humphrey W, Dalke A, Schulten K. VMD – Visual Molecular Dynamics. J Mol Graphics. 1996;14:33–38. doi: 10.1016/0263-7855(96)00018-5. [DOI] [PubMed] [Google Scholar]
- 47.Chen FY, Lee MT, Huang HW. Evidence for membrane thinning effect as the mechanism for peptide-induced pore formation. Biophys J. 2003;84:3751–3758. doi: 10.1016/S0006-3495(03)75103-0. [DOI] [PMC free article] [PubMed] [Google Scholar]
- 48.Callenberg KM, Latorraca NR, Grabe M. Membrane bending is critical for the stability of voltage sensor segments in the membrane. J Gen Physiol. 2012;140:55–68. doi: 10.1085/jgp.201110766. [DOI] [PMC free article] [PubMed] [Google Scholar]
- 49.Choe S, Hecht KA, Grabe M. A continuum method for determining membrane protein insertion energies and the problem of charged residues. J Gen Physiol. 2009;134:77. doi: 10.1085/jgp.200809959. [DOI] [PMC free article] [PubMed] [Google Scholar]
- 50.Bermudez H, Hammer D, Discher D. Effect of bilayer thickness on membrane bending rigidity. Langmuir. 2004;20:540–543. doi: 10.1021/la035497f. [DOI] [PubMed] [Google Scholar]
- 51.Rawicz W, Olbrich K, McIntosh T, Needham D, Evans E. Effect of chain length and unsaturation on elasticity of lipid bilayers. Biophys J. 2000;79:328–339. doi: 10.1016/S0006-3495(00)76295-3. [DOI] [PMC free article] [PubMed] [Google Scholar]
- 52.Pan J, Tristram-Nagle S, Kučerka N, Nagle JF. Temperature dependence of structure, bending rigidity, and bilayer interactions of dioleoylphosphatidylcholine bilayers. Biophys J. 2008;94:117–124. doi: 10.1529/biophysj.107.115691. [DOI] [PMC free article] [PubMed] [Google Scholar]
- 53.Walrant A, Correia I, Jiao CY, Lequin O, Bent EH, Goasdoué N, Lacombe C, Chassaing G, Sagan S, Alves ID. Different membrane behaviour and cellular uptake of three basic arginine-rich peptides. Biochim Biophys Acta. 2011;1808:382–393. doi: 10.1016/j.bbamem.2010.09.009. [DOI] [PubMed] [Google Scholar]
- 54.Walrant A, Matheron L, Cribier S, Chaignepain S, Jobin ML, Sagan S, Alves ID. Direct translocation of cell-penetrating peptides in liposomes: A combined mass spectrometry quantification and fluorescence detection study. Anal Biochem. 2013;438:1–10. doi: 10.1016/j.ab.2013.03.009. [DOI] [PubMed] [Google Scholar]
- 55.Schmidta N, Mishrab A, Laia GH, Wong GCL. Arginine-rich cell-penetrating peptides. FEBS Lett. 2010;584:1806–1813. doi: 10.1016/j.febslet.2009.11.046. [DOI] [PubMed] [Google Scholar]
- 56.Leontiadou H, Mark AE, Marrink SJ. Antimicrobial peptides in action. J Am Chem Soc. 2006;128:12156–12161. doi: 10.1021/ja062927q. [DOI] [PubMed] [Google Scholar]
- 57.Sengupta D, Leontiadou H, Mark AE, Marrink SJ. Toroidal pores formed by antimicrobial peptides show significant disorder. Biochim Biophys Acta. 2008;1778:2308–2317. doi: 10.1016/j.bbamem.2008.06.007. [DOI] [PubMed] [Google Scholar]
Associated Data
This section collects any data citations, data availability statements, or supplementary materials included in this article.