

Abstract
Background and aims Orchids are known to be particularly sensitive to environmental changes due to their narrow ranges of secondary successional habitats. Lack of data at the community level limits our ability to evaluate how traits of different species influence their responses to habitat change. Here, we used a diachronic survey of Mediterranean orchid communities in Corsica to examine this question.
Methods Using data from two field surveys conducted 27 years apart (1982–84 and 2009–11) at the same 45 sites in Corsica, we evaluated the impact of increase in woody plant cover (WPC) on (i) the richness and composition and (ii) the local extinction/colonization dynamics of orchids. We applied a Bayesian multispecies site-occupancy model to each of the 36 orchid species recorded at these sites to estimate the detection probability of each species, enabling us to account for under-detection in estimating their dynamics.
Key Results Between 1982 and 2011, WPC changed at 82·3 % of sites (increasing at 75·6 %, decreasing at 6·7 %). Despite marked changes in composition of orchid communities at the local scale, no significant change was detected in species richness at the regional scale. Canopy closure affected the probability of new colonization of sites, but had no significant influence on the probability of local extinction. However, the abundance of shade-intolerant species declined more sharply than that of shade-requiring species. Among orchid species, the detection probability was significantly and positively correlated with population density and plant height.
Conclusions This study reveals contrasted dynamics of orchid communities between local and regional scales in Corsica. Although high turnover in communities was found at the local scale, regional species richness was maintained despite major land-use changes. Conserving landscape mosaics could provide locally suitable habitats for orchids of different ecologies to maintain diversity at larger spatial scales.
Keywords: Bayesian model, conservation, Corsica, detectability, endemism, Mediterranean, orchid communities, woody plant cover
INTRODUCTION
Understanding and measuring how the distribution of biodiversity shifts in space and over time as habitats change are central issues in conservation biology. These research questions are of immediate concern in regions where habitat change has an impact on hotspots of biodiversity (Myers et al., 2000). These include the Mediterranean Basin, where the progressive decline of agro-pastoral practices has resulted in marked land-cover changes during the last 50 years (Médail and Quézel, 1999; Underwood et al., 2009; Blondel et al., 2010), as secondary succession has led to the replacement of large areas of open habitats by woodlands (Blondel et al., 2010; Sirami et al., 2010).
Among plants, orchids are particularly sensitive to habitat changes produced by ecological succession or disturbances (e.g. Wotavova et al., 2004; Coates et al., 2006; Vogt-Schilb et al., 2015). Different orchid species display contrasting ecologies and marked preferences for particular ranges of habitats along secondary successions. They are poor competitors when conditions permit high densities of other herbaceous plants (Wotavova et al., 2004; Tremblay et al., 2006; Landi et al., 2009). Most European orchids require high light intensities for photosynthesis, failing to flower and fruit at low light levels (Dorland and Willems, 2006; Jacquemyn et al., 2009). Some orchid species, however, are adapted to these shaded environments and are expected to be favoured by canopy closure. To date, few studies have evaluated the influence of changes in vegetation cover on orchids (Wotavova et al., 2004; Schrautzer et al., 2011), and few of these have been conducted in Mediterranean ecosystems (but see Sirami et al., 2010). Furthermore, studies have focused on a single species (Wotavova et al., 2004; Schrautzer et al., 2011) rather than on the entire orchid community at a site. Due to their contrasting ecologies regarding light requirements, we can expect that different orchid species in a community will respond differently to canopy closure. Changes in light availability can lead to turnover in orchid communities through local extinction (e.g. exclusion of poor competitors), colonization of newly suitable habitats (Grime, 1977; Tilman, 1990) or both. Local species replacements can then translate into shifts of plant communities at the regional scale (Weiss and Jeltsch, 2015), particularly if ecological change is in the same direction across many sites. It is thus important to use different spatial scales to evaluate changes in orchid distribution over time.
Precise characterization of the dynamics of orchid communities is methodologically challenging. Erratic flowering, e.g. in response to climatic variation (Pfeifer et al., 2006), can reduce the detectability of orchid species (Kéry and Gregg, 2003). In addition, great variation in morphological traits among orchid species (Cozzolino and Widmer, 2005) means that some are more easily detectable than others even if all are flowering. As with other plants (Alexander et al., 2012; Garrard et al., 2013), some orchid species can be more frequently overlooked than others due to lesser visual contrasts with the background furnished by habitats. Imperfect detection can lead to underestimation of population sizes or even failure to record particular species at local scales (Kéry et al., 2006; Archaux et al., 2009; MacKenzie et al., 2009; Iknayan et al., 2014). It is therefore important to consider detectability as a factor that can affect the accuracy of estimations of how species are distributed in space and time. For this purpose, site-occupancy models have been developed and successfully applied to different taxonomic groups (e.g. birds: Schaub et al., 2001; plants: Kéry et al., 2010; Fréville et al., 2013). These models can differentiate two key processes: (1) the ecological process of interest; and (2) the observation process that always accompanies field sampling (e.g. differences in detection among individuals or species) and that makes identification of the state process imperfect (Iknayan et al., 2014). These hierarchical models are based on Bayesian approaches and applied to the detection histories of species recorded during replicated surveys at multiple sites. The site-occupancy model can incorporate the observation error in applying information on detectability of a species at sites where it was detected to sites where it was not (Iknayan et al., 2014). These models can then be used to estimate local extinction and colonization dynamics, while accounting for under-detection. Despite the suitability of Bayesian approaches, few studies have applied site-occupancy models to the temporal dynamics of orchid populations (but see Kéry and Gregg, 2004) and none has addressed these questions at the community level.
Using a Bayesian multispecies site-occupancy model, we assessed the temporal dynamics of orchid communities between two field surveys separated by 27 years (1982–84 vs 2009–11) at 45 sites on the Mediterranean island of Corsica (southern France). The aims of the study were (1) to evaluate the influence of canopy closure on orchid dynamics, (2) to identify traits that can influence detectability of orchid species, and (3) to assess whether differences in detectability can lead to biases in the estimation of dynamics based on observations. The following two questions were addressed:
(Question 1) Does secondary succession to closed forest lead to changes in composition of orchid communities as a function of the light requirements of different species? We hypothesized that increased woody plant cover (WPC) leads to replacement of heliophilous (shade-intolerant) species by sciaphilous (shade-requiring) species, resulting in changes in species composition of orchid communities at both local and regional scales (hypothesis 1).
(Question 2) Can field observations be influenced by differential detectability of species and can site-occupancy models help to correct eventual observational biases in the estimation of orchid dynamics? We expected that detection probability differs among orchid species owing to differences in biological traits. We predicted that species with denser populations, taller individuals and larger numbers of flowers, particularly those characterized by vivid colours and a larger labellum, are easier to detect than others, resulting in unequal detectability among orchid species (hypothesis 2).
For this purpose, we first used a classical approach in community analysis to characterize the species richness and composition of orchid communities and their temporal changes (termed as ‘apparent’ dynamics) in response to WPC increase. In the second part of the analysis we used a site-occupancy model to estimate local extinction/colonization dynamics (termed ‘estimated’ dynamics) of orchid species while accounting for under-detection. We evaluated the effect of species traits on detectability and the effect of WPC change on the estimated orchid dynamics. We then compared the results obtained with the two methodological approaches.
MATERIALS AND METHODS
Study site
The study was carried out in Corsica, the fourth largest Mediterranean island (8680 km2 in area, 42°09ʹN – 42°24ʹN to 9°10ʹE – 9°24ʹE). This island extends from sea level to a maximum elevation of 2710 m (Supplementary Data S1). The climate of Corsica is of Mediterranean type; intensity and duration of summer drought and mean annual temperature decrease with elevation (Gamisans and Jeanmonod, 2013). Corsica hosts a high orchid diversity (77 species) and the highest regional density in France, with 8·8 species per 1000 km2 (Bournérias and Prat, 2005). Most of the French orchid species representing conservation priorities occur in this island, with numerous nationally protected species and 20 species that are absent from continental France (Bournérias and Prat, 2005). High levels of endemism are also observed in other plant families in Corsica (Gamisans and Jeanmonod, 2013).
Data collection
Orchid species were sampled at 45 sites in Corsica (Supplementary Data S1), including different habitat types, from open dry grasslands to forests. One of us (P.G.) first observed these sites during 1982–84 (hereafter termed the ‘first survey’). Each site was sampled in one year of this first survey (i.e. in 1982, 1983 or 1984). The observer always recorded the same information: precise localization of the site, date of visit, description of land cover (i.e. habitat type and disturbance regime, including fire, forest practices, agro-pastoral practices), the WPC, the identity of shrub and tree species comprising the WPC, the identification of all orchid species observed in the site and the number of flowering individuals of orchids of each species. The WPC was estimated as the percentage of soil covered by the vertical projection of the aerial portions of woody plants, including shrubs and trees. The same observation protocol was repeated during the three consecutive years 2009–11 (hereafter termed the ‘second survey’). In contrast to the first survey, in the second survey each site was visited in each of the three years. The initial observer (P.G.) again performed the evaluation of WPC and land cover and standardized his species identification and the precise localization of sites with the second observer (B.S.). This allowed straightforward comparison of observations conducted during the two surveys (Archaux et al., 2009). The numbers of sites and orchid species analysed were constrained by the sample of the first survey. In both surveys, each site was revisited at the same date (within ±1 week) according to the yearly pattern of orchid flowering and within the narrow time window during which most orchid species flower. We excluded from the analysis one site that was prone to a high level of disturbance by fire that occurred during the three successive years of the second survey.
Characterization of orchid communities
We first used a classical approach in community analysis based on the observed presence–absence of species and/or abundance of individuals during the first and second surveys. We assembled a binary presence–absence matrix in which each row was a species, each column a site and the entries represented the presence or absence of a species in a site. Here, the maximum possible number of species × site occurrences for a survey corresponded to 1620 (i.e. 36 species × 45 sites, when all species occurred in all sites). We then compared the species × site matrices between the two surveys to evaluate the changes in species occurrences. To characterize the diversity and evenness of orchid communities, we estimated the Shannon–Wiener and Pielou’s evenness indexes for each site (see Oksanen et al., 2015 for more information). These diversity indexes were then averaged among all sites and compared statistically between the two surveys using Student’s test. We considered the number of individuals observed during the sampling year in the first survey, while averaging the number of individuals among the three years of sampling in the second survey. As the number of sampled individuals differed between the two surveys, the number of species was rarefied (Oksanen et al., 2015) to the lowest number of sampled individuals for each site. In two sites, this analysis could not be performed as no individuals were sampled in one of the two surveys. Based on the presence/absence of species, the Jaccard index (J) was used to evaluate similarity in species composition in a same site between the two surveys:
where, for a given site, a is the total number of species in the first survey, b is the total number of species in the second survey and c is the number of species observed during the two surveys. The Jaccard index was then averaged across all sites and we tested whether or not the mean value differed significantly from 1 (i.e. whether community composition differed between the two surveys), based on Student’s test. We used a linear regression model to compare statistically the relationship between the difference, for each site, in species richness and community composition (J) between the first and second surveys, and the change in WPC. For this analysis, we first tested whether the changes in species richness and community composition were significantly related to the number of species present in the first survey, termed the effect of regression towards the mean (e.g. a site with lower species richness may have a higher probability of moving to higher species richness, i.e. of regressing toward the mean; see Kelly and Price, 2005). As a significant relationship between the change in species richness between both surveys and the initial number of species was found (linear regression model, P <0·001), we adjusted the number of species by using the formula proposed by Kelly and Price (2005) to avoid this effect. This formula corresponds to , where r is the correlation term between the number of species per site between the two surveys, X1 and X2 are the number of species in the first and second surveys, respectively, and and are the averaged values of the number of species among sites in the first and second survey, respectively.
Orchid species were characterized as shade-intolerant (heliophilous), shade-tolerant or shade-requiring (sciaphilous) based on the literature (Bournérias and Prat, 2005). To test whether the heliophilous species are replaced by sciaphilous species with increasing WPC, we calculated the relative abundance, as the number of individuals of heliophilous (or sciaphilous) species divided by the total number of individuals of all species, for each of the sites (in which the species of one of these two types were present and in which WPC increased) and the two surveys. This represented n = 11 sites for heliophilous species and n = 3 sites for sciaphilous species. We then averaged the relative abundance of heliophilous (and sciaphilous) species among sites and compared whether the mean values of relative abundance differed significantly from zero based on Student’s test. All analyses were performed using R software (R. 3.2.3, R Core Team 2015, package Vegan; Oksanen et al., 2015).
Design of the site-occupancy model and calculated parameters
In the second part of the analysis, we used the Bayesian site-occupancy model to estimate the detection probability of orchid species and to assess the dynamics after correcting for underestimation of detections (see Kéry and Schaub, 2011, for a review). Generally, site-occupancy modelling analysis is based on the detection (1) and non-detection (0) histories of all species recorded during replicated surveys at a set of sites. This model includes two levels of analysis. The first level is the ecological process governing occupancy of partially observed species, and determining whether the site is occupied or not [Supplementary Data S2 (eqn S1a)]. The second level assesses the detection history from the replicated surveys and determines whether the species has been detected or not, given that the site is occupied [Supplementary Data S2 (eqn S1b)].
Here, the detection probability, i.e. the probability during the survey of observing a species in a site, was estimated on the basis of three successive years in the second survey (2009–11). In the first survey, all sites were not systematically visited in each of the three successive years (1982–84). This led to insufficient detection/non-detection histories to allow estimation of detectability in the first survey. The estimation of detectability in the second survey was therefore applied to the results of the first survey, with the assumption that there were no differences in detectability between the two surveys. We expected that detection probability varied among species and was influenced by biological traits of orchid species (hypothesis 2), i.e. population density, plant height, flower colour, number of flowers and labellum size (Supplementary Data S3). For each species, the values for all these traits were assigned using the literature (Bournérias and Prat, 2005). The values for plant height, number of flowers and labellum size were averaged between the minimum and maximum values given in Bournérias and Prat (2005). We then ranked the species into three or four categories of conspicuousness (detectability) based on their values for these traits (Supplementary Data S3). These categories were incorporated in the model as explanatory variables of the detection probability [Supplementary Data S2 (eqn S2)]. To evaluate the effect of traits on detectability, we first used a one-way ANOVA to test for significant differences in detection probabilities of species among categories of traits. When significant, we then used Tukey’s honestly significant difference (HSD) post hoc test to perform a pair-by-pair comparison of the detection probabilities of species between categories.
While accounting for imperfect detection, we estimated the local extinction and colonization probabilities of each species [Supplementary Data S2 (eqns S3a and S3b), respectively]. The extinction probability was defined as the probability that a species present at a site during the first survey was not present in the second survey and the colonization probability was defined as the probability that a species absent at a site during the first survey appeared in the second survey. The occupancy probability in the second survey was based on the parameters described above [Supplementary Data S2 (eqn S4)] and was defined as the probability that a species has survived (when already present) or has appeared (when absent in the first survey).
To test the effect of habitat changes on orchid dynamics, we examined the relationship between a gradient in WPC change (gWPC) and the extinction and colonization probabilities [Supplementary Data S2 (eqns S3a and S3b)]. The explanatory variable gWPC was characterized by the difference in WPC between the two surveys (change in WPC) and the WPC in the first survey (initial WPC), and was ranked into six semi-quantitative categories (Supplementary Data S4). We assumed that the effect on orchids of an increase in WPC would be more marked in habitats that were initially open than in habitats that were initially partially closed. Thus, the highest value of gWPC was given to sites with both the highest WPC increase and the lowest initial WPC (Supplementary Data S4). We distinguished smaller populations from larger ones to account for the higher risk of local extinction of the former and consequently to avoid a bias when studying the effect of gWPC on orchid dynamics between the two surveys. We thus added, besides gWPC, the effect of small population size on extinction probability [Supplementary Data S2 (eqn S3a)]. For each species detected, we specified whether the number of recorded individuals was small (here arbitrarily defined as five or fewer flowering individuals and coded as ‘1’) or not (‘0’) in a given site. We tested the relationship between gWPC and the extinction and colonization probabilities. We then averaged the estimated values of the slope of this relationship (output of the site-occupancy model) among the different orchid species and used Student’s test to statistically evaluate whether the value of the slope was significantly different from zero. We also tested the effect of initial occurrence of orchid species on their colonization by using a linear regression model to relate the colonization probability with the occupancy probability of the first survey.
To test whether imperfect detection could have led to bias in the estimation of apparent dynamics, we compared the ‘apparent’ occupancy probability with the ‘estimated’ occupancy probability (output of the site-occupancy model). The apparent occupancy probability was calculated for each species, and in each survey, as the number of sites where a species was observed divided by the total number of sites.
Implementation was based on Bayesian analysis using Markov chain Monte Carlo methods. We ran three chains for 5000 iterations and discarded the first 1000. The analysis was conducted using OpenBUGS software (http://openbugs.net/) called by the R program through the package R2OpenBUGS (Sturtz et al., 2010).
RESULTS
Woody plant cover
Between the two surveys, WPC changed at 37 out of 45 sites (increasing at 75·6 % of sites, decreasing at 6·7 % of sites) and was stable in the others (Fig. 1). WPC increased significantly by 17·9 % between the two surveys (Student’s test, P <0·001), from 43·3 ± 3·5 % (mean ± s.e.m.) in the first survey to 61·2 ± 3·4 % in the second survey (Fig. 1). The colonization of sites by Cistus monspeliensis (27 sites) and Erica arborea (14 sites) and the expansion of shrub and tree species already present in the first survey (e.g. Arbutus unedo, Quercus ilex, 18 sites) were the main processes underlying the WPC change. Other trees and shrubs (Phillyrea angustifolia, Olea europaea, Juniperus oxycedrus subsp. oxycedrus, Rosa canina and Myrtus communis) made lesser contributions to the change in WPC.
Fig. 1.
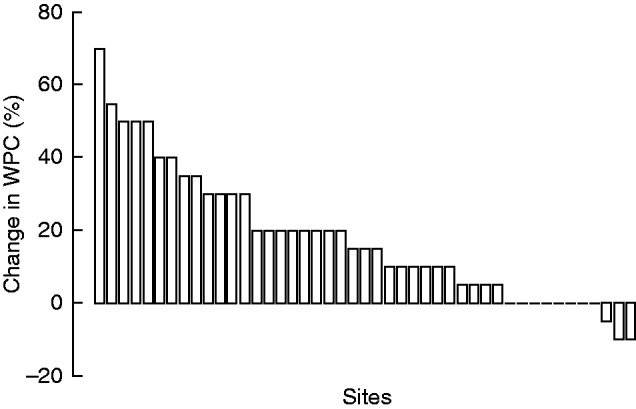
WPC change between the first (1982–84) and second (2009–11) surveys for each sampling site.
Richness and composition of the orchid communities
In the first survey, 4466 orchid individuals were observed; in the second survey 8379 individuals were observed (Table 1). Anacamptis papilionacea subsp. papilionacea contributed predominantly to the increase in number of individuals, with 387 observed in the first survey compared with 2211 in the second survey. The individuals recorded represented 36 orchid species, including four that are Cyrno-Sardean endemics (Supplementary Data S5). Among all sampled orchid species, 34 were observed in both surveys, whereas Ophrys speculum was only observed in the first survey and Spiranthes aestivalis was only observed in the second survey (Table 1). The species × site occurrences were 197 in the first survey and 218 in the second survey, with 52 occurrences that were lost and 73 occurrences that were gained.
Table 1.
Species richness, diversity and composition of orchid communities in the 45 sampling sites between the two surveys
| First survey | Second survey | |
|---|---|---|
| Total number of species | 35 | 35 |
| Rarefied number of species | 35 | 34·63 |
| Shannon – Wiener index (H′)1 | 1·02 ± 0·08a | 1·04 ± 0·06a |
| Pielou’s evenness1 | 0·78 ± 0·02a | 0·73 ± 0·03a |
| Total number of individuals2 | 4466 | 8379 |
| Jaccard index1 ,3 | 0·55 ± 0·04*** | |
1These estimators are mean numbers (± s.e.m.) for each survey that were averaged among sampling sites. The same letters indicate no significant difference (P>0·05) between the two surveys based on Student’s test.
2The number of individuals was averaged among the three sampling years in the case of the second survey.
3The Jaccard index measures the similarity in community composition for a given site between the two surveys. The averaged value among sites was compared with 1 (i.e. same community composition), based on Student’s test.
***P<0·001.
The species richness stayed constant between the two surveys at local and regional scales (Table 1). The species richness per site did not differ significantly between the two surveys, with a mean value (± s.e.m.) of 4.38 ± 0·40 and 4·84 ±0·34, respectively (Student’s test, P >0·05). This was also the case regarding species diversity (Shannon–Wiener index) per site between the two surveys (Table 1, Student’s test, P >0·05). Pielou’s evenness value was 0·78 and 0·73 for the first and second surveys, respectively (Table 1, Student’s test, P >0·05). The number of species changed at 38 out of 45 sites (decrease at 17 sites, increase at 21 sites), but was not significantly correlated to WPC change (Fig. 2A, linear regression model, R2 < 0·1, P >0·05). This result was similar when the rarefied number of species was considered.
Fig. 2.
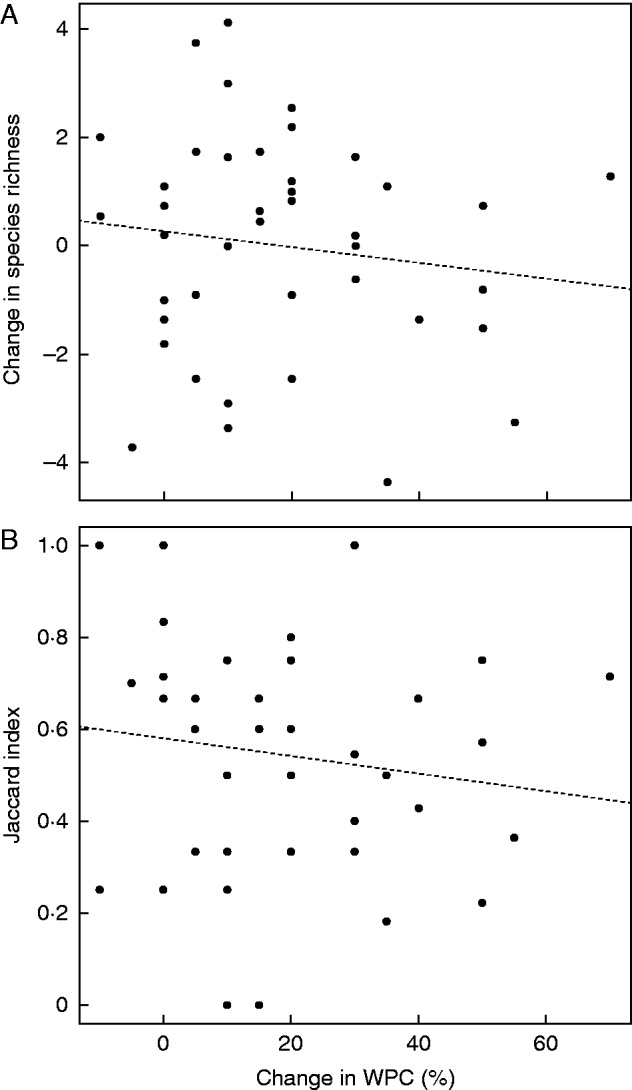
Changes in the richness and composition of orchid communities along the gradient of habitat change. The two panels show the differences between the two surveys in the adjusted number of species (A) and Jaccard index (B) of orchid communities as a function of WPC changes. The Jaccard index measured the similarity in species composition of the same site between the two surveys. The index ranged from 0 (no similarity in species composition between the two surveys) to 1 (same species composition between the two surveys). The number of species was adjusted to correct the effect of regression towards the mean (see Materials and methods for more details). The dashed lines represent the linear relationship of the adjusted number of species and the Jaccard index as a function of WPC change based on the linear regression model.
With regard to species composition, the mean value of the Jaccard index was significantly different from 1, indicating that species composition changed significantly between the two surveys at the local scale (Table 1, Student’s test, P <0·001, J = 0.55 ±0·04). Whereas there were no significant differences in the relative abundance of sciaphilous species between the two surveys at sites where WPC increased (Student’s test, P >0·05), the number of individuals of heliophilous species decreased significantly (mean ± s.e.m. −8·42 ± 2·74 %, Student’s test, P <0·05). Heliophilous species decreased at ten out of the 11 sites where these species were present and WPC increased. The high local turnover in species composition did not lead, however, to significant changes at regional scales. As shown for species richness, the community composition did not change significantly with increasing WPC, despite a decreasing trend in the Jaccard index (Fig. 2B, linear regression model, R² <0·1, P >0·05).
Detection, extinction and colonization probabilities of orchid species
Based on the site-occupancy model, the mean detection probability of orchid species was 0.91 ±0·01 and ranged from 0·81 to 0·96 (Supplementary Data S5). The lowest detection probability was identified for Serapias parviflora and the highest detection probabilities were shown for species such as Anacamptis laxiflora and A. papilionacea (Supplementary Data S5). Detection probability was significantly higher for species characterized by denser populations (Fig. 3A, ANOVA, P <0·001) and taller individual plants (Fig. 3B, ANOVA, P <0·05) than the other species. No significant differences in detection probability were shown to be related to differences in flower colour, number of flowers per individual and labellum size (Fig. 3C–E, ANOVA, P >0·05).
Fig. 3.

Biological traits influencing detection probability. Boxplot of the detection probability of orchid species for each trait [population density (A), plant height (B), flower colour (C), number of flowers (D) and labellum size (E)] ranked from the lowest to the highest values of expected influence on detectability. See Supplementary Data S3 for more details of the different categories. Different letters indicate a significant difference (P< 0·05) in detection probabilities of species between categories for a given trait based on the Tukey HSD post hoc test. The cross inside the boxplot corresponds to the mean value of detection probability for a given category.
Correcting for under-detection resulted in calculation of a mean extinction probability of 0·46 ±0·05, which varied among species from 0·03 (for Serapias lingua) to 0·91 (for Serapias vomeracea) (Supplementary Data S5). No significant linear relationship was detected between extinction probability and gWPC change (Student’s test, slope estimate compared with zero, P >0·05). The mean colonization probability was 0·07±0·01 and varied among species from 0·02 (e.g. Dactylorhiza insularis) to 0·34 (for S. lingua) (Supplementary Data S5). Colonization probability was negatively correlated with gWPC increase, as the mean value of the slope of this linear relationship was significantly negative (−0·98 ± 0·16, Student’s test, slope estimate compared with zero, P <0·001), and positively correlated with occupancy probability in the first survey (Supplementary Data S6, linear regression model, R² =0·34, P <0·001). This means that species already present in a larger number of sites more frequently colonized new sites than did species that are limited in their distribution across Corsica. As a result of colonization–extinction dynamics, the occupancy probability for the second survey varied from 0·03 to 0·58 with one of the lowest values found for the Cyrno-Sardean endemic species Ophrys marmorata (Supplementary Data S5). The occupancy probability of Cyrno-Sardean endemic species averaged 0.065 ±0·02 (n =4 species, Supplementary Data S5).
Comparisons between apparent and estimated dynamics
The apparent and estimated occupancy probabilities were significantly and positively correlated for the first (Supplementary Data S7A, linear regression model, R2 = 0·99, P < 0·001) and second (Supplementary Data S7B, linear regression model, R2 = 0·97, P <0·001) surveys. The averaged estimated occupancy probability among species was higher than the apparent occupancy probability in both the first survey (0.15 ±0·02 and 0.12 ±0·02, respectively) and the second survey (0.15 ±0·02 and 0.13 ±0·02, respectively), but no significant difference in either occupancy probability was detected between surveys (Student’s test, P >0·05). However, unequal detectability led to more or less marked differences among orchid species between the estimated and apparent occupancy probabilities (Supplementary Data S7).
DISCUSSION
Our study is based on a unique dataset on changes in orchid presence and woody plant cover over a period of 27 years. The scarcity of such data limits our ability to evaluate the influence of habitat changes on orchid dynamics. One of the reasons is linked to the difficulty of investigating this group due to their quite erratic flowering patterns (e.g. dormancy) (Shefferson et al., 2001; Kéry and Gregg, 2004). In addition, among orchid species there is considerable variation in traits (morphology, population density) that can influence detectability in field observations, resulting in underestimations of orchid presence. Studying this biological group is thus particularly challenging. Our study was based on a diachronic analysis of differences in orchid presence in sampling between two surveys. Interpretation of results is thus dependent on the initial sampling effort. In the first survey, each site was only studied during one year of a 3-year period, in contrast to the second survey, during which each site was visited in each of three successive years. We are thus confronted with an unavoidable bias, in which ‘colonization’ is expected to be overestimated, as there were no repeated visits during the first survey. A single visit is generally considered as insufficient to count all species at a site. It has previously been shown that, on average, ∼80 % of plant species are detected during a single visit (Kéry et al., 2006; Vogt-Schilb et al., 2013). Two to four years of sampling provide a more exhaustive view, as some difficult-to-detect species (e.g. those for which individuals are smaller or occur at lower densities) may be overlooked during a single visit (Kéry et al., 2006; Vogt-Schilb et al., 2013). To diminish this effect and account for imperfect detection, we thus used a site-occupancy model. In our analysis, as the same observer participated in both surveys and because there is no obvious reason to expect that the traits of species affecting the detection probability had a different effect in the past, we estimated the probability of detection of orchid species in the first survey, based on results of the repeated visits in the second survey. The model thus corrected for possible differences linked to trait variations among orchids, but could not account for possible inter-annual variability in flowering patterns. Conversely, such bias is unlikely to affect estimation of local extinctions. If a species was found in the first survey, there is no reason to expect that it could escape detection during the second survey, when prospecting efforts were greater. Despite these sources of bias, site-occupancy models greatly improve our ability to interpret and discuss the trends in species dynamics in Corsica.
Effects of habitat change on orchid dynamics
In 27 years, WPC increased significantly by almost 20 % (Fig. 1). This is mainly due to the colonization of sites by two shrubs, E. arborea and C. monspeliensis. This expansion of shrubland at the expense of open habitat is the result of the general agro-pastoral abandonment of land along the northern rim of the Mediterranean Basin (Debussche et al., 1999; Mouillot et al., 2005; Sirami et al., 2010). We expected that an increase in WPC would affect orchid dynamics by leading to a reduction in light availability and increased competition with the surrounding vegetation (hypothesis 1), as shown in previous studies (e.g. Wotavova et al., 2004). Our results enable partial rejection of this hypothesis because we found that WPC increase had no effect on orchid persistence at the local scale, whereas it significantly reduced orchid colonization in space. This may suggest that canopy closure has a greater impact on the dispersal of orchids than on their persistence, but further analyses are needed, especially regarding colonization. The majority of orchid species may be tolerant to reduced light availability at the beginning of vegetation closure (P. Geniez and B. Schatz, pers. comm.) and be maintained by plastic responses (e.g. increased height growth in response to reduced light availability; Schrautzer et al., 2011). However, when considering only the orchid species we recorded that are most sensitive to low light availability (i.e. A. laxiflora, S. aestivalis and Spiranthes spiralis), we found that heliophilous species decreased in abundance at the majority of sites under canopy closure. Over the longer term, these species may disappear locally with further increase in WPC and be replaced by more shade-tolerant species.
Regional species richness remained constant, despite marked changes in orchid species composition at the local scale (Table 1) and WPC increase (Fig. 1). This regional stability may be linked to the high diversity in habitats that can host orchid species with different ecological requirements. As changes in abiotic and biotic environmental factors differ among sites, some species will be favoured and occupy more sites, whereas others will be disadvantaged and decrease (Levin, 2000; Brown et al., 2001).
Other factors may also influence the dynamics of orchid communities, e.g. the distribution patterns of different species. We found that species with the highest probability of colonizing new sites were mostly species that were already widely distributed among sites (Supplementary Data S6). Similar observations have been reported for the genus Eupatorium (Asteraceae), in which narrowly endemic species have lower colonization abilities than their widespread relatives (Byers and Meagher, 1997). Species with narrow geographical distributions may produce significantly fewer seeds per unit of measurement and show lower dispersal abilities than common species, as revealed in the meta-analysis conducted by Murray et al. (2002). Simultaneously, low values of occupancy and colonization probabilities of orchids were detected in the case of Cyrno-Sardean endemic species (Supplementary Data S5). This restricted distribution of endemic species is linked to environmental and historical factors of the Corsica–Sardinia island complex (Médail and Verlaque, 1997). For example, some endemic species have specific habitats, such as Ophrys peraiolae, which is limited to sandy dunes in the northern part of Corsica (Bournérias and Prat, 2005). Under the pressure of environmental change, the distributions of these endemic species are at risk of further reduction. This fact, combined with their low colonization abilities, could lower their probability of persistence over the longer term.
Effects of traits on detectability
We also tested how traits influence the detectability of orchid species and whether imperfect detection can affect the apparent dynamics of orchid communities (hypothesis 2). Based on the site-occupancy model, the detection probability of the studied orchid species was 0·91, similar to that found for Cypripedium calceolus var. parviflorum (0·91 in Shefferson et al., 2001) and Cleistes bifaria (1 in Kéry and Gregg, 2003). The detection probability of orchids is relatively high compared with that of other vascular plants (e.g. detection probability of 0.81 ±0·01 for 67 species of the ground vegetation layer; Archaux et al., 2009). This difference can be explained by, among other factors, the long experience of the observers in our study and the fact that they focused on one plant group. Nevertheless, all orchid species were not equally detectable (compare e.g. S. parviflora and A. laxiflora; Supplementary Data S5). Among orchid species, detectability was significantly correlated with population density and plant height (Fig. 3) in accordance with our hypothesis 2 and previous studies (Chen et al., 2009; Alexander et al., 2012). It is not surprising that isolated individuals may be more easily overlooked during monitoring than ones present at high density, leading to underestimation of the presence of rare species (Iknayan et al., 2014). Smaller plants may be more easily hidden by the surrounding vegetation than taller ones, as hypothesized by Kéry and Gregg (2003). Other traits suspected to affect orchid detectability (flower colour, number of flowers, labellum size) had no significant effect on detectability in our study (Fig. 3).
Our study did not reveal a significant overall effect of imperfect detection on the apparent occupancy by orchid species (Supplementary Data S7). The use of classical community analysis in the first part of our study can thus be validated, particularly when larger scales are considered. However, effects were not uniform among species. For some species with low detection probability, the uncorrected occupancy probability was biased. Similar conclusions were made in a study that revealed a biased effect of imperfect detection on the extinction probability of 11 plant species (Kéry et al., 2006). At the local scale, the high turnover of communities revealed by the classical approaches was confirmed when correcting for under-detection, as marked variations in local extinction/colonization among orchid species were found (Supplementary Data S5). Despite the great similarity in the results given by the two approaches, we suggest that both should be used, as they have complementary advantages for studying temporal changes in plants at different levels (e.g. community composition vs species dynamics). The use of a site-occupancy model is particularly relevant for application to orchids, especially in multi-species studies, to minimize observational errors by taking into account their unequal detectability.
Conclusions
Based on different spatial scales and long-term diachronic approaches, our study revealed contrasted distribution patterns of orchids between local and regional scales in Corsica. At the local scale, our study revealed a remarkably high turnover of orchids under canopy closure; heliophilous species decreased in abundance at the expense of more shade-tolerant species. Contrasting distribution patterns induced different dynamics of orchids that mostly contribute to the turnover. Conversely, at the regional scale, species richness remained constant over the study period. The maintenance of species richness in changing environments can be linked to the diversity in this region of habitats that are suitable for orchids of different ecologies. Nevertheless, marked shifts in orchid communities could arise in the future under the combined effects of rapidly increasing canopy closure, fire regimes and urbanization rates, which constitute major threats on the island. The ranges of endemic species risk even further reduction in size, potentially leading to local extinction. Conservation efforts are thus needed to preserve these Corsican orchid endemics by preventing habitat destruction in particularly fragile zones (e.g. dunes, wetlands and old forests) or restoring damaged habitats. The use of contrasted management of mowing and land abandonment may be a good way to conserve the landscape mosaics. Further investigations involving longer time intervals, larger areas or both need to be carried out to better evaluate the drivers of the spatiotemporal distribution of orchids in Mediterranean ecosystems.
SUPPLEMENTARY DATA
Supplementary data are available online at www.aob.oxfordjournals.org and consist of the following. Data S1: sampling sites in Corsica in regard to elevational range. Data S2: description of the model used in the study. Data S3: description and categories of biological traits of orchids. Data S4: gradient of environmental changes (gWPC). Data S5: parameters of the dynamics of orchid species based on the site-occupancy model. Data S6: effect of spatial occurrence of species on their colonization. Data S7: comparison between the estimated and apparent occupancy probabilities in the first (A) and second surveys (B).
ACKNOWLEDGEMENTS
This work was funded by the National Botanical Conservatory of Corsica (no. 082037), by the ‘Observatoire de Recherche Méditerranéen de l’Environnement’ (OSU-OREME) (Mediterranean Research Observatory of Environment) and by a CIFRE convention (no. 187/2011) between the French National Association for Research and Technology (ANRT) and Biotope Ltd. We thank Sylvie Agret, Marc Cheylan, Marcelle and Marie-Germaine Conrad, Jean-Marie Curien, Philippe Dabin, Florence Delay, Roger Engel, Pascal Escudié, Camille Gallet, Julien Givord, Nina Joffard, Olivier Patrimonio, Yohan Petit, Françoise Poitevin, Isabelle Schatz and Julien Viglione, who helped during fieldwork. Finally, we are particularly grateful to Dr Zhun Mao (YEAINI) for critical advice on data analysis and Professor Doyle McKey (CEFE, Montpellier) for helpful comments on our manuscript and English correction.
LITERATURE CITED
- Alexander HM, Reed AW, Kettle WD, et al. 2012. Detection and plant monitoring programs: lessons from an intensive survey of Asclepias meadii with five observers. PLoS One 7(12): e52762. [DOI] [PMC free article] [PubMed] [Google Scholar]
- Archaux F, Camaret S, Dupouey JL, et al. 2009. Can we reliably estimate species richness with large plots? An assessment through calibration training. Plant Ecology 203: 303−315. [Google Scholar]
- Blondel J, Aronson J, Bodiou JY, Bœuf G. 2010. The Mediterranean Region: biological diversity in space and time, 2nd edn Oxford University Press. [Google Scholar]
- Bournérias M, Prat D. 2005. Les orchidées de France, Belgique et Luxembourg, 2nd edn Mèze: Biotope. [Google Scholar]
- Brown JH, Ernest SM, Parody JM, Haskell JP. 2001. Regulation of diversity: maintenance of species richness in changing environments. Oecologia 126: 321−332. [DOI] [PubMed] [Google Scholar]
- Byers DL, Meagher TR. 1997. A comparison of demographic characteristics in a rare and a common species of Eupatorium. Ecological Applications 7: 519−530. [Google Scholar]
- Chen G, Kéry M, Zhang J, Ma K. 2009. Factors affecting detection probability in plant distribution studies. Journal of Ecology 97: 1383–1389. [Google Scholar]
- Coates F, Lunt ID, Tremblay RL. 2006. Effects of disturbance on the population dynamics of the threatened orchid, Prasophyllum correctum D.L. Jones and implications for grassland management in south-eastern Australia . Biological Conservation 129: 59–69. [Google Scholar]
- Cozzolino S, Widmer A. 2005. Orchid diversity: an evolutionary consequence of deception? Trends in Ecology & Evolution 20: 487–494. [DOI] [PubMed] [Google Scholar]
- Debussche M, Lepart J, Dervieux A. 1999. Mediterranean landscape changes: evidence from old postcards. Global Ecology and Biogeography 8: 3–15. [Google Scholar]
- Dorland E, Willems JH. 2006. High light availability alleviates the costs of reproduction in Ophrys insectifera (Orchidaceae). Journal Europäischer Orchideen 38: 369–386. [Google Scholar]
- Fréville H, Choquet R, Pradel R, Cheptou PO. 2013. Inferring seed bank from hidden Markov models: new insights into metapopulation dynamics in plants. Journal of Ecology 101: 1572–1580. [Google Scholar]
- Gamisans J, Jeanmonod D. 2013. Flora Corsica, 2nd edn Bulletin de la société Botanique du Centre-Ouest. [Google Scholar]
- Garrard GE, McCarthy MA, Williams NSG, Bekessy SA, Wintle BA. 2013. A general model of detectability using species traits. Methods in Ecology and Evolution 4: 45–52. [Google Scholar]
- Grime JP. 1977. Evidence for the existence of three primary strategies in plants and its relevance to ecological and evolutionary theory. American Naturalist 111: 1169–1194. [Google Scholar]
- Iknayan KJ, Tingley MW, Furnas BJ, Beissinger SR. 2014. Detecting diversity: emerging methods to estimate species diversity. Trends in Ecology & Evolution 29: 97–106. [DOI] [PubMed] [Google Scholar]
- Jacquemyn H, Brys R, Adriaens D, Honnay O, Roldán-Ruiz I. 2009. Effects of population size and forest management on genetic diversity and structure of the tuberous orchid Orchis mascula. Conservation Genetics 10: 161–168. [Google Scholar]
- Kelly C, Price TD. 2005. Correcting for regression to the mean in behavior and ecology. American Naturalist 166: 700–707. [DOI] [PubMed] [Google Scholar]
- Kéry M, Gregg KB. 2003. Effects of life-state on detectability in a demographic study of the terrestrial orchid Cleistes bifaria. Journal of Ecology 91: 265–273. [Google Scholar]
- Kéry M, Gregg KB. 2004. Demographic analysis of dormancy and survival in the terrestrial orchid Cypripedium reginae. Journal of Ecology 92: 686–695. [Google Scholar]
- Kéry M, Schaub M. 2011. Bayesian population analysis using WinBUGS: a hierarchical perspective Academic Press. [Google Scholar]
- Kéry M, Spillmann JH, Truong C, Holderegger R. 2006. How biased are estimates of extinction probability in revisitation studies? Journal of Ecology 94: 980–986. [Google Scholar]
- Kéry M, Gardner B, Monnerat C. 2010. Predicting species distributions from checklist data using site-occupancy models. Journal of Biogeography 37: 1851–1862. [Google Scholar]
- Landi M, Frignani F, Lazzeri C, Angiolini C. 2009. Abundance of orchids on calcareous grasslands in relation to community species, environmental, and vegetational conditions. Russian Journal of Ecology 40: 486–494. [Google Scholar]
- Levin SA. 2000. Multiple scales and the maintenance of biodiversity. Ecosystems 3: 498–506. [Google Scholar]
- MacKenzie DI, Nichols JD, Seamans ME, Gutiérrez RJ. 2009. Modeling species occurrence dynamics with multiple states and imperfect detection . Ecology 90: 823–835. [DOI] [PubMed] [Google Scholar]
- Médail F, Quézel P. 1999. Biodiversity hotspots in the Mediterranean Basin: setting global conservation priorities. Conservation Biology 13: 1510–1513. [Google Scholar]
- Médail F, Verlaque R. 1997. Ecological characteristics and rarity of endemic plants from southeast France and Corsica: implications for biodiversity conservation. Biological Conservation 80: 269–281. [Google Scholar]
- Mouillot F, Ratte J, Joffre R, Mouillot D, Rambal S. 2005. Long-term forest dynamic after land abandonment in a fire prone Mediterranean landscape (central Corsica, France). Landscape Ecology 20: 101–112. [Google Scholar]
- Murray BR, Thrall PH, Gill AM, Nicotra AB. 2002. How plant life‐history and ecological traits relate to species rarity and commonness at varying spatial scales. Austral Ecology 27: 291–310. [Google Scholar]
- Myers N, Mittermeier RA, Mittermeier CG, Da Fonseca GA, Kent J. 2000. Biodiversity hotspots for conservation priorities. Nature 403: 853–858. [DOI] [PubMed] [Google Scholar]
- Oksanen J, Blanchet G, Kindt Ret al. 2015. Vegan: Community ecology package R package. Version 2.2.1. https://CRAN.R-project.org/package=vegan (last accessed 17 July 2015).
- Pfeifer M, Wiegand K, Heinrich W, Jetschke G. 2006. Long-term demographic fluctuations in an orchid species driven by weather: implications for conservation planning. Journal of Applied Ecology 43: 313–324. [Google Scholar]
- R Development Core Team 2015. R: a language and environment for statistical computing. R Foundation for Statistical Computing, Vienna, Austria. [Google Scholar]
- Schaub M, Pradel R, Jenni L, Lebreton JD. 2001. Migrating birds stop over longer than usually thought: an improved capture-recapture analysis. Ecology 82: 852–859. [Google Scholar]
- Schrautzer J, Fichtner A, Huckauf A, Rasran L, Jensen K. 2011. Long-term population dynamics of Dactylorhiza incarnata (L.) Soó after abandonment and re-introduction of mowing. Flora 206: 622–630. [Google Scholar]
- Shefferson RP, Sandercock BK, Proper J, Beissinger SR. 2001. Estimating dormancy and survival of a rare herbaceous perennial using mark-recapture models. Ecology 82: 145–156. [Google Scholar]
- Sirami C, Nespoulous A, Cheylan JP. et al. 2010. Long-term anthropogenic and ecological dynamics of a Mediterranean landscape: impacts on multiple taxa. Landscape and Urban Planning 96: 214–223. [Google Scholar]
- Sturtz S, Ligges U, Gelman A. 2010. R2OpenBUGS: a package for running OpenBUGS from R.
- Tilman D. 1990. Constraints and tradeoffs: toward a predictive theory of competition and succession. Oikos 58: 3–15. [Google Scholar]
- Tremblay RL, Meléndez-Ackerman E, Kapan D. 2006. Do epiphytic orchids behave as metapopulations? Evidence from colonisation, extinction rates and asynchronous population dynamics. Biological Conservation 129: 70–81. [Google Scholar]
- Vogt-Schilb H, Geniez P, Pradel R, Richard F, Schatz B. 2013. Inter-annual variability in flowering of orchids: lessons learned from 8 years of monitoring in a Mediterranean region of France. European Journal of Environmental Sciences 3: 129–137. [Google Scholar]
- Vogt-Schilb H, Munoz F, Richard F, Schatz B. 2015. Recent declines and range changes of orchids in Western Europe (France, Belgium and Luxembourg). Biological Conservation 190: 133–141. [Google Scholar]
- Underwood EC, Viers JH, Klausmeyer KR, Cox RL, Shaw MR. 2009. Threats and biodiversity in the Mediterranean biome. Diversity and Distributions 15: 188–197. [Google Scholar]
- Weiss L, Jeltsch F. 2015. The response of simulated grassland communities to the cessation of grazing. Ecological Modelling 303: 1–11. [Google Scholar]
- Wotavova K, Balounova Z, Kindlmann P. 2004. Factors affecting persistence of terrestrial orchids in wet meadows and implications for their conservation in a changing agricultural landscape. Biological Conservation 118: 271–279. [Google Scholar]
Associated Data
This section collects any data citations, data availability statements, or supplementary materials included in this article.