

Abstract
Background and Aims A well-supported classification is crucial for conservation planning, but intricate species complexes constitute a serious challenge to the preparation of flora accounts. In preparation of the Flora of Thailand account on Geodorum (Orchidaceae), it was decided to use multivariate morphometric analysis and genetic fingerprinting to resolve the intricate G. pulchellum sensu Seidenfaden/G. siamense species complex, with the specific aim of testing the taxonomic soundness of the apparently rare and conservation-requiring G. pulchellum sensu Seidenfaden. Geodorum densiflorum, universally considered distinct from the above species complex, was included as reference.
Methods Morphometric data and tissue samples for amplified fragment length polymorphism (AFLP) analysis were collected from 17 Geodorum populations in northern and north-eastern Thailand. Principal components analysis was employed to summarize the patterns of phenetic variation. Hierarchical genetic differentiation between populations was explored using Bayesian inference followed by cluster analysis.
Key Results The taxonomic distinction of G. densiflorum was generally supported. In contrast, G. siamense and G. pulchellum sensu Seidenfaden were poorly separated, especially according to the estimated patterns of inter-population genetic differentiation.
Conclusions The G. pulchellum sensu Seidenfaden/G. siamense complex should be treated as one variable species (under the name G. siamense), meaning that G. pulchellum sensu Seidenfaden should not be given high independent conservation priority. This study demonstrates that flora accounts can benefit from prior employment of multivariate and Bayesian methods for exploring intricate species complexes, in turn leading to more solid decisions and priorities in a conservation context.
Keywords: AFLP, Bayesian inference, conservation, dominant markers, Flora of Thailand, flower colour polymorphism, Geodorum, morphometry, Orchidaceae, species delimitation, taxonomy
INTRODUCTION
An informative, transparent and operational classification is crucial for science-based conservation strategies and for preparation of Red Lists based on IUCN criteria (e.g. Schuiteman and de Vogel, 2003; Isaac et al., 2004). For many conservation-related purposes, regional and national flora handbooks are the most intensively used surveys and identification tools (e.g. Funk, 2006). Although flora accounts usually comprise original work, their scientific quality might benefit from targeted precursory studies.
The Flora of Thailand project was established in 1963, and more than half of the estimated 10 000 species of vascular plants in Thailand have now been treated. The orchid volume will consist of six parts, two of which have been published already (Pedersen et al., 2011, 2014). The first complete revision of the Thai orchid flora was published by Seidenfaden and Smitinand (1959–1965),and the second by Seidenfaden (1975–1980, 1982–1988); the Flora of Thailand orchid volume represents the third complete revision. For an explicit comparison, see Pedersen (2013).
One serious challenge that is often encountered when preparing flora contributions are intricate species complexes which cannot be resolved through conventional revisions using herbarium material. In such cases, it is often helpful to employ multivariate statistical analysis, preferably based on standardized sampling of natural populations and including both morphometric and molecular data. Following such a study, it is realistic to prepare a reliable flora account that would otherwise have been poorly supported. As an example, we here present a study of a taxonomically challenging species complex in the genus Geodorum.
Geodorum consists of terrestrial herbs distributed in tropical Asia, western and northern Australia and the West Pacific islands (south-east to Niue). Species-level taxonomy in the genus is notoriously difficult, mainly due to insufficient or lacking type material and to floral characters being poorly preserved in dried material (e.g. Garay and Sweet, 1974; Seidenfaden, 1984; Pridgeon et al., 2009). Indeed, the general taxonomic uncertainty implies lacking knowledge of the delimitation, occurrence and range size of individual species throughout the genus. As a consequence of this, dubious taxonomy occasionally compromises apparently important information on rarity or conservation status. For example, G. eulophioides Schltr. from China and Myanmar is referred to as being ‘one of the rarest Chinese orchids’ (Liu, 2010) and ‘critically endangered’ (Ying et al., 2014), but it is actually an imperfectly known species (Chen et al., 2009, p. 260) that we consider to be of questionable taxonomic soundness. Another example is the plant that Seidenfaden (1984) treated under the name G. pulchellum Ridl. Judging from the list of known occurrences provided by Seidenfaden (1984, p. 57), this taxon is exceedingly rare and potentially in need of targeted conservation measures in Thailand, but at the same time its taxonomic status seems questionable.
For the preparation of the Flora of Thailand account on Geodorum, we decided to use multivariate morphometric analysis and genetic fingerprinting to assess whether the morphologically similar taxa that Seidenfaden (1984) referred to as G. pulchellum Ridl. and G. siamense Rolfe ex Downie should be treated as distinct species or merged into one (with consequences for the potential conservation needs of the former, allegedly rare taxon). This overall methodological strategy was inspired by previous successful orchid studies using similarly combined molecular and morphometric data from sampling of natural populations (e.g. Shipunov et al., 2004; Bernardos et al., 2005; Pedersen and Hedrén, 2010).
MATERIALS AND METHODS
Study taxa
The type material of G. pulchellum represents the earlier described and taxonomically distinct G. recurvum (Roxb.) Alston, for which reason the name G. pulchellum should be considered a synonym of the latter (Pedersen et al., 2014). The white-flowered plants that Seidenfaden (1984) erroneously called G. pulchellum Ridl. (primarily based on his studies of Thai material) in reality have not been formally described as a distinct species, so we accordingly refer to this taxon as ‘G. pulchellum sensu Seidenfaden’
Typical individuals of the largely white-flowered G. pulchellum sensu Seidenfaden and the yellow-flowered G. siamense look strikingly different because of their contrasting flower colours. However, intermediate individuals occur. Furthermore, the taxa have identical phenology and habitat requirements, and they often form mixed colonies. The total distribution of the species complex consisting of G. pulchellum sensu Seidenfaden and G. siamense is centred in Thailand, from where it extends to Myanmar, southern China (Yunnan), Vietnam and Cambodia (Pedersen et al., 2014). Until now, all other authors dealing with these taxa have treated them as separate species, but we felt that a closer study was needed. To view the observed variation in a wider taxonomic perspective, we included samples of G. densiflorum (Lam.) Schltr. In spite of the pervasive taxonomic confusion in the genus, G. densiflorum has never been treated as conspecific with G. pulchellum sensu Seidenfaden or G. siamense, and it has been generally considered to differ in a number of morphological characters (e.g. Seidenfaden, 1984; Chen et al., 2009). Therefore, we expected that the magnitude of genetic and morphometric differences between G. densiflorum on the one hand and G. pulchellum sensu Seidenfaden/G. siamense on the other could be a useful reference when interpreting differentiation in the latter species complex in a taxonomic context. According to the Plant DNA C-values Database (http://data.kew.org/cvalues/; accessed 5 October 2015), the genome size of our study species or any other Geodorum species has not been measured.
Sampling and morphometric procedure
Seventeen natural populations were sampled in northern and north-eastern Thailand (Table 1), representing a fairly wide core area in the total range of the G. pulchellum sensu Seidenfaden/G. siamense complex. All individuals were identified as G. densiflorum, G. pulchellum sensu Seidenfaden or G. siamense using the Geodorum key in Seidenfaden (1984); as no mixed colonies were encoutered, this procedure also provided initial identifications at the population level (Table 1). At each site, 5–28 individuals were selected at random in an area of up to 20 × 20 m, depending on population density. Six vegetative and 19 floral characters for morphometric analysis (Table 2) were scored from each individual. When choosing the characters, we took great care to avoid partial duplication of information, i.e. only morphologically independent characters were chosen. In principle, it would have been desirable to include a higher number of vegetative characters (cf. Tetsana et al., 2014), but this would have required additional sampling rounds (and long-term marking of individual plants in the field), as the leaves are not fully developed at anthesis in all our study taxa. Vegetative characters were measured using a ruler. Floral features were scored from one fully expanded flower (preserved in 70 % ethanol) from the mid-portion of the spike (cf. Bateman and Rudall, 2006); size measurements were taken by means of an object micrometer and a low-power binocular microscope.
Table 1.
Survey of the Thai populations of Geodorum examined, indicating the original identifications at the time of sampling (ID1), the final identifications based on our data and analyses as outlined in the Discussion (ID2) and the number of individuals sampled for morphometric analysis (Nmorph.) and AFLP analysis (NAFLP)
| Number | ID1 | ID2 | Province | Locality | Nmorph. | NAFLP |
|---|---|---|---|---|---|---|
| 1 | D | D | Chiang Mai | Doi Lo | 14 | 5 |
| 2 | D | D | Lampang | Tom Chang | 6 | 5 |
| 3 | D | D | Nakhon Sawan | Takfaa | 16 | – |
| 4 | D | D | Phrae | Ban Mae Wa | 6 | 5 |
| 5 | D | D | Phrae | Mae Wa National Park | 6 | – |
| 6 | D | D | Loei | Phu Phaman | 24 | – |
| 7 | D | D | Phetchabun | Khao Hin Prakarung | 28 | 5 |
| 8 | P | S | Chiang Mai | Wat Chan | 5 | 5 |
| 9 | P | S | Tak | Doi Hua Mot | 8 | 5 |
| 10 | P | S | Tak | Palatha | 13 | 5 |
| 11 | P | S | Tak | Se Pa La | 8 | 5 |
| 12 | P | S | Uttaradit | Huai Mun | 27 | – |
| 13 | S | S | Chiang Mai | Doi Saket | 6 | – |
| 14 | S | S | Chiang Mai | Mae Rim | 6 | 4 |
| 15 | S | S | Chiang Mai | Saluang | 6 | 5 |
| 16 | S | S | Phayao | University of Phayao | 6 | 4 |
| 17 | S | S | Tak | Ban Mai Paka | 10 | 4 |
D, G. densiflorum; P, G. pulchellum sensu Seidenfaden; S, G. siamense.
Table 2.
List of the morphometric characters scored (19 quantitative, six binary)
| 1 | Length of vegetative shoot, from ground level to apex of longest leaf when stretched (cm) |
| 2 | Length of inflorescence, measured from ground level (cm) |
| 3 | Distal half of rachis erect to horizontal (0) or more or less pendent (1)* |
| 4 | Number of flowers |
| 5 | Length of floral bract (mm) |
| 6 | Maximum width of floral bract (mm) |
| 7 | Ground colour of dorsal sepal white (0) or greenish-yellow (1)* |
| 8 | Length of dorsal sepal (mm) |
| 9 | Maximum width of dorsal sepal (mm) |
| 10 | Number of primary veins in dorsal sepal |
| 11 | Dorsal sepal without (0) or with (1) a dorsal keel* |
| 12 | Length of right lateral sepal (mm) |
| 13 | Maximum width of right lateral sepal (mm) |
| 14 | Number of veins from the base of right lateral sepal |
| 15 | Length of right petal (mm) |
| 16 | Maximum width of right petal (mm) |
| 17 | Number of veins from the base of right petal |
| 18 | Right petal without (0) or with (1) a dorsal keel* |
| 19 | Length of labellum (mm) |
| 20 | Maximum width of labellum (mm) |
| 21 | Depth of labellum (mm), measured along hind edge to apex of sac (or corresponding concavity) |
| 22 | Labellum without (0) or with (1) a ventral callus* |
| 23 | Apex of labellum truncate to rounded (0) or sub-acute to acute (1)* |
| 24 | Length of column (mm) |
| 25 | Length of ovary, including pedicel (mm) |
*Binary character.
Genetic fingerprinting was based on sampling of all or (mostly) a sub-set of the measured individuals in 12 study populations (the remaining five study populations had to be omitted for practical reasons). Apical leaf tissue (4–8 cm2 per individual) was collected from 57 individuals (Table 1) and dried in silica gel for subsequent extraction of DNA followed by amplified fragment length polymorphism (AFLP) analysis. In agreement with the model-based recommendations of Reisch and Bernhardt-Römermann (2014), we put more emphasis on securing a high maximum geographical distance between study populations and less on maximizing the number of populations or individuals sampled.
Genetic fingerprinting
DNA extraction was accomplished using a GF-1 Plant DNA extraction kit (Vivantis, India). The technique was modified according to Agrawal et al. (1992), and AFLP reactions were performed as described by Vos et al. (1995).
A TProfessional Basic Gradient Thermal Cycler was used for all PCR amplifications. Pre-selective PCR started with an initial step of 95 °C for 2 min, followed by 20 cycles of 30 s at 94 °C, 60 s at 56 °C and 60 s at 72 °C. Final elongation was carried out at 60 °C for 30 min. The product was visualized on a 1 % agarose gel in TAE buffer after diluting the pre-selective reactions 20-fold with 1× TE 0·1 m buffer.
In the second selective round of PCR, 5 μL of pre-amplified DNA was added to the selective amplification pre-mix, the latter consisting of 8·3 μL of ddH2O, 2 μL of 10× polymerase buffer, 2 μL of dNTP mix (2 mm), 1 μL of EcoRI primer (5 pmol μL−1), 1 μL of MseI primer (5 pmol μL−1) and 0·5 U of Taq DNA polymerase. Selective PCR amplification started at 94 °C for 30 s, 65 °C for 30 s and 72 °C for 60 s. A touchdown protocol was applied in the following 12 cycles of 30 s at 94 °C, 30 s at 64 °C (1 °C decrease each cycle) and 60 s at 72 °C. This was followed by 23 cycles of 30 s at 94 °C, 30 s at 56 °C and 60 s at 72 °C. Final elongation took place at 60 °C for 30 min and paused with 4 °C.
Initially, a trial was conducted using 64 different normal genome selective primer combinations, and those that gave the most interpretable bands were chosen for the analysis. The following 12 primer pairs were chosen: EcoRI-AAC/MseI-CTA, EcoRI-AAC/MseI-CTC, EcoRI-AAC/MseI-CTG, EcoRI-AAG/MseI-CAG, EcoRI-AAG/MseI-CAT, EcoRI-ACA/MseI-CTG, EcoRI-ACA/MseI-CTT, EcoRI-ACC/MseI-CAG, EcoRI-ACG/MseI-CTC, EcoRI-ACG/MseI-CTT, EcoRI-AGC/MseI-CAA and EcoRI-AGC/MseI-CTA.
Selective amplification products were separated by vertical polyacrylamide gel electrophoresis using the Thermo Scientific™ Owl™ S3S System Combs and Owl™ EC3000XL Programmable Power Supply. A 6 % polyacrylamide gel was used, the run time was 2–3 h at 50 W, and the banding patterns were visualized by the silver staining technique of Blum et al. (1987). Amplified fragments between approx. 100 and approx. 725 bp were then scored by visual inspection of gels for the presence (1) or absence (0) of individual bands. To ascertain the reproducibility of the results, a limited number of samples were amplified and analysed twice. To avoid ambiguities, only distinct, reproducible, well-resolved bands that were scoreable across samples were considered for the data analysis.
Data analysis
Patterns of morphological variation were summarized using principal components analysis (PCA; Sneath and Sokal, 1973). Using the program NTSYSpc 2.0 (Rohlf, 1998), separate analyses were conducted for populations and individuals. In the former, population means were calculated for each of the quantitative characters, whereas binary characters were treated as frequencies. All characters were standardized prior to analysis. A corresponding pair of PCAs was performed on the AFLP phenotypes, i.e. the banding patterns observed on the gels. Each band was treated as a binary character (0 = absent; 1 = present), and for each band the frequencies of state 1 in population samples were adopted as putatively representative population values. To assess how well the original proximities were preserved, a minimum spanning tree (MST) based on average taxonomic distances (Sneath and Sokal, 1973) was superimposed on the PCA plots from analyses performed on population values. Finally, separate PCAs were performed on specimen values of G. pulchellum sensu Seidenfaden and G. siamense only, in order to enhance resolution within this complex.
Due to the dominant nature of AFLPs, allele frequencies cannot be estimated directly without a priori knowledge of the inbreeding coefficient. However, genotypic differentiation among populations (in terms of Wright’s classical F-statistics) can be inferred by Bayesian approaches to analysis of hierarchical genetic data.
Adopting the Bayesian approach developed by Holsinger (1999), Holsinger et al. (2002) and Holsinger and Wallace (2004), we analysed genetic differentiation between all possible pairwise combinations of our study populations based on AFLP data. We particularly addressed the two statistics theta-I and theta-II (for algorithms and theoretical background, see Holsinger and Lewis, 2007). Theta-I is the best estimate of Wright’s FST, as it corresponds to a scaled allele frequency variance, where the variance is measured across evolutionary time (assuming that the underlying stochastic evolutionary process has a stationary distribution) or across evolutionary replicates (Fu et al., 2003; Song et al., 2006; Holsinger and Lewis, 2007). Theta-II, corresponding to theta-B of Holsinger et al. (2002) and Holsinger and Wallace (2004), provides the best estimate of the proportion of genetic diversity due to differences among contemporaneous populations (a statistic similar to Nei’s GST), cf. Holsinger and Lewis (2007).
The analyses of genetic differentiation were run in Hickory v1.1 (Holsinger and Lewis, 2007) using the default settings of the program (sampler parameters: burnin = 5000, sample = 100 000, thin = 20). Before commencing the numerous analyses of paired population samples, three different statistical models were tested through analyses performed on all population samples of G. densiflorum (populations 1, 2, 4 and 7), G. pulchellum sensu Seidenfaden (populations 8–11) and G. siamense (populations 14–17), respectively: (A) a ‘full’ model incorporating estimation of f (a statistic similar to FIS); (B) a model assuming Hardy–Weinberg proportions in the populations (i.e. f = 0); and (C) an f-free model (in which the sampler chose values of f at random from its prior distribution while estimating other parameters during the Markov chain Monte Carlo run). The final choice between alternative statistical models was based on the deviance information criterion (DIC; Spiegelhalter et al., 2002).
To explore the hierarchical patterns of genetic differentiation among the study populations, two cluster analyses were performed in the program NTSYSpc 2.0. Both dendrograms were constructed by means of the unweighted pair-group method using arithmetic averages (UPGMA) algorithm (Legendre and Legendre, 1983), applying the pairwise theta-I and theta-II values, respectively, as dissimilarity measures.
RESULTS
Morphometry
Variation along the first two axes from the PCA performed on morphometric population values of all study taxa is illustrated in Fig. 1A. Variation was 40·8 % along PC axis 1 and 18·8 % along PC axis 2. All taxa occupy non-overlapping areas. However, the superimposed MST indicates that population 15, originally identified as G. siamense, is more similar to population 10, originally identified as G. pulchellum sensu Seidenfaden, than to any of the other populations referred to as G. siamense. Contributions of individual characters to the first two multivariate axes are listed in Table 3. Characters 9 (maximum width of dorsal sepal), 16 (maximum width of right petal) and 20 (maximum width of labellum) made the largest contributions to the first axis, whereas characters 8 (length of dorsal sepal), 12 (length of right lateral sepal) and 15 (length of right petal) made the largest contributions to the second axis.
Fig. 1.
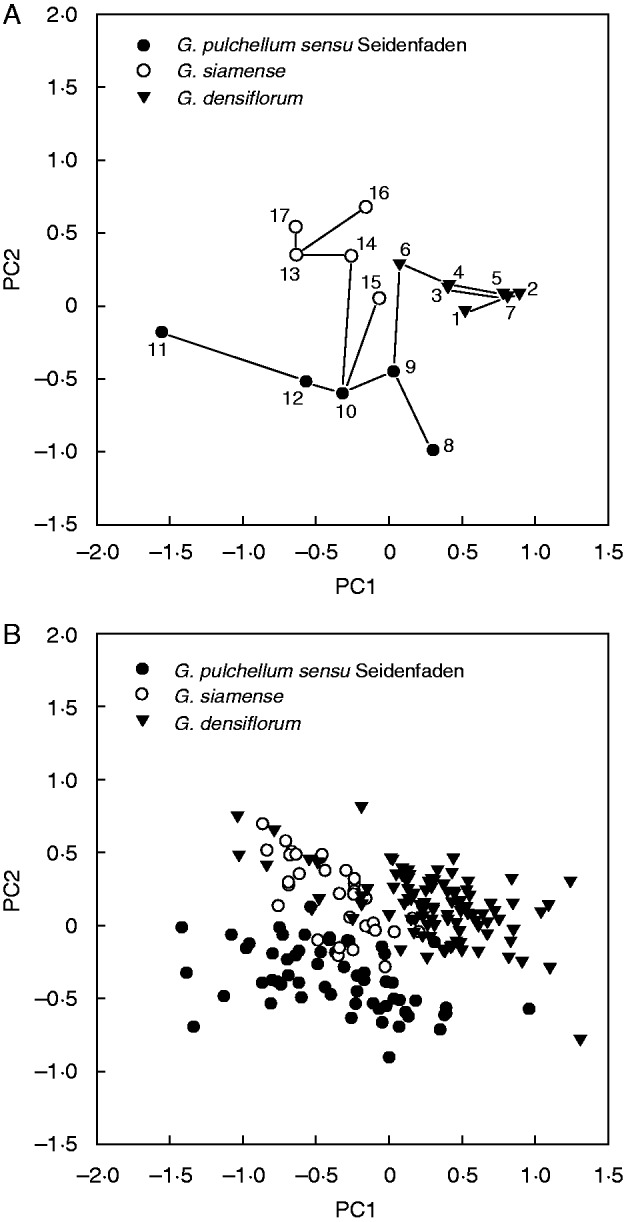
Plots from the first two principal components (PCs) of the principal components analysis (PCA) performed on morphometric data for all study taxa; symbols show original identifications. (A) Plot from the analysis conducted on population values (populations numbered according to Table 1), with an MST superimposed. (B) Plot from the analysis conducted on values for individual plants.
Table 3.
Contributions of individual characters to the first two multivariate axes of the principal components analyses (PCAs) performed on morphometric data from study populations of Geodorum (cf. Figs 1 and 2A)
| Character |
Fig. 1A |
Fig. 1B |
Fig. 2A |
|||
|---|---|---|---|---|---|---|
| PC1 | PC2 | PC1 | PC2 | PC1 | PC2 | |
| 1 | 0·71 | 0·05 | 0·67 | 0·34 | 0·05 | 0·42 |
| 2 | 0·70 | −0·25 | 0·57 | 0·11 | 0·57 | 0·05 |
| 3 | 0·20 | −0·34 | 0·13 | −0·25 | 0·15 | 0·23 |
| 4 | −0·57 | −0·50 | −0·16 | −0·47 | −0·19 | 0·63 |
| 5 | −0·23 | 0·22 | 0·21 | 0·00 | 0·05 | 0·20 |
| 6 | 0·31 | 0·27 | 0·21 | −0·04 | 0·04 | 0·11 |
| 7 | −0·37 | 0·60 | −0·29 | 0·28 | 0·02 | −0·86 |
| 8 | 0·45 | −0·82 | 0·56 | −0·74 | 0·69 | 0·54 |
| 9 | 0·93 | −0·14 | 0·84 | 0·08 | 0·75 | 0·00 |
| 10 | 0·65 | 0·33 | 0·30 | 0·21 | 0·34 | −0·21 |
| 11 | 0·54 | 0·56 | 0·41 | 0·35 | 0·18 | −0·43 |
| 12 | 0·62 | −0·70 | 0·66 | −0·63 | 0·76 | 0·47 |
| 13 | 0·88 | −0·18 | 0·78 | 0·09 | 0·66 | 0·08 |
| 14 | 0·22 | 0·47 | 0·16 | 0·15 | 0·15 | −0·07 |
| 15 | 0·38 | −0·78 | 0·51 | −0·74 | 0·77 | 0·47 |
| 16 | 0·94 | 0·08 | 0·79 | 0·14 | 0·68 | −0·26 |
| 17 | 0·47 | 0·43 | 0·31 | 0·30 | 0·29 | −0·49 |
| 18 | 0·33 | 0·66 | 0·27 | 0·54 | 0·02 | −0·50 |
| 19 | 0·87 | −0·25 | 0·83 | −0·27 | 0·88 | 0·00 |
| 20 | 0·91 | 0·15 | 0·85 | 0·19 | 0·77 | −0·36 |
| 21 | 0·73 | 0·55 | 0·71 | 0·28 | 0·57 | −0·58 |
| 22 | −0·77 | 0·22 | −0·29 | −0·02 | −0·26 | −0·13 |
| 23 | −0·24 | 0·45 | 0·06 | 0·03 | 0·04 | −0·22 |
| 24 | 0·87 | 0·24 | 0·59 | 0·17 | 0·28 | −0·15 |
| 25 | 0·82 | 0·05 | 0·75 | 0·01 | 0·57 | 0·03 |
Characters are numbered according to Table 2.
Variation along the first two axes from the PCA performed on morphometric specimen values of all study taxa is illustrated in Fig. 1B. Variation was 29·3 % along PC axis 1 and 11·2 % along PC axis 2. Geodorum densiflorum and G. pulchellum sensu Seidenfaden occupy largely (though not completely) complementary areas to the upper right and lower left, respectively. Geodorum siamense occupies a smaller area that is broadly overlapping with both of the other taxa. Contributions of individual characters to the first two multivariate axes are listed in Table 3. Characters 9 (maximum width of dorsal sepal), 19 (length of labellum) and 20 (maximum width of labellum) made the largest contributions to the first axis, whereas characters 8 (length of dorsal sepal), 12 (length of right lateral sepal) and 15 (length of right petal) made the largest contributions to the second axis.
Variation along the first two axes from the PCA performed on morphometric specimen values of G. pulchellum sensu Seidenfaden and G. siamense only are illustrated in Fig. 2A. Variation was 23·7 % along PC axis 1 and 14·0 % along PC axis 2. The two taxa are almost completely separated along the second axis. Contributions of individual characters to the first two multivariate axes are listed in Table 3. Characters 15 (length of right petal), 19 (length of labellum) and 20 (maximum width of labellum) made the largest contributions to the first axis, whereas characters 4 (number of flowers), 7 (ground colour of dorsal sepal white vs. greenish-yellow) and 21 (depth of labellum) made the largest contributions to the second axis.
Fig. 2.
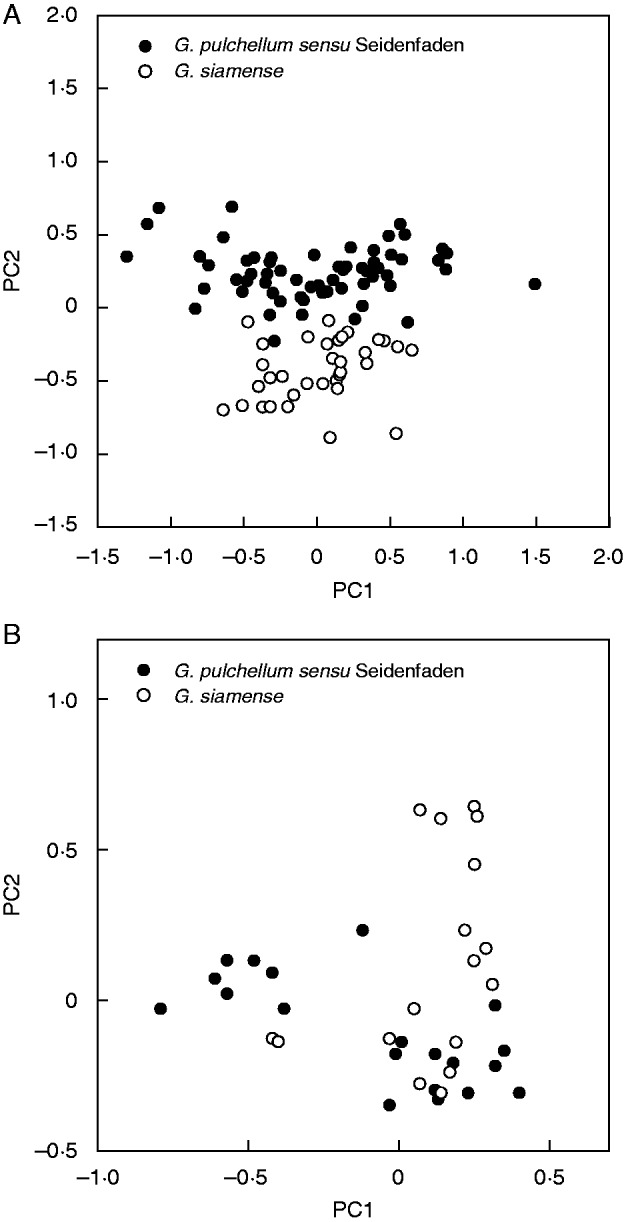
Plots from the first two principal components (PCs) of the principal components analyses (PCA) performed on values for individual plants of Geodorum pulchellum sensu Seidenfaden and G. siamense only. (A) Plot from the analysis conducted on morphometric data. (B) Plot from the analysis conducted on AFLP phenotypic data.
Genetic fingerprinting
From the 12 selected primer pairs, 124 different AFLP bands were scored, 123 of which (99·2 %) were polymorphic across all samples. Geodorum densiflorum had 121 polymorphic bands (97·6 %), G. pulchellum sensu Seidenfaden had 112 (90·3 %) and G. siamense had 106 (85·5 %).
Variation along the first two axes from the PCA performed on AFLP phenotypic population values of all study taxa is illustrated in Fig. 3A. Variation was 27·2 % along PC axis 1 and 13·9 % along PC axis 2. All taxa occupy non-overlapping areas, mainly separated along the first axis. However, whereas G. densiflorum is widely separated from the other taxa, G. pulchellum sensu Seidenfaden and G. siamense occupy immediately neighbouring areas. Furthermore, the superimposed MST indicates that population 14, originally identified as G. siamense, is more similar to population 11, originally identified as G. pulchellum sensu Seidenfaden, than to any of the other populations referred to as G. siamense.
Fig. 3.
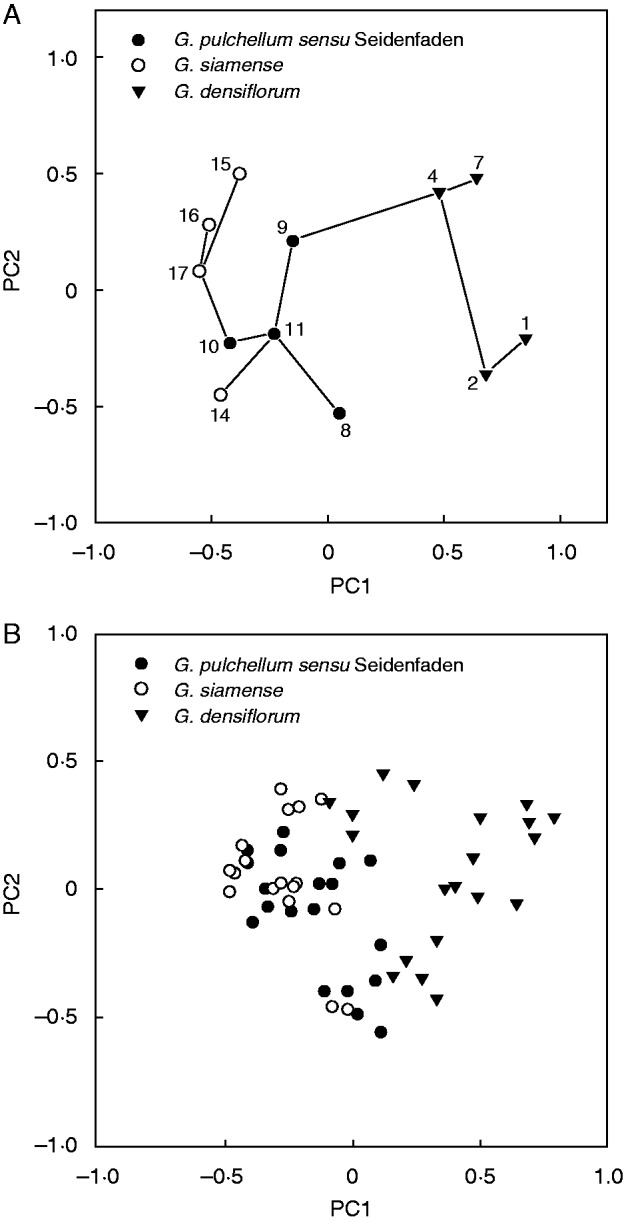
Plots from the first two principal components (PCs) of the principal components analyses (PCA) performed on AFLP phenotypic data for all study taxa; symbols show original identifications. (A) Plot from the analysis conducted on population values (populations numbered according to Table 1), with an MST superimposed. (B) Plot from the analysis conducted on values for individual plants.
Variation along the first two axes from the PCA performed on AFLP phenotypic specimen values of all study taxa is illustrated in Fig. 3B. Variation was 11·6 % along PC axis 1 and 6·9 % along PC axis 2. Apart from a minor overlap with G. pulchellum sensu Seidenfaden, G. densiflorum is separated (mainly along the first axis) from the largely confluent area occupied by the two other taxa.
Variation along the first two axes from the PCA performed on AFLP phenotypic specimen values of G. pulchellum sensu Seidenfaden and G. siamense only are illustrated in Fig. 2B. Variation was 10·5 % along PC axis 1 and 8·3 % along PC axis 2. The two taxa are broadly overlapping.
Concerning the Bayesian inference of genotypic differentiation, those initial analyses that used the full statistical model consistently had the smallest DIC, irrespective of taxon (Table 4). Consequently, the subsequent analyses of paired population samples were run using the full statistical model. All analyses yielded higher values for theta-I than theta-II. The dendrograms resulting from the cluster analyses are shown in Fig. 4. In both dendrograms, the four populations of G. densiflorum constitute one main cluster; the other main cluster accommodates all our study populations of G. pulchellum sensu Seidenfaden and G. siamense, but those populations do not form two taxonomically defined sub-clusters.
Table 4.
Survey of the DIC values that resulted from testing of three statistical models through analyses performed on AFLP data from all population samples of each individual study taxon (cf. Table 1)
| Taxon | Model A | Model B | Model C |
|---|---|---|---|
| Geodorum densiflorum | 1462·62 | 1472·16 | 1500·47 |
| Geodorum pulchellum sensu Seidenfaden | 1311·86 | 1317·40 | 1345·46 |
| Geodorum siamense | 1129·08 | 1138·42 | 1151·20 |
The models included were: (A) a ‘full’ model incorporating estimation of f; (B) a model assuming Hardy–Weinberg proportions in the populations, i.e. f = 0; and (C) an f-free model.
Fig. 4.
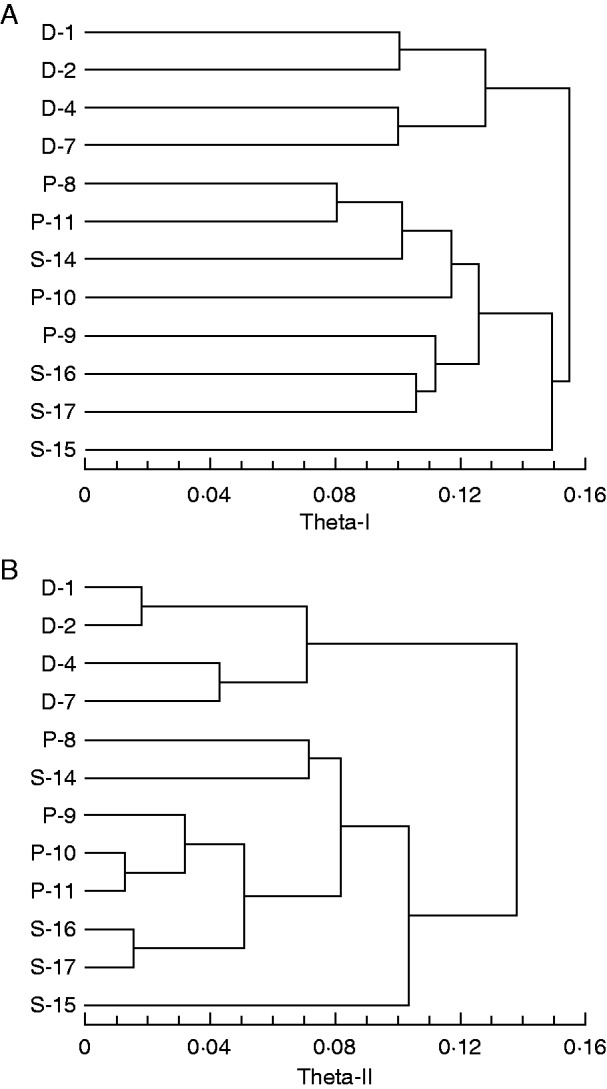
Dendrograms showing genotypic relationships between the sampled populations of Geodorum based on AFLP data. The cluster analyses, constructed by the UPGMA algorithm, were based on dissimilarity matrices consisting of (A) theta-I values and (B) theta-II values, respectively. Populations are numbered according to Table 1; the letter used as prefix of each number indicates the original identification (D, G. densiflorum; P, G. pulchellum sensu Seidenfaden; S. G. siamense).
DISCUSSION
Patterns of differentiation in the G. pulchellum sensu Seidenfaden/G. siamense complex
In the plots from the PCAs that employed various phenotypic data and were performed on values for individual plants of all study taxa, the areas occupied by G. pulchellum sensu Seidenfaden and G. siamense were more or less overlapping (Figs 1B and 3B). This overlap was either absent (Fig. 1A) or much less pronounced (Fig. 3A) in the plots from the corresponding PCAs performed on population values. However, it should be remembered that PCAs performed on population values capture less variation; and, in each case, a superimposed MST indicates that one population sample identified as G. siamense (population 14 according to AFLP phenotypic data, population 15 according to morphometric data) is in reality more similar to a population sample identified as G. pulchellum sensu Seidenfaden than to any other population sample identified as G. siamense. The plots from the PCAs performed on values for individual plants of G. pulchellum sensu Seidenfaden and G. siamense only (Fig. 2) show conflicting patterns. According to morphometric data, the two taxa are almost completely distinct (Fig. 2A), whereas they exhibit a broad overlap according to AFLP phenotypic data (Fig. 2B). Finally, both the theta-I and theta-II estimates of genetic differentiation (Fig. 4) indicate that our study populations of G. pulchellum sensu Seidenfaden and G. siamense do not fall into two groups. Thus, our results generally do not support the taxonomic perception of earlier authors (e.g. Seidenfaden, 1984; Averyanov and Averyanova, 2003; Chen et al., 2009) that the complex consists of two species.
In the plot from the PCA that employed morphometric data and was performed on values for individual plants of G. pulchellum sensu Seidenfaden and G. siamense only (Fig. 2A), the two taxa are almost completely separated along PC axis 2. Several characters contributed significantly to the variation along this axis, especially (in descending order, cf. Table 3): ground colour of dorsal sepal, number of flowers, depth of labellum and length of dorsal sepal. Thus, although the existence of two species is not supported by estimated genetic differentiation among populations (Fig. 4), a certain degree of genetically determined character intercorrelation (cf. Tetsana et al., 2014) seems to occur.
In both plots from the PCAs performed on population values (Figs 1A and 3A), the superimposed MST indicates that one population identified as G. siamense is more similar to a population identified as G. pulchellum sensu Seidenfaden than to any other G. siamense population. The circumstance that the apparently misidentified population is not the same in the two plots (based on morphometric and AFLP data, respectively) might rely on phenotypic plasticity. However, we did not gather any data on habitat variables that could potentially shed light on this.
Taxonomic inferences
When comparing the plots from the PCAs that employed various phenotypic data and were performed on population values of all study taxa, the G. pulchellum sensu Seidenfaden/G. siamense complex is distinct from G. densiflorum both according to AFLP phenotypic data (Fig. 3A) and according to morphometric data (Fig. 1A). The separation from G. densiflorum is also congruent with the plots from the PCAs that employed various phenotypic data and were performed on values for individual plants (Figs 1B and 3B), and it is further supported by both dendrograms from the cluster analyses based on estimated genetic differentiation among populations (Fig. 4). The generally higher values obtained for theta-I relative to theta-II (cf. Fig. 4A vs. B) were expected, as theta-II only estimates the proportion of genetic diversity due to differences among contemporaneous populations; cf. Holsinger et al. (2002), Holsinger and Wallace (2004) (both as theta-B) and Holsinger and Lewis (2007). Thus, assuming that our study populations (at least within species) are partially coupled through gene flow, allele frequencies are correlated and frequency variation between populations at any one point in time will be smaller than variation in individual populations over time.
In the plot from the PCA that employed morphometric data and was performed on values for individual plants of all study taxa (Fig. 1B), the sampled individuals of G. siamense are distributed in a narrow boundary zone that overlaps with the areas occupied by G. densiflorum and G. pulchellum sensu Seidenfaden, respectively. Relying on the commonly recognized trend of hybrids to be morphologically intermediate between parental taxa (e.g. Nilsson, 1985; Aagaard et al., 2005; De hert et al., 2012), the pattern in Fig. 1B might suggest that G. siamense in reality consists of hybrids between the other two taxa. However, with the possible exception of the PCA that employed morphometric data and was performed on population values (Fig. 1A), this interpretation is not supported by any other analysis in our study (Figs 2–4).
Admitting that further studies (preferably using a sensitive co-dominant marker system) are desirable, we think, based on current evidence, that G. pulchellum sensu Seidenfaden and G. siamense should be interpreted as one morphologically polymorphic, but genetically coherent, species. The largely discrete flower colour variation may represent a system parallel to the thoroughly studied flower colour polymorphism in the European Dactylorhiza sambucina (cf. Gigord et al., 2001; Pellegrino et al., 2005a, b; Jersáková et al., 2006; Pedersen, 2006); just like D. sambucina (e.g. Nilsson, 1980), G. siamense sensu lato does not produce nectar or any other pollinator reward.
Conclusions
The traditional perception that the complex primarily targeted in this study consists of two distinct species (G. pulchellum sensu Seidenfaden and G. siamense) was not supported. Together, our phenotypic and estimated genotypic data suggest that only one species should be recognized (under the name G. siamense). This naturally implies that the allegedly rare G. pulchellum sensu Seidenfaden should not be given high independent conservation priority.
Although recognition of a genetically distinct G. densiflorum is supported by (or at least congruent with) the patterns of variation exhibited by morphometric data, the estimated genetic differentiation among populations provided even stronger support and would also have been sufficient to propose the merger of G. pulchellum sensu Seidenfaden with G. siamense. Therefore, we conclude that Bayesian inference of genotypic differentiation, originally developed for ecological population genetics (Holsinger, 1999; Holsinger et al., 2002; Holsinger and Wallace, 2004), offers a powerful tool to supplement the usual phenotypic analyses of dominant marker data in taxonomic studies.
The taxonomic conclusion above was recently adopted in Flora of Thailand (Pedersen et al., 2014, citing this paper with the statistical evidence as in prep.). Thus, our example from Geodorum fully demonstrates how flora contributions can benefit from precursory studies like this and, in turn, offer a more reliable basis for setting conservation priorities. We would not have been able to reach an equally well supported taxonomic conclusion without the use of morphometric analysis and genetic fingerprinting based on sampling of natural populations.
ACKNOWLEDGEMENTS
We thank Woranuch La-ongsri for assistance with population sampling, Udomsin Kuna for assistance with scoring of morphometric characters, and two anonymous reviewers for suggestions that improved the manuscript. This work was supported by the Augustinus Foundation [10-2820 to H.Æ.P.].
LITERATURE CITED
- Aagaard SMD, Såstad SM, Greilhuber J, Moen A. 2005. A secondary hybrid zone between diploid Dactylorhiza incarnata ssp. cruenta and allotetraploid D. lapponica (Orchidaceae). Heredity 94: 488–496. [DOI] [PubMed] [Google Scholar]
- Agrawal GK, Pandey RN, Agrawal VP. 1992. Isolation of DNA from Choerospondias asillaris leaves. Biotechnology and Biodiversity Letters 2: 19–24. [Google Scholar]
- Averyanov LV, Averyanova AL. 2003. Updated checklist of the orchids of Vietnam. Hanoi: Vietnam National University Publishing House. [Google Scholar]
- Bateman RM, Rudall PJ. 2006. Evolutionary and morphometric implications of morphological variation among flowers within an inflorescence: a case-study using European orchids. Annals of Botany 98: 975–993. [DOI] [PMC free article] [PubMed] [Google Scholar]
- Bernardos S, Crespi A, Del Rey F, Amich F. 2005. The section Pseudophrys (Ophrys, Orchidaceae) in the Iberian Peninsula: a morphometric and molecular analysis. Botanical Journal of the Linnean Society 148: 359–375. [Google Scholar]
- Blum H, Beier H, Gross HJ. 1987. Improved silver staining of plant proteins, RNA and DNA in polyacrylamide gels. Electrophoresis 8: 93–99. [Google Scholar]
- Chen X, Cribb PJ., Gale SW. 2009. Geodorum Jackson In: Wu Z, Raven PH, D Hong. eds. Flora of China 25. Orchidaceae. Beijing: Science Press; St. Louis: Missouri Botanical Garden Press, 258–260. [Google Scholar]
- De hert K, Jacquemyn H, Van Glabeke S. et al. 2012. Reproductive isolation and hybridization in sympatric populations of three Dactylorhiza species (Orchidaceae) with different ploidy levels. Annals of Botany 109: 709–720. [DOI] [PMC free article] [PubMed] [Google Scholar]
- Fu R, Gelfand AE, Holsinger KE. 2003. Exact moment calculations for genetic models with migration, mutation and drift. Theoretical Population Biology 63: 231–243. [DOI] [PubMed] [Google Scholar]
- Funk VA. 2006. Floras: a model for biodiversity studies or a thing of the past? Taxon 55: 581–588. [Google Scholar]
- Garay LA, Sweet HR. 1974. Orchids of southern Ryukyu Islands. Cambridge, MA: Botanical Museum, Harvard University. [Google Scholar]
- Gigord LDB, Macnair MR, Smithson A. 2001. Negative frequency-dependent selection maintains a dramatic flower colour polymorphism in the rewardless orchid Dactylorhiza sambucina (L.) Soó. In: Proceedings of the National Academy of Sciences, USA 98: 6253–6255. [DOI] [PMC free article] [PubMed] [Google Scholar]
- Holsinger KE. 1999. Analysis of genetic diversity in geographically structured populations: a Bayesian perspective. Hereditas 130: 245–255. [Google Scholar]
- Holsinger KE, Lewis PO. 2007. Hickory: a package for analysis of population genetic data v1.1 http://darwin.eeb.uconn.edu/hickory/hickory.html (last accessed 20 June 2015).
- Holsinger KE, Wallace LE. 2004. Bayesian approaches for the analysis of population genetic structure: an example from Platanthera leucophaea. Molecular Ecology 13: 887–894. [DOI] [PubMed] [Google Scholar]
- Holsinger KE, Lewis PO, Dey DK. 2002. A Bayesian approach to inferring population structure from dominant markers. Molecular Ecology 11: 1157–1164. [DOI] [PubMed] [Google Scholar]
- Isaac NJB, Mallet J, Mace GM. 2004. Taxonomic inflation: its influence on macroecology and conservation. Trends in Ecology and Evolution 19: 464–469. [DOI] [PubMed] [Google Scholar]
- Jersáková J, Kindlmann P, Renner SS. 2006. Is the colour dimorphism in Dactylorhiza sambucina maintained by differential seed viability instead of frequency-dependent selection? Folia Geobotanica 41: 61–76. [Google Scholar]
- Legendre L, Legendre P. 1983. Numerical ecology. Amsterdam: Elsevier Scientific Publishing Co. [Google Scholar]
- Liu H. 2010. Geodorum eulophioides. Challenges for conserving one of the rarest Chinese orchids. Orchids 79: 161–162. [Google Scholar]
- Nilsson LA. 1980. The pollination ecology of Dactylorhiza sambucina (Orchidaceae). Botaniska Notiser 133: 367–385. [Google Scholar]
- Nilsson LA. 1985. Characteristics and distribution of intermediates between Platanthera bifolia and P. chlorantha (Orchidaceae) in the Nordic countries. Nordic Journal of Botany 5: 407–419. [Google Scholar]
- Pedersen HÆ. 2006. Systematics and evolution of the Dactylorhiza romana/sambucina polyploid complex (Orchidaceae). Botanical Journal of the Linnean Society 152: 405–434. [Google Scholar]
- Pedersen HÆ. 2013. Is it really worthwhile revising the same flora repeatedly? A case study in Thai Orchidaceae. Thai Forest Bulletin (Botany) 41: 145–156. [Google Scholar]
- Pedersen HÆ, Hedrén M. 2010. On the distinction of Dactylorhiza baltica and D. pardalina (Orchidaceae) and the systematic affinities of geographically intermediate populations. Nordic Journal of Botany 28: 1–12. [Google Scholar]
- Pedersen HÆ, Kurzweil H, Suddee S, Cribb PJ. 2011. Orchidaceae 1 (Cypripedioideae, Orchidoideae, Vanilloideae) In: Santisuk T, Larsen K, eds. Flora of Thailand 12(1). Bangkok: The Forest Herbarium, Department of National Parks, Wildlife and Plant Conservation, 1–302, Pls I–XXIV. [Google Scholar]
- Pedersen HÆ, Kurzweil H, Suddee S. et al. 2014. Orchidaceae 2 (Epidendroideae p.p. Neottieae, Tropidieae, Nervilieae, Gastrodieae, Thaieae, Calypsoeae, Arethuseae, Collabieae, Cymbidieae) In: Santisuk T, Balslev H, eds. Flora of Thailand 12(2). Bangkok: The Forest Herbarium, Department of National Parks, Wildlife and Plant Conservation, 303–670, Pls XXV–LVI. [Google Scholar]
- Pellegrino G, Bellusci F, Musacchio A. 2005a. Evidence of post-pollination barriers among three colour morphs of the deceptive orchid Dactylorhiza sambucina (L.) Soó. Sexual Plant Reproduction 18: 179–185. [Google Scholar]
- Pellegrino G, Caimi D, Noce ME, Musacchio A. 2005b. Effects of local density and flower colour polymorphism on pollination and reproduction in the rewardless orchid Dactylorhiza sambucina (L.) Soó. Plant Systematics and Evolution 251: 119–129. [Google Scholar]
- Pridgeon AM, Cribb PJ, Chase MW, Rasmussen FN, eds. 2009. Genera Orchidacearum 5. Epidendroideae (part two). Oxford: Oxford University Press. [Google Scholar]
- Reisch C, Bernhardt-Römermann M. 2014. The impact of study design and life history traits on genetic variation of plants determined with AFLPs. Plant Ecology 215: 1493–1511. [Google Scholar]
- Rohlf FJ. 1998. NTSYSpc. Numerical taxonomy and multivariate analysis system, version 2.0, user guide. New York: Exeter Software. [Google Scholar]
- Schuiteman A, de Vogel E. 2003. Taxonomy for conservation In: Dixon KW, Kell SP, Barrett RL, Cribb PJ, eds. Orchid conservation. Kota Kinabalu: Natural History Publications (Borneo; ), 55–68. [Google Scholar]
- Seidenfaden G. 1975–1980. Orchid genera in Thailand I–IX. Dansk Botanisk Arkiv 29(2): 1–50; 29(3): 1–80; 29(4): 1–94; 31(1): 1–105; 31(3): 1–149; 32(2): 1–195; 33(1): 1–94; 33(3): 1–228, 12 pls; 34(1): 1–104. [Google Scholar]
- Seidenfaden G. 1982–1988. Orchid genera in Thailand X–XIV. Opera Botanica 62: 1–157; 72: 1–124; 83: 1–295; 89:1–216; 95: 1–398. [Google Scholar]
- Seidenfaden G. 1984. Orchid genera in Thailand XI. Cymbidieae Pfitz. Opera Botanica 72: 1–124. [Google Scholar]
- Seidenfaden G, Smitinand T. 1959–1965. The orchids of Thailand: a preliminary list. Bangkok: The Siam Society. [Google Scholar]
- Shipunov AB, Fay MF, Pillon Y. et al. 2004. Dactylorhiza (Orchidaceae) in European Russia: combined molecular and morphological analysis. American Journal of Botany 91: 1419–1426. [DOI] [PubMed] [Google Scholar]
- Sneath PHA, Sokal RR. 1973. Numerical taxonomy. The principles and practice of numerical classification. San Francisco: W. H. Freeman. [Google Scholar]
- Song S, Dey DK, Holsinger KE. 2006. Differentiation among populations with migration, mutation and drift: implications for genetic inference. Evolution 60: 1–12. [PMC free article] [PubMed] [Google Scholar]
- Spiegelhalter DJ, Best NG, Carlin BP, van der Linde A. 2002. Bayesian measures of model complexity and fit. Journal of the Royal Statistical Society B: Statistical Methodology 64: 583–639. [Google Scholar]
- Tetsana N, Pedersen HÆ, Sridith K. 2014. Character intercorrelation and the potential role of phenotypic plasticity in orchids: a case study of the epiphyte Liparis resupinata. Plant Systematics and Evolution 300: 517–526. [Google Scholar]
- Vos P, Hogers R, Bleeker M, et al. 1995. AFLP: a new technique for DNA fingerprinting. Nucleic Acids Research 23: 4407–4414. [DOI] [PMC free article] [PubMed] [Google Scholar]
- Ying T, Geng QF, Wang DB, et al. 2014. Developing microsatellite markers for Geodorum eulophioides (Orchidaceae) and cross-species amplification in two sympatric, congeneric species. Conservation Genetics Resources 6: 957–959. [Google Scholar]