Abstract
♦ Background:
The quality of the peritoneal membrane can deteriorate over time. Exposure to glucose-based dialysis solutions is the most likely culprit. Because peritonitis is a common complication of peritoneal dialysis (PD), distinguishing between the effect of glucose exposure and a possible additive effect of peritonitis is difficult. The aim of the present study was to compare the time-course of peritoneal transport characteristics in patients without a single episode of peritonitis—representing the natural course—and in patients who experienced 1 or more episodes of peritonitis during long-term follow-up.
♦ Methods:
This prospective, single-center cohort study enrolled incident adult PD patients who started PD during 1990–2010. A standard peritoneal permeability analysis was performed in the first year of PD treatment and was repeated every year. The results in patients without a single episode of peritonitis (“no-peritonitis group”) were compared with the results obtained in patients who experienced 1 or more peritonitis episodes (“peritonitis group”) during a follow-up of 4 years.
♦ Results:
The 124 patients analyzed included 54 in the no-peritonitis group and 70 in the peritonitis group. The time-course of small-solute transport was different in the groups, with the peritonitis group showing an earlier and more pronounced increase in the mass transfer area coefficient for creatinine (p = 0.07) and in glucose absorption (p = 0.048). In the no-peritonitis group, the net ultrafiltration rate (NUFR) and the transcapillary ultrafiltration rate (TCUFR) both showed a steep increase from the 1st to the 2nd year of PD that was absent in the peritonitis group. Both groups showed a decrease in the NUFR after year 3. A decrease in the TCUFR occurred only in the peritonitis group. That decrease was already present after the year 1 in patients with severe peritonitis. The time-course of free water transport showed a continuous increase in the patients without peritonitis, but a decrease in the patients who experienced peritonitis (p < 0.01). No difference was observed in the time-course of the effective lymphatic absorption rate. The time-courses of immunoglobulin G and α2-macroglobulin clearances showed a decrease in both patient groups, with a concomitant increase of the restriction coefficient. Those changes were not evidently influenced by peritonitis. The two groups showed a similar decrease in the mesothelial cell mass marker cancer antigen 125 during follow-up.
♦ Conclusions:
On top of the natural course of peritoneal function, peritonitis episodes to some extent influence the time-course of small-solute and fluid transport—especially the transport of solute-free water. Those modifications increase the risk for overhydration.
Keywords: Peritonitis, peritoneal transport, standard peritoneal permeability analysis
In peritoneal dialysis (PD), the peritoneum is used as a dialysis membrane. Membrane quality can gradually deteriorate with time on PD because of neoangiogenesis, vasculopathy, and peritoneal fibrosis (1,2). A decrease in the efficacy of PD in terms of excess fluid removal is the main functional abnormality. Chronic exposure to dialysis solutions with extremely high glucose concentrations is the most likely culprit in the pathogenesis of the foregoing alterations (3). In addition, peritonitis has been hypothesized to contribute to those changes (4).
Several studies have shown that acute peritonitis leads to increased solute transport and protein loss, the former leading to ultrafiltration (UF) failure (5,6). However, peritoneal transport parameters return to normal values within 2 weeks after cure of the infection, in parallel with levels of the locally produced vasoactive substances that cause the changes (7). Controversy exists about the permanent effects of peritonitis on peritoneal transport. Some studies reported a negative effect of peritonitis on the time-course of peritoneal function (8); others found an effect only for early peritonitis (9) or severe peritonitis (4) or were unable to demonstrate an influence (10).
Recently, we conducted two studies to analyze the effect of peritonitis on transport. In the first study, we found that, in patients who experienced a first peritonitis episode, membrane transport remained faster at 1 year after that complication than it did in patients without a peritonitis episode (11). The second study compared the change in peritoneal transport from baseline to the 3rd year of PD in patients without peritonitis and in those with frequent peritonitis episodes (12). Compared with the no-peritonitis group, the frequent peritonitis group showed a time trend of increasing small-solute transport, with a concomitant decline in transcapillary UF.
Our finding that peritonitis—as both a single episode and frequent episodes—leads to a time-course for some transport parameters that differs from the natural course was reason to undertake the present study. We investigated how all peritonitis episodes affected the time-course of peritoneal transport compared with the natural time-course in the absence of any peritonitis episode.
Methods
Design
This prospective single-center cohort study enrolled incident adult PD patients who started PD during 1990–2010. Data collection included baseline demographics and data on peritonitis episodes and on peritoneal function. Peritoneal function was assessed using the standard peritoneal permeability analysis (SPA). The SPAs were performed in the 1st year of PD treatment and were repeated every year.
Patients
For the present analysis, patients had to have data from at least 2, and a maximum of 4, SPAs with a 3.86% glucose solution. The first SPA had to be done within the 1st year of PD treatment. Patients were divided in a group who had never experienced peritonitis (representing the natural course) and a group who had experienced 1 or more peritonitis episodes between the first and last available SPAs. When peritonitis preceded the baseline SPA, or when a SPA was performed within the acute phase (30 days after peritonitis), the data were excluded from the analyses. Baseline for patient characteristics was the start of PD. The Davies comorbidity score (13) was used to classify comorbidity for each patient. Patients were treated with Dianeal PD solution (Baxter Healthcare BV, Utrecht, Netherlands) between 1990 and 1997, with Dianeal or Physioneal (Baxter Healthcare BV) between 1998 and 2004, and with Physioneal between 2005 and 2010. The use of icodextrin started in 1997.
Peritonitis
Peritonitis was diagnosed using the criteria developed by Vas (14), in which at least 2 of 3 findings must be present: clinical symptoms, effluent cell count exceeding 100 cells/μL, and a positive effluent culture. Since 1985, all peritonitis episodes have been treated according to the same published protocol (15). Peritonitis is treated empirically with a first-generation cephalosporin, which is combined with gentamicin when the patient is clinically ill and needs hospitalization. Thereafter, antibiotic treatment can be adjusted according to the resistance of the causative organism. Treatment continues until 1 week after cultures become negative and cell counts reach fewer than 100 cells/μL.
SPAs
The SPAs were performed during 4-hour dwells with a 3.86% glucose solution, as previously described (16). Measurements included the mass transfer area coefficient (MTAC) of creatinine, percentage glucose absorption, and peritoneal clearances of a variety of serum proteins: β2-microglobulin [B2m (radius: 16 Å)], albumin (36 Å), immunoglobulin G [IgG (54 Å)], and α2-macroglobulin [A2m (89 Å)]. The restriction coefficient to macromolecules, which represents the size-selectivity of the peritoneal membrane—that is, the average large-pore radius—was calculated from those clearances (17). The parameters of fluid transport measured were these: net UF, transcapillary UF, effective lymphatic absorption, and free water transport. All calculations were performed as previously described by Pannekeet et al. (18) and Smit et al. (19). The concentration of the biomarker cancer antigen 125 (CA125) was measured in the drained effluent after 4 hours. The CA125 glycoprotein, which can be considered a marker of mesothelial cell mass or turnover (20), was measured from 1997 onward. Effluent CA125 is expressed as its dialysate appearance rate: that is, the total amount present in the effluent divided by the duration of the dwell.
Statistical Analyses
Results are expressed as means with standard deviations or as medians with interquartile range. An independent Student t-test or Mann–Whitney test (continuous data) or a chi-square test (categorical data) was used to assess differences in baseline characteristics between the no-peritonitis and peritonitis groups. A linear mixed model was used to analyze possible differences between the groups in the time-courses of repeatedly measured transport parameters. Adjustments were made for age and diabetes. Kaplan–Meier curves of the combined patient and technique survival for all eligible patients in the no-peritonitis and peritonitis groups were plotted. A log-rank test was used to examine possible differences. All statistical analyses were performed using IBM SPSS Statistics (version 19.0: IBM, Armonk, NY, USA). Statistical significance was accepted at p values less than 0.05.
Sensitivity Analyses
Adjusted linear mixed models were used to investigate whether the period of PD start, the number of peritonitis episodes, or the timing or severity of peritonitis modified the effect of peritonitis on peritoneal transport. Stratification by PD start divided the patient cohort into the periods 1990–1999 and 2000–2010. A group experiencing 1 or 2 peritonitis episodes was compared with a group experiencing 3 or more peritonitis episodes. Early peritonitis was defined as occurring less than 2 years after the start of PD, and that group of patients was compared with a reference group experiencing late peritonitis, defined as occurring more than 2 years after PD start. Severe peritonitis was specified as 1 or more peritonitis episodes with a leukocyte count exceeding 1090 cells/mm3 on day 3 or 100 cells/mm3 on day 5 of the peritonitis episode, and that patient group was compared with a reference group experiencing mild peritonitis. Residual renal function at the start of PD might be a confounder of the association. Because residual glomerular filtration rate was available only for a limited number of patients, residual renal function according to serum B2m was used and added to the model in a sensitivity analysis to examine its effect on the association.
Results
Patients
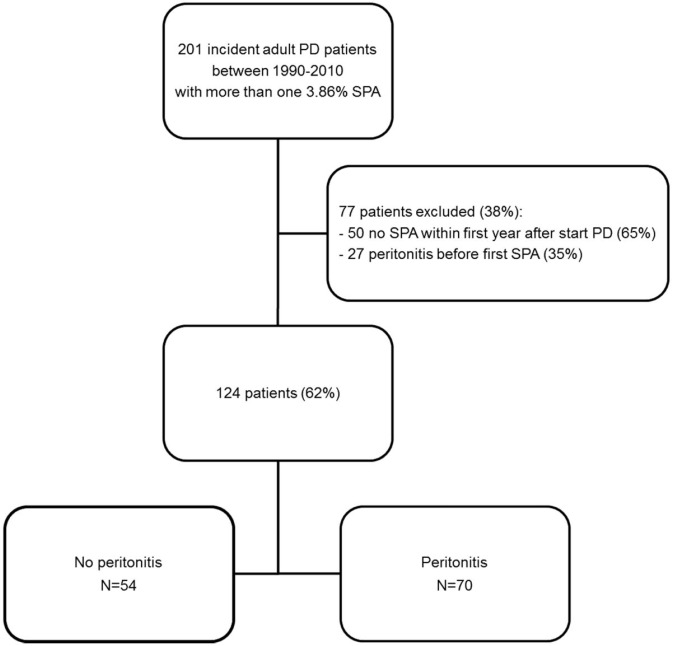
Figure 1 shows a flow diagram of patient selection. The analyses include 124 patients, of whom 54 remained peritonitis-free during follow-up. The other 70 patients experienced 1 or more episodes of peritonitis. No differences in the combined patient and technique survival were found for all 201 originally eligible patients or for the no-peritonitis and peritonitis groups (Supplemental Figure 1).
Figure 1 —
Flow chart for patient selection. PD = peritoneal dialysis; SPA = standard peritoneal permeability analysis.
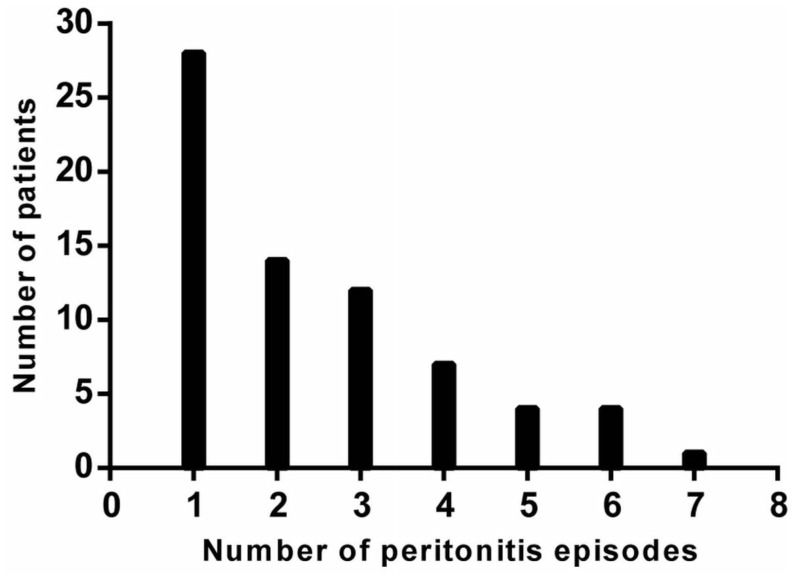
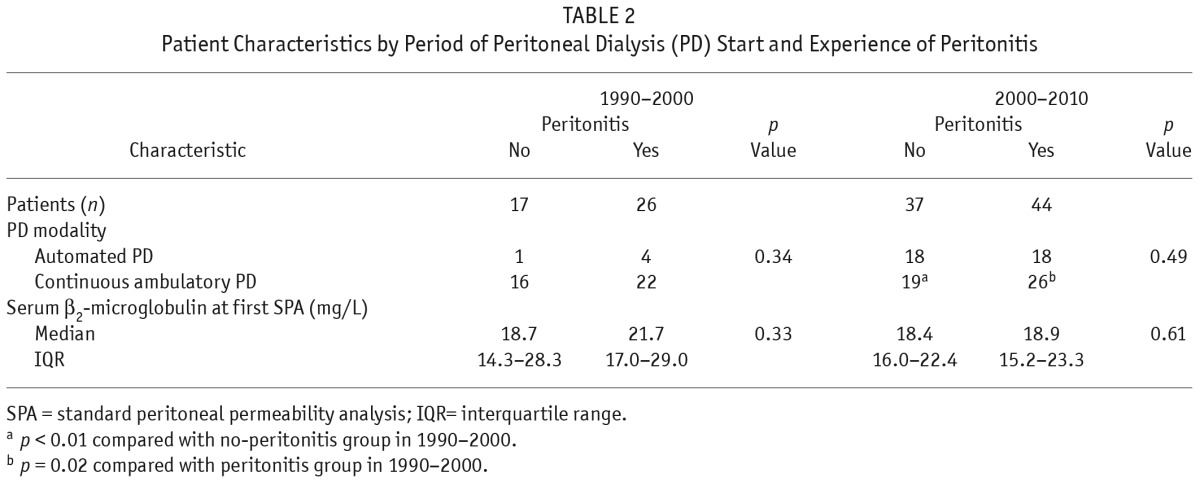
Figure 2 shows the distribution of peritonitis episodes in the cohort. Table 1 shows baseline patient characteristics by study group. Parameters in both groups were similar, except for the intervals between PD start and last SPA, and between the first and the last SPA. Both were intervals were longer in the peritonitis group. Table 2 shows the effect of era of inclusion on patient characteristics. In each era, the no-peritonitis and peritonitis groups showed no differences. However, in the most recent era, more patients in both groups were on automated PD.
Figure 2 —
Distribution of peritonitis episodes in the study cohort.
TABLE 1.
Baseline Characteristics of the Patients
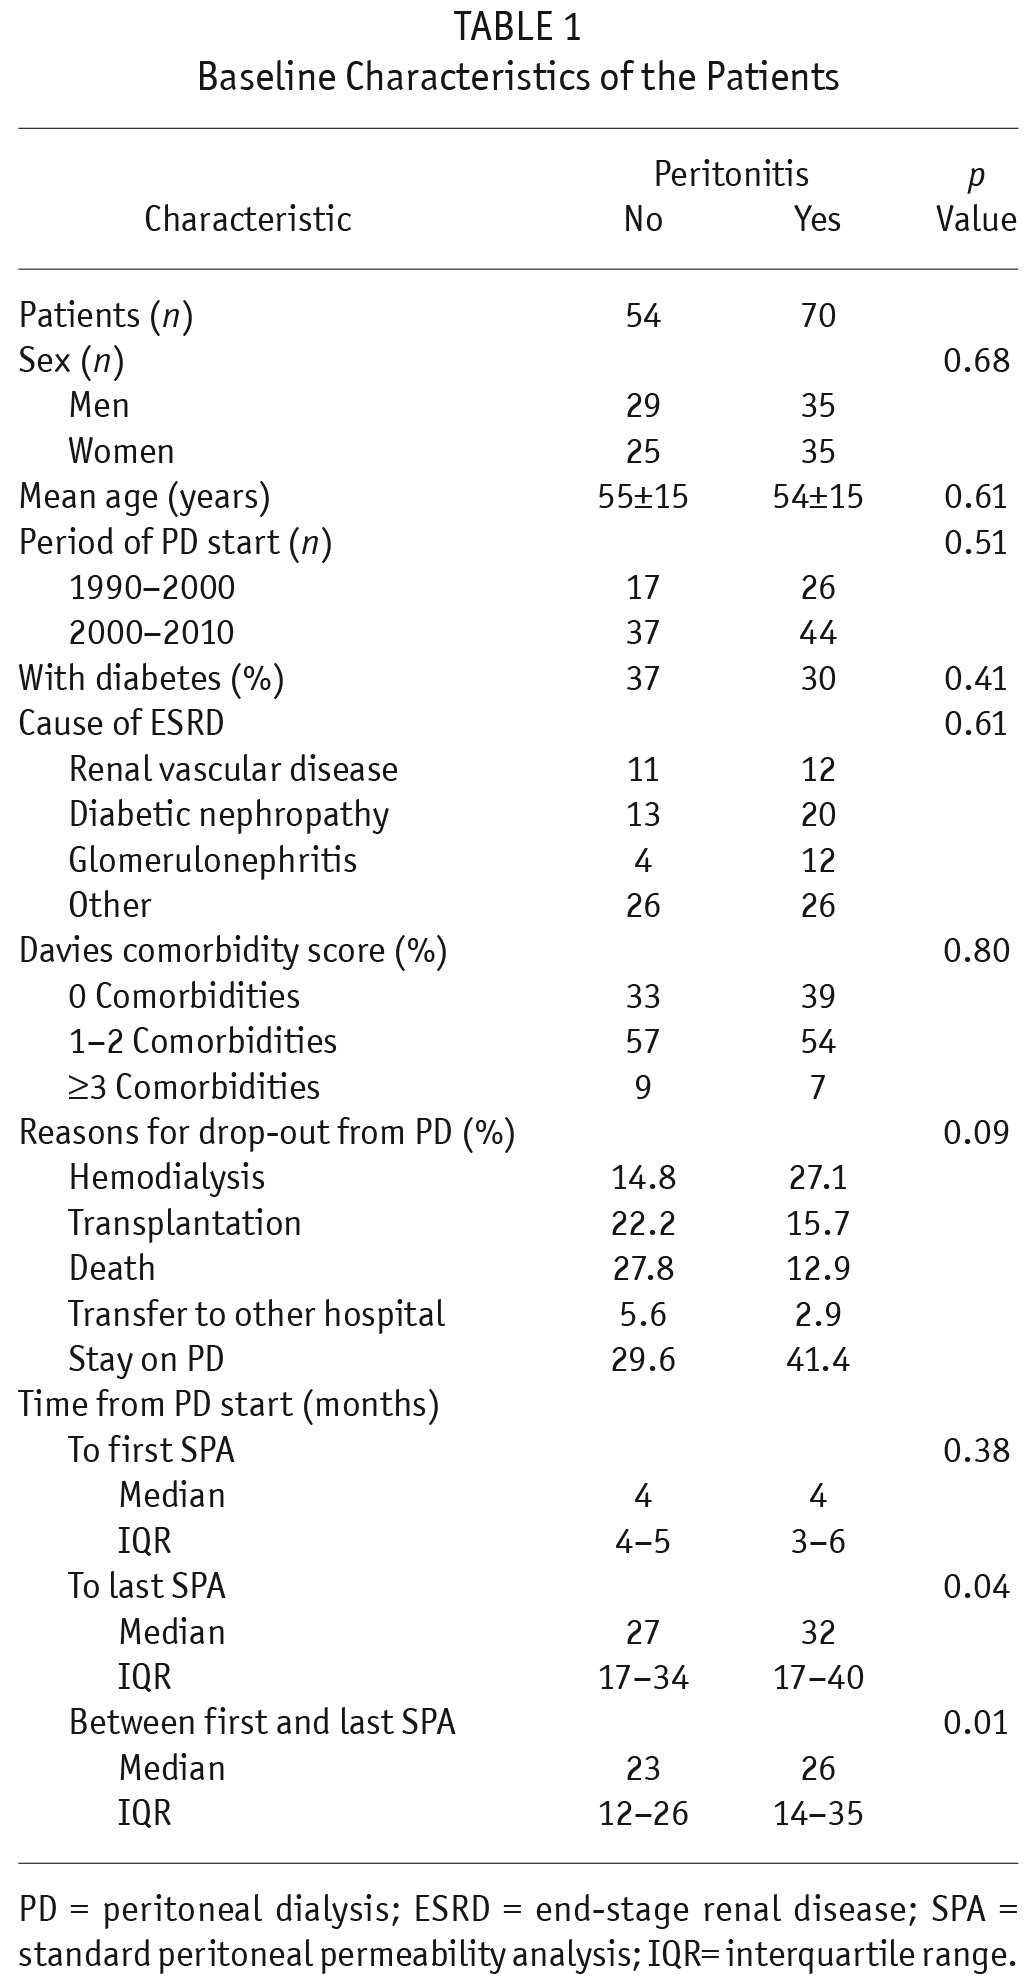
TABLE 2.
Patient Characteristics by Period of Peritoneal Dialysis (PD) Start and Experience of Peritonitis
Small-Solute Transport
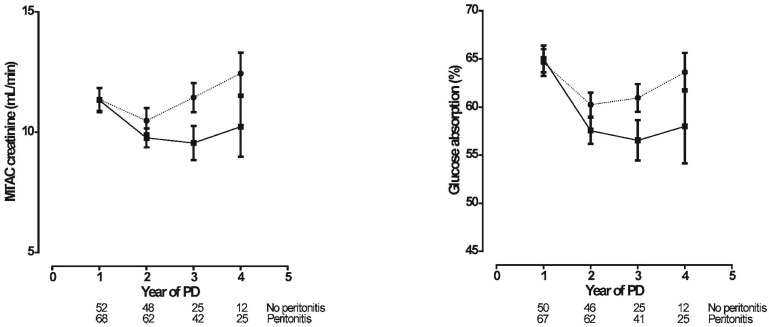
Figure 3 shows the time-courses of MTAC creatinine and glucose absorption in the two patient groups. The time-courses for small-solute transport showed a decline from the 1st to the 2nd year in both groups. Thereafter, MTAC creatinine and glucose absorption both increased in the peritonitis group. A similar increase began in the no-peritonitis group only after 3 years. As a consequence, the time-courses of MTAC creatinine (p = 0.07) and glucose absorption (p = 0.048) were different for the two groups.
Figure 3 —
Linear mixed-model estimations (mean ± standard error of the mean) of the time-course of small-solute transport [left panel: mass transfer area coefficient (MTAC) of creatinine; right panel: glucose absorption] in the no-peritonitis (filled squares, solid line) and peritonitis (filled circles, dotted line) groups. The number of patients at risk at each time point is given below the horizontal axis. The time-courses were different in the peritonitis group compared with the no-peritonitis group: MTAC creatinine, p = 0.07; glucose absorption, p = 0.048. PD = peritoneal dialysis.
Fluid Transport and Lymphatic Absorption
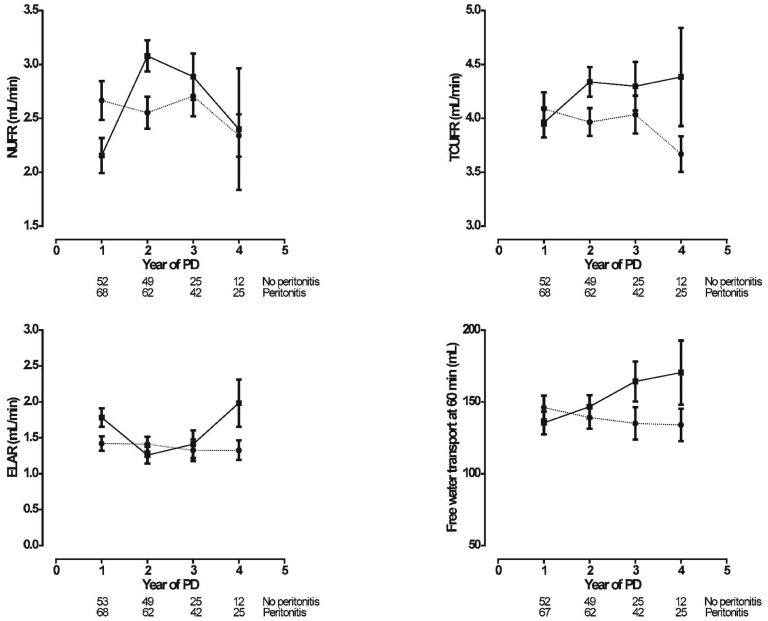
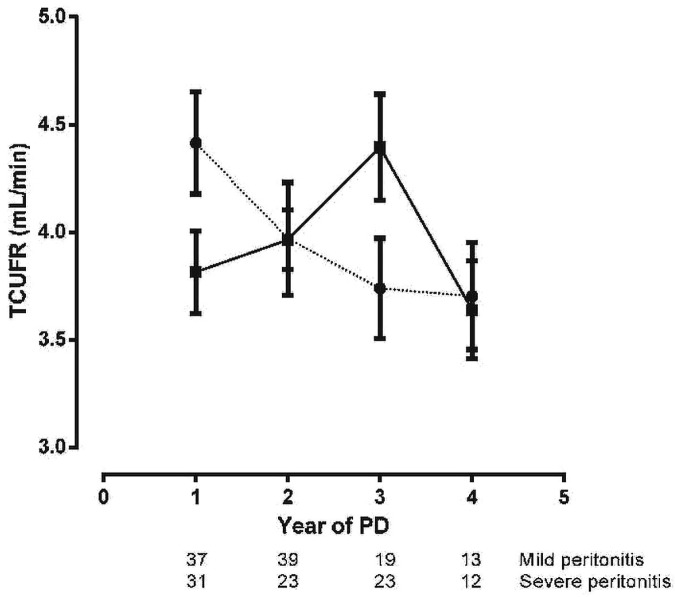
Figure 4 shows the net UF rate (NUFR), the transcapillary UF rate (TCUFR), free water transport at 60 minutes (FWT), and the effective lymphatic absorption rate (ELAR). In the no-peritonitis group, NUFR increased steeply from the 1st to the 2nd year of PD; such an increase was absent in the patients who experienced peritonitis. After the 3rd year of PD, a decrease in NUFR was evident in both groups. The time-course of TCUFR showed a similar increase from the 1st to the 2nd year of PD in the no-peritonitis group; thereafter, it remained stable. In contrast, TCUFR remained stable in the peritonitis group, but declined after the 3rd year of PD therapy. In patients with severe peritonitis, a decline was already present after the 1st year of PD, making the time course of TCUFR significantly different in severe and mild peritonitis (Figure 5). The time-course of FWT showed a continuous increase in the no-peritonitis group and a decline in the patients who experienced peritonitis. The time-course of ELAR remained unaltered in the peritonitis group; in the no-peritonitis group, it showed some decline from the 1st to the 2nd year of PD and then an increase after the 3rd year of PD. The time-courses in the no-peritonitis and peritonitis groups for NUFR, TCUFR, and FWT were significantly different. No difference was found for the time-course of ELAR.
Figure 4 —
Linear mixed-model estimations (mean ± standard error of the mean) of the time-course of fluid transport [upper left panel: net ultrafiltration rate (NUFR); upper right panel: transcapillary ultrafiltration rate (TCUFR); lower left panel: effective lymphatic absorption rate (ELAR); lower right panel: free water transport at 60 minutes (FWT60)] in the no-peritonitis (filled squares, solid line) and peritonitis (filled circles, dotted line) groups. The number of patients at risk at each time point is given below the horizontal axis. The time-courses for NUFR, TCUFR, and FWT60 were significantly different in the peritonitis group compared with the no-peritonitis group (p = 0.01, p = 0.03, and p < 0.01 respectively). The time-course for the ELAR was not different between the groups (p = 0.71). PD = peritoneal dialysis.
Figure 5 —
Linear mixed-model estimations (mean ± standard error of the mean) of the time-course of the transcapillary ultrafiltration rate (TCUFR) in the severe (filled circles, dotted line) and mild (filled squares, solid line) peritonitis groups. The number of patients at risk at each time point is given below the horizontal axis. The time-course was significantly different for the severe peritonitis group compared with the mild peritonitis group (adjusted slope difference: 0.37; 95% confidence interval: 0.01 to 0.72; p = 0.04). PD = peritoneal dialysis.
Large-Solute Transport
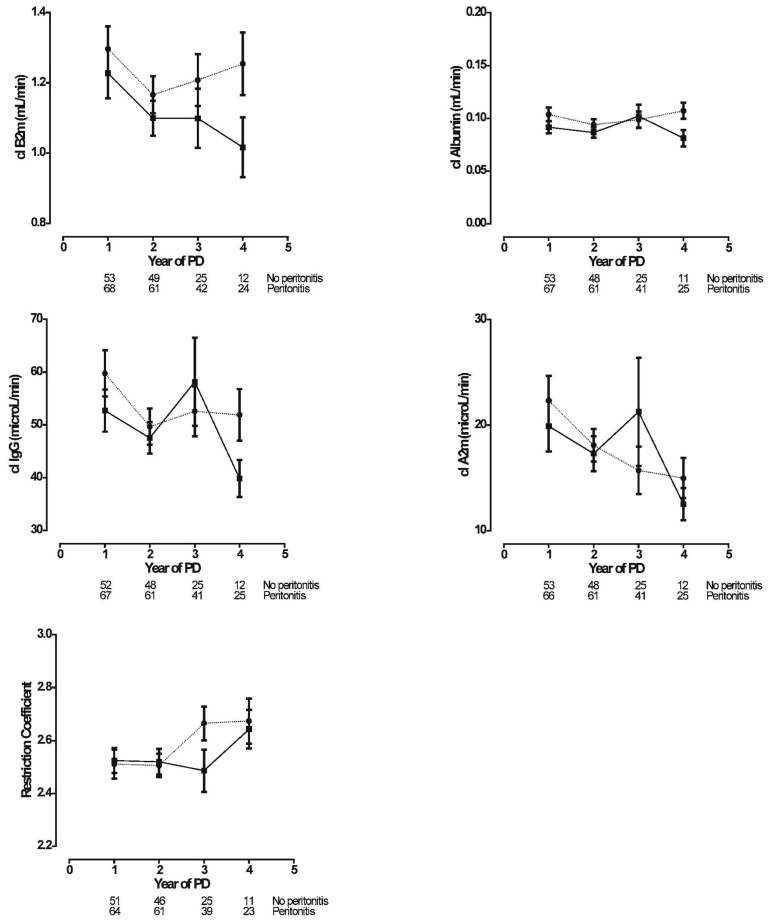
Figure 6 shows the time-courses of large-solute clearances (serum B2m, albumin, IgG, and A2m) and of the restriction coefficient. As expected, the time-course of B2m followed the time-course of MTAC creatinine during the early years. In contrast, clearances of IgG and A2m declined in both patient groups. Peritoneal clearances of albumin were stable during follow-up. None of the investigated protein clearances showed a difference in time-course between the no-peritonitis and peritonitis groups. In the peritonitis group, the restriction coefficient to macromolecules increased after 2 years; in the no-peritonitis group, the increase started after 3 years. That difference was borderline significant (p = 0.06).
Figure 6 —
Linear mixed-model estimations (mean ± standard error of the mean) of the time-courses for large solutes [upper left panel: β2-microglobulin (B2m); upper right panel: albumin; middle left panel: immunoglobulin G (IgG); middle right panel: α2-macroglobulin (A2m); lower panel: restriction coefficient] in the no-peritonitis (filled squares, solid line) and peritonitis (filled circles, dotted line) groups. The number of patients at risk at each time point is given below the horizontal axis. Clearances of B2m, Albumin, IgG, and A2m were not different between the groups (p = 0.45, p = 0.74, p = 0.42, and p = 0.19 respectively). The time-course of the restriction coefficient was borderline significant at p = 0.06. PD = peritoneal dialysis.
Time-Course of CA125
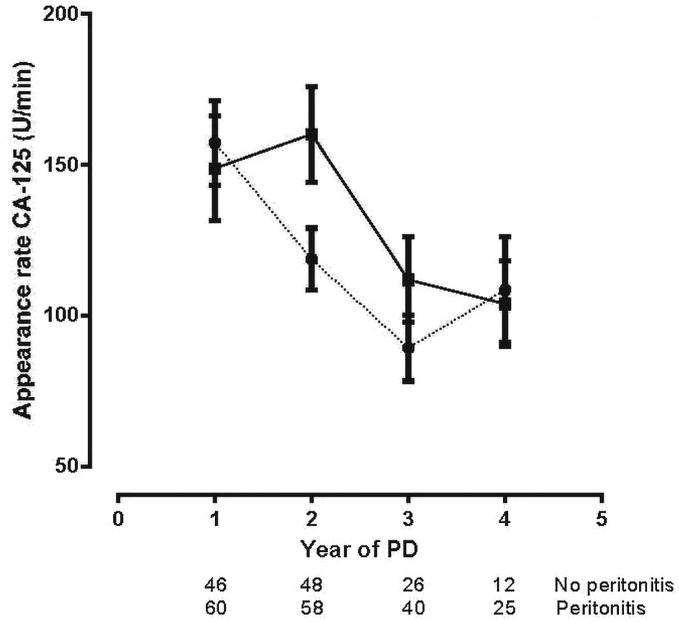
Figure 7 shows the effluent appearance rates of the mesothelial cell mass marker CA125 in the two groups. The decrease in the two groups was similar during follow-up.
Figure 7 —
Linear mixed-model estimations (mean ± standard error of the mean) of the time-course for the appearance rate of cancer antigen 125 (CA-125) in the no-peritonitis (filled squares, solid line) and peritonitis (filled circles, dotted line) groups. The number of patients at risk at each time point is given below the horizontal axis. No differences between the groups were observed (p = 0.71). PD = peritoneal dialysis.
Sensitivity Analyses
With the exception of TCUFR (as earlier described), sensitivity analyses showed no effect of the era of PD start (Supplemental Table 1) nor of the number or timing of peritonitis episodes on the time-courses of peritoneal fluid and solute transport (data not shown).
Discussion
The long-term integrity of the peritoneum as a dialysis membrane is threatened by continuous exposure to glucose-containing dialysis solutions. The present observational cohort study shows that, on top of the exposure effects, peritonitis episodes influence to some extent the time-course of small-solute, protein, and free water transport. Two possibilities can be distinguished: either the alterations start earlier than they do during the natural course without peritonitis, or the time-courses are completely different.
A number of studies have shown that the time-course of small-solute transpor t has a U-shaped profile (21,22). In general, the highest values are found during the early months, followed by a gradual decline. The lowest values are usually reached after 2 or 3 years of PD (23,24). The present study shows that the subsequent rise starts earlier in a peritonitis group compared with patients who experienced no peritonitis episodes. As expected, the natural time-course of net UF in the latter group mirrored that of glucose absorption during the first 3 years, but the subsequent decrease was more pronounced than the change in small-solute transport might suggest, suggesting an additional cause. A decline of this kind for transcapillary UF was not found. It is speculative whether the increase in effective lymphatic absorption that was found between years 3 and 4 in the no-peritonitis group contributed to the observed decline in net UF. In a cross-sectional analysis (25), we previously found relationships between the ELAR and parameters of small-solute transport, and we postulated that those relationships might have been caused by an increased number of interstitial lymphatics accompanying peritoneal blood vessels. That hypothesis is supported by a study from Japan in which an increase in the number of lymphatic vessels was found in patients with impaired UF (26). These effects of PD duration on net UF, transcapillary UF, and effective lymphatic absorption in patients experiencing no peritonitis episodes were absent in the patients who experienced peritonitis, except for a decline in net and transcapillary UF after 3 years, which is possibly caused by a decrease in osmotic conductance and points to structural alterations in peritoneal tissue.
The strongest observation was the difference in the time-course of FWT. The no-peritonitis group showed an almost linear increase in FWT with time on PD; the peritonitis group showed a slight decline during follow-up. Peritoneal FWT occurs through the endothelial water channel aquaporin-1 (AQP1), as recently reviewed (27). We hypothesize that the increase of FWT in the no-peritonitis group is a result of stimulated expression of AQP1 in the peritoneal membrane, possibly by chronic exposure to dialysis solutions with a low-molecular-weight osmotic agent—such as glucose—that causes hypertonicity.
Peritoneal AQP1 probably has no function in healthy individuals. During PD, a crystalloid osmotic gradient is created in the peritoneal cavity. That gradient requires the presence of functioning water channels to induce adequate UF (28), which might be a trigger for upregulation of AQP1 expression. That hypothesis is supported by two experimental studies. Umenishi and Schrier (29) demonstrated that AQP1 protein expression was increased in cultured mouse medullary cells in the presence of a hypertonic gradient. Lai et al. (30) showed a significant enhancement of AQP1 biosynthesis upon exposure to glucose in a time- and dose-dependent manner in human peritoneal mesothelial and endothelial cells. The decreasing time-course of FWT in our peritonitis group followed the pattern of the other fluid transport parameters in those patients. The data on FWT are especially interesting in view of the FWT time-course in patients who develop encapsulating peritoneal sclerosis. Severely impaired FWT was found to be the best predictor of that complication (31). The present findings make it likely that peritonitis contributes to the development of encapsulating peritoneal sclerosis.
Peritoneal transport of serum proteins occurs mainly through the small or the large interendothelial pores (depending on protein size). The small pores, which can have a radius of 47 Å, easily allow passage of B2m. The radius of albumin suggests restricted passage through the small pores, but also passage through the large-pore system. The radii for IgG and A2m are so large that they can be transported only through the large-pore system. The magnitude of peritoneal protein clearances depends not only on pore size, but also on the number of pores available. As expected from the foregoing considerations, clearance of B2m mimicked that of MTAC creatinine, except that no long-term increase was observed in the no-peritonitis group. Albumin clearance remained constant during follow-up and showed no differences in the two patient groups. The peritonitis-independent decline in IgG and A2m clearances in long-term PD patients, with an accompanying increase in the restriction coefficient, points to the development of decreased intrinsic membrane permeability to the transport of macromolecules. We published similar findings obtained in another population (32). A reduction of the average large-pore radius or a size-dependent interstitial barrier are both possible.
The effluent appearance rate of CA125 declined with the duration of PD, regardless of peritonitis episodes. That observation suggests a reduction of mesothelial cell mass, making the peritoneum more vulnerable to noxious agents. That hypothesis accords with the results of previous longitudinal studies by our group in patients exposed to conventional dialysis solutions (33) and, more recently, also in those exposed to “biocompatible” solutions only (34). Our group previously showed that effluent CA125 is only moderately increased during the first few days of acute peritonitis and rapidly returns to normal values during cure of the infection (35).
No effect of the number or timing of peritonitis episodes on the time-course of peritoneal transport was found. Only severe peritonitis was associated with a decreased TCUFR; mild peritonitis did not show the same association. Those observations accord with the findings of others (4,36,37). In a recent study, we found no evidence for an effect of peritonitis severity on transport (12), possibly because of the smaller number of patients in that study.
Shortcomings of the present investigation include its relatively small patient cohort and its status as a single-center study. Also, we cannot with certainty exclude the possibility that the switch from conventional dialysis solutions to “biocompatible” ones might have influenced the results to some extent. Although the small number of patients in the various subgroups prevented an analysis of the possible effects of those changes, the groups were, at baseline, not different for the era of PD start, and the sensitivity analyses showed no effect of the era of PD start on the time-course of peritoneal fluid and solute transport. Most studies on possible differences in peritoneal transport between conventional and “biocompatible” dialysis solutions reported no effect, but are hampered by short observation periods, as reviewed by Perl et al. (38). Only the recently published randomized controlled trial by Johnson et al. (39), with 2 years of follow-up, found differences in the time-courses of some transport parameters; however, the authors reported the parameter values only as linear trends and did not take peritonitis into account. The observed differences between the groups in time from PD start to the last SPA measurement was inevitable, because the presence of acute peritonitis leads to a mandatory postponement of the SPA.
The strengths of our study are the highly standardized way in which the analyses are performed and the inclusion of all transport parameters that can be measured in PD patients. Those parameters include not only small-solute transport and net UF, but also FWT, effective lymphatic absorption, and the transport of several proteins (enabling an assessment of the time-course of the peritoneal restriction barrier to macromolecules). To the best of our knowledge, the present study is the first to describe both the natural time-course of peritoneal function under long-term exposure to glucose-based dialysis solutions and the modifications caused by peritonitis.
Conclusions
The present study shows that the natural time-course of peritoneal function in PD patients chronically exposed to dialysis solutions is characterized by a U-shaped small-solute transport profile, with the minimum value occurring after 3 years, followed by a rise. The profile of net UF represents a mirror image, and effective lymphatic absorption closely follows the profile of small-solute transport. During follow-up, FWT shows a continuous rise. Peritoneal clearances of proteins that are transported through the large-pore system decline during long-term follow-up, in association with a decrease in the intrinsic permeability of the peritoneal membrane to macromolecules. Effluent CA125 declines during follow-up. Peritonitis has no effect on the time-course of protein transport and CA125, but it modifies the U-shaped profile of small-solute transport, lowers UF, and inhibits the rise of FWT. Peritonitis therefore modifies peritoneal transport in a way that increases the risk of overhydration.
Disclosures
The authors have no financial conflicts of interest to declare.
Supplementary Material
Acknowledgments
The authors acknowledge the excellent technical assistance of Guido Bergmans.
Footnotes
Supplemental material available at www.pdiconnect.com
REFERENCES
- 1. Williams JD, Craig KJ, Topley N, Von Ruhland C, Fallon M, Newman GR, et al. Morphologic changes in the peritoneal membrane of patients with renal disease. J Am Soc Nephrol 2002; 13:470–9. [DOI] [PubMed] [Google Scholar]
- 2. Mateijsen MA, van der Wal AC, Hendriks PM, Zweers MM, Mulder J, Struijk DG, et al. Vascular and interstitial changes in the peritoneum of CAPD patients with peritoneal sclerosis. Perit Dial Int 1999; 19:517–25. [PubMed] [Google Scholar]
- 3. Davies SJ, Mushahar L, Yu Z, Lambie M. Determinants of peritoneal membrane function over time. Semin Nephrol 2011; 31:172–82. [DOI] [PubMed] [Google Scholar]
- 4. Davies SJ, Bryan J, Phillips L, Russell GI. Longitudinal changes in peritoneal kinetics: the effects of peritoneal dialysis and peritonitis. Nephrol Dial Transplant 1996; 11:498–506. [PubMed] [Google Scholar]
- 5. Krediet RT, Zuyderhoudt FM, Boeschoten EW, Arisz L. Alterations in the peritoneal transport of water and solutes during peritonitis in continuous ambulatory peritoneal dialysis patients. Eur J Clin Invest 1987; 17:43–52. [DOI] [PubMed] [Google Scholar]
- 6. Douma CE, de Waart DR, Struijk DG, Krediet RT. Are phospholipase A2 and nitric oxide involved in the alterations in peritoneal transport during CAPD peritonitis? J Lab Clin Med 1998; 132:329–40. [DOI] [PubMed] [Google Scholar]
- 7. Zemel D, Koomen GC, Hart AA, ten Berge IJ, Struijk DG, Krediet RT. Relationship of TNF-alpha, interleukin-6, and prostaglandins to peritoneal permeability for macromolecules during longitudinal follow-up of peritonitis in continuous ambulatory peritoneal dialysis. J Lab Clin Med 1993; 122:686–96. [PubMed] [Google Scholar]
- 8. Yu Z, Lambie M, Davies SJ. Longitudinal study of small solute transport and peritoneal protein clearance in peritoneal dialysis patients. Clin J Am Soc Nephrol 2014; 9:326–34. [DOI] [PMC free article] [PubMed] [Google Scholar]
- 9. Fernández-Reyes MJ, Bajo MA, Del Peso G, Ossorio M, Díaz R, Carretero B, et al. The influence of initial peritoneal transport characteristics, inflammation, and high glucose exposure on prognosis for peritoneal membrane function. Perit Dial Int 2012; 32:636–44. [DOI] [PMC free article] [PubMed] [Google Scholar]
- 10. Fusshöller A, zur Nieden S, Grabensee B, Plum J. Peritoneal fluid and solute transport: influence of treatment time, peritoneal dialysis modality, and peritonitis incidence. J Am Soc Nephrol 2002; 13:1055–60. [DOI] [PubMed] [Google Scholar]
- 11. van Diepen AT, van Esch S, Struijk DG, Krediet RT. The first peritonitis episode alters the natural course of peritoneal membrane characteristics in peritoneal dialysis patients. Perit Dial Int 2015; 35:324–32. [DOI] [PMC free article] [PubMed] [Google Scholar]
- 12. van Esch S, van Diepen ATN, Struijk DG, Krediet RT. The mutual relationship between peritonitis and peritoneal transport. Perit Dial Int 2016; 36:33–42. [DOI] [PMC free article] [PubMed] [Google Scholar]
- 13. Davies SJ, Russell L, Bryan J, Phillips L, Russell GI. Comorbidity, urea kinetics, and appetite in continuous ambulatory peritoneal dialysis patients: their interrelationship and prediction of survival. Am J Kidney Dis 1995; 26:353–61. [DOI] [PubMed] [Google Scholar]
- 14. Vas S, Low D, Layne S, Khanna R, Dombros N. Microbiological diagnostic approach to peritonitis in CAPD patients. In: Atkins RC, Thomson NM, Farrell PC, eds. Peritoneal Dialysis. Edinburgh, UK: Churchill Livingstone; 1981: 264–71. [Google Scholar]
- 15. Boeschoten EW, Rietra PJ, Krediet RT, Visser MJ, Arisz L. CAPD peritonitis: a prospective randomized trial of oral versus intraperitoneal treatment with cephradine. J Antimicrob Chemother 1985; 16:789–97. [DOI] [PubMed] [Google Scholar]
- 16. Smit W, van Dijk P, Langedijk MJ, Schouten N, van den Berg N, Struijk DG, et al. Peritoneal function and assessment of reference values using a 3.86% glucose solution. Perit Dial Int 2003; 23:440–9. [PubMed] [Google Scholar]
- 17. Imholz AL, Koomen GC, Struijk DG, Arisz L, Krediet RT. Effect of dialysate osmolarity on the transport of low-molecular weight solutes and proteins during CAPD. Kidney Int 1993; 43:1339–46. [DOI] [PubMed] [Google Scholar]
- 18. Pannekeet MM, Imholz AL, Struijk DG, Koomen GC, Langedijk MJ, Schouten N, et al. The standard peritoneal permeability analysis: a tool for the assessment of peritoneal permeability characteristics in CAPD patients. Kidney Int 1995; 48:866–75. [DOI] [PubMed] [Google Scholar]
- 19. Smit W, Struijk DG, Ho-Dac-Pannekeet MM, Krediet RT. Quantification of free water transport in peritoneal dialysis. Kidney Int 2004; 66:849–54. [DOI] [PubMed] [Google Scholar]
- 20. Krediet RT. Dialysate cancer antigen 125 concentration as marker of peritoneal membrane status in patients treated with chronic peritoneal dialysis. Perit Dial Int 2001; 21:560–7. [PubMed] [Google Scholar]
- 21. Struijk DG, Krediet RT, Koomen GC, Boeschoten EW, Hoek FJ, Arisz L. A prospective study of peritoneal transport in CAPD patients. Kidney Int 1994; 45:1739–44. [DOI] [PubMed] [Google Scholar]
- 22. del Peso G, Fernández-Reyes MJ, Hevia C, Bajo MA, Castro MJ, Cirugeda A, et al. Factors influencing peritoneal transport parameters during the first year on peritoneal dialysis: peritonitis is the main factor. Nephrol Dial Transplant 2005; 20:1201–6. [DOI] [PubMed] [Google Scholar]
- 23. Kolesnyk I, Dekker FW, Noordzij M, le Cessie S, Struijk DG, Krediet RT. Impact of ACE inhibitors and AII receptor blockers on peritoneal membrane transport characteristics in long-term peritoneal dialysis patients. Perit Dial Int 2007; 27:446–53. [PubMed] [Google Scholar]
- 24. Coester AM, Smit W, Struijk DG, Parikova A, Krediet RT. Longitudinal analysis of peritoneal fluid transport and its determinants in a cohort of incident peritoneal dialysis patients. Perit Dial Int 2014; 34:195–203. [DOI] [PMC free article] [PubMed] [Google Scholar]
- 25. Imholz AL, Koomen GC, Voorn WJ, Struijk DG, Arisz L, Krediet RT. Day-to-day variability of fluid and solute transport in upright and recumbent positions during CAPD. Nephrol Dial Transplant 1998; 13:146–53. [DOI] [PubMed] [Google Scholar]
- 26. Kinashi H, Ito Y, Mizuno M, Suzuki Y, Terabayashi T, Nagura F, et al. TGF-β1 promotes lymphangiogenesis during peritoneal fibrosis. J Am Soc Nephrol 2013; 24:1627–42. [DOI] [PMC free article] [PubMed] [Google Scholar]
- 27. Devuyst O, Rippe B. Water transport across the peritoneal membrane. Kidney Int 2014; 85:750–8. [DOI] [PubMed] [Google Scholar]
- 28. Parikova A, Smit W, Struijk DG, Zweers MM, Krediet RT. The contribution of free water transport and small pore transport to the total fluid removal in peritoneal dialysis. Kidney Int 2005; 68:1849–56. [DOI] [PubMed] [Google Scholar]
- 29. Umenishi F, Schrier RW. Hypertonicity-induced aquaporin-1 (AQP1) expression is mediated by the activation of MAPK pathways and hypertonicity-responsive element in the AQP1 gene. J Biol Chem 2003; 278:15765–70. [DOI] [PubMed] [Google Scholar]
- 30. Lai KN, Li FK, Lan HY, Tang S, Tsang AW, Chan DT, et al. Expression of aquaporin-1 in human peritoneal mesothelial cells and its upregulation by glucose in vitro. J Am Soc Nephrol 2001; 12:1036–45. [DOI] [PubMed] [Google Scholar]
- 31. Sampimon DE, Barreto DL, Coester AM, Struijk DG, Krediet RT. The value of the osmotic conductance and free water transport in the prediction of encapsulating peritoneal sclerosis. Adv Perit Dial 2014; 30:21–6. [PubMed] [Google Scholar]
- 32. Ho-Dac-Pannekeet MM, Koopmans JG, Struijk DG, Krediet RT. Restriction coefficients of low molecular weight solutes and macromolecules during peritoneal dialysis. Adv Perit Dial 1997; 13:72–6. [PubMed] [Google Scholar]
- 33. Ho-Dac-Pannekeet MM, Hiralall JK, Struijk DG, Krediet RT. Longitudinal follow-up of CA125 in peritoneal effluent. Kidney Int 1997; 51:888–93. [DOI] [PubMed] [Google Scholar]
- 34. Lopes Barreto D, Coester AM, Noordzij M, Smit W, Struijk DG, Rogers S, et al. Variability of effluent cancer antigen 125 and interleukin-6 determination in peritoneal dialysis patients. Nephrol Dial Transplant 2011; 26:3739–44. [DOI] [PubMed] [Google Scholar]
- 35. Pannekeet MM, Zemel D, Koomen GC, Struijk DG, Krediet RT. Dialysate markers of peritoneal tissue during peritonitis and in stable CAPD. Perit Dial Int 1995; 15:217–25. [PubMed] [Google Scholar]
- 36. Selgas R, Fernandez-Reyes MJ, Bosque E, Bajo MA, Borrego F, Jimenez C, et al. Functional longevity of the human peritoneum: how long is continuous peritoneal dialysis possible? Results of a prospective medium long-term study. Am J Kidney Dis 1994; 23:64–73. [DOI] [PubMed] [Google Scholar]
- 37. Wong TY, Szeto CC, Lai KB, Lam CW, Lai KN, Li PK. Longitudinal study of peritoneal membrane function in continuous ambulatory peritoneal dialysis: relationship with peritonitis and fibrosing factors. Perit Dial Int 2000; 20:679–85. [PubMed] [Google Scholar]
- 38. Perl J, Nessim SJ, Bargman JM. The biocompatibility of neutral pH, low-GDP peritoneal dialysis solutions: benefit at bench, bedside, or both? Kidney Int 2011; 79:814–24. [DOI] [PubMed] [Google Scholar]
- 39. Johnson DW, Brown FG, Clarke M, Boudville N, Elias TJ, Foo MW, et al. The effect of low glucose degradation product, neutral pH versus standard peritoneal dialysis solutions on peritoneal membrane function: the balANZ trial. Nephrol Dial Transplant 2012; 27:4445–53. [DOI] [PMC free article] [PubMed] [Google Scholar]
Associated Data
This section collects any data citations, data availability statements, or supplementary materials included in this article.


