Abstract
Patient no-shows for scheduled primary care appointments are common. Unused appointment slots reduce patient quality of care, access to services and provider productivity while increasing loss to follow-up and medical costs. This paper describes patterns of no-show variation by patient age, gender, appointment age, and type of appointment request for six individual service lines in the United States Veterans Health Administration (VHA). This retrospective observational descriptive project examined 25,050,479 VHA appointments contained in individual-level records for eight years (FY07-FY14) for 555,183 patients. Multifactor analysis of variance (ANOVA) was performed, with no-show rate as the dependent variable, and gender, age group, appointment age, new patient status, and service line as factors. The analyses revealed that males had higher no-show rates than females to age 65, at which point males and females exhibited similar rates. The average no-show rates decreased with age until 75–79, whereupon rates increased. As appointment age increased, males and new patients had increasing no-show rates. Younger patients are especially prone to no-show as appointment age increases. These findings provide novel information to healthcare practitioners and management scientists to more accurately characterize no-show and attendance rates and the impact of certain patient factors. Future general population data could determine whether findings from VHA data generalize to others.
Keywords: outpatient appointments, no-shows, frequent attenders, statistical analysis
1. Introduction
No-show patient appointments have been defined as “patients who neither kept nor cancelled scheduled appointments” [1]. Although the documented rates of missed appointments may vary somewhat between countries, health care systems, and clinical settings [2], appointment-breaking behaviors constitute a widespread, global issue [2,3,4]. No-show rates have been shown to range from 15%–30% in general medicine clinics and urban community centers [5,6]. It has also been reported that no-show rates can reach as high as 50% in primary care [7].
Missed appointments represent a major burden on health care systems and have a negative impact on patient care [8]. For example, patient no-shows can cause scheduling and operational difficulties for clinics [9,10] and reduced productivity [11,12]. No-shows can also reduce access to care [13], as well as interrupt continuity of care and effective disease management for patients [12,13,14,15,16]. Although the level of economic impact differs according to the health care system, the overall financial cost of no-shows is substantial [17]. In one of the few national studies, it was estimated that the financial cost to the United Kingdom National Health Service (from nonattendance at outpatient clinics) was approximately ₤790 million per year [3].
The Veterans Health Administration (VHA), one of the largest integrated healthcare delivery systems in the United States [18], has had a similar experience. For example, it was projected that approximately 18 percent of the scheduled annual VHA outpatient appointments (in 10 performance measure clinics) were unused in fiscal year 2008. The VHA estimates the cost of no-shows and unused appointments is approximately $564 million annually [17]. To reduce missed clinic appointments, organizations must mine data [19], develop effective appointment-keeping strategies [20,21], and systemically implement strategies in their operations [22].
Attempts to do simulation modeling using estimates of no-show and frequent attendance rates, distributions, and patient factor interactions are often confounded by (1) study precision and validity; (2) non-generalizable results from relatively small, unique, and poorly sampled studies; (3) pervasive difficulties with bias; (4) non-standardized problem definitions and methodologies; and (5) inconsistent statistical reporting of results [11,23] Indeed, computer modeling that ignores realistic conditions, parameters, and thresholds are often found to perform poorly [24]. Therefore, improving access to unbiased information derived from large sets of data is essential in order to address these problems [10,25].
Studies identifying predictors of appointment no-shows are important to clinicians. Factors that predict no-show allow researchers and clinicians to improve performance. For example, appointment overbooks may contribute to unnecessary waiting times for patients and overtime for practitioners. However, better forecasting of attendance rates can minimize these errors and increase access to quality healthcare [26].
The Pittsburgh Veterans Engineering Resource Center (VERC) led a VHA effort known as the National Initiative to Reduce Missed Opportunities (NIRMO). This initiative uses predictive and simulation modeling, data mining and statistical analysis on large data sets to design and test techniques to reduce patient appointment breaking behaviors. The NIRMO work is important because it reveals the impact of universal factors from a broad segment of patients accessing all types of care at multiple sites over many years [27,28,29,30,31,32].
This report is descriptive, retrospective and observational from VHA patient-level appointment data over from fiscal year 2007 to 2014. It describes how no-show rates vary with patient age, gender, and with appointment age.
2. Materials and Methods
2.1. Data Sources
The data for this descriptive, retrospective project were extracted from the United States Department of Veterans Affairs Electronic Health Record (EHR) system, known as the Veterans Health Information Systems and Technology Architecture (VistA). Appointments were categorized into two types: complete and incomplete. A complete appointment describes any appointment that was scheduled and completed, while an incomplete appointment was one that was scheduled but the patient was not seen by a healthcare provider and it was not cancelled in advance.
2.2. Data Collection and Cleaning
All scheduled outpatient appointments were examined for eight years (FY2007 through FY2014) from three large, tertiary level VHA facilities from three geographically different locations: Pittsburgh, Tampa, and Houston. The VHA outpatient appointments were grouped into stop codes and then aggregated into six service lines: Primary Care; Mental Health; Specialty Medicine; Rehabilitation; Surgery; and Other. For a general description of service line departments, please see Table A1 in the appendix.
The available data fields included a de-identified patient ID number, patient age at the time of the appointment, gender, the date the appointment was entered into the system, the date and time for which the appointment was scheduled, and the final appointment status (complete or incomplete). Additionally patients were classified into new or already established for a given appointment. New patients were those who did not complete an appointment within a given clinic type during the prior 24 months. Some patients were active in the VA outpatient system for all years studied, while others were active for only a subset of those years. The appointment age was determined by calculating the number of days between the date the appointment was created and the date the appointment was completed. The final data set included 555,183 patients, who scheduled 25,050,479 appointments.
2.3. Data Analyses and Methods
Multifactor analysis of variance (ANOVA) was performed, with no-show rate as the dependent variable and the following factors; A. New versus Established patients; B. Appointment Age Groups; C. Patient Age Groups; D. Gender; E. Service Line. Pairwise comparisons were performed using 95% Tukey intervals (other interval types gave similar results). All interactions of order two were included to uncover the significance of the main effects on the no-show rate. This allowed for a more detailed look at the interactions between gender, appointment and patient age, and whether the patient was new or established. Service line was included in the analysis to factor in differences in scheduling.
3. Results and Discussion
The following section describes the analysis and discusses the results of the subsequent ANOVA. Table 1 shows that the main effects and all the interactions of order 2 are significant. Note that the interaction between Appointment Age Group and Gender has the smallest significance as indicated by the F-Ratio in Table 1.
Table 1.
Analysis of variance results for no-show rate—Type III sum of squares.
| Main Effects | Sum of Squares | Df | Mean Square | f-ratio | p-value |
|---|---|---|---|---|---|
| A: New vs Est | 11679.9 | 1 | 11679.9 | 96782.68 | 0 |
| B: Appt Age Group | 14534.5 | 9 | 1614.94 | 13381.88 | 0 |
| C: Age Group | 10367.9 | 13 | 797.527 | 6608.54 | 0 |
| D: Gender | 10.5457 | 1 | 10.5457 | 87.38 | 0 |
| E: Service Line | 1254.31 | 5 | 250.682 | 2078.72 | 0 |
| Interactions | Sum of Squares | Df | Mean Square | f-ratio | p-value |
| AB | 14906.3 | 9 | 1656.25 | 13724.16 | 0 |
| AC | 246.517 | 13 | 18.9628 | 157.13 | 0 |
| AD | 13.2343 | 1 | 13.2343 | 109.66 | 0 |
| AE | 4289.99 | 5 | 857.997 | 7109.61 | 0 |
| BC | 11011.8 | 117 | 94.1178 | 779.89 | 0 |
| BD | 59.6455 | 9 | 6.62728 | 54.92 | 0 |
| BE | 6113.94 | 45 | 135.865 | 1125.82 | 0 |
| CD | 302.393 | 13 | 23.261 | 192.75 | 0 |
| CE | 2057.52 | 65 | 31.6541 | 262.29 | 0 |
| DE | 66.027 | 5 | 13.2054 | 109.42 | 0 |
| Residual | 3.02 × 10⁶ | 25048804 | 0.120681 | ||
| Total (Corrected) | 3.21 × 10⁶ | 25049115 |
All f-ratios are based on the residual mean square error.
3.1. Gender and Age Frequencies
The VHA population was predominately male (91.47%) and between 60 and 70 years of age or older (29.32% of the total population). Table 2 provides a breakdown of 14 age groupings compared to the total population. This sample contains about 10 times more males than females. The highest female appointment frequency occurs at age 45 to 64 compared to males at age 55 to 69. This pattern reflects recent national trends of more women in the military.
Table 2.
Appointment frequencies for males and females.
| Age Group | Females | Males | ||
|---|---|---|---|---|
| Number of Appointments | % of Total | Number of Appointments | % of Total | |
| 0–24 | 19,673 | 0.92% | 63,943 | 0.28% |
| 24–29 | 131,159 | 6.14% | 494,210 | 2.16% |
| 30–34 | 173,758 | 8.14% | 583,566 | 2.55% |
| 35–39 | 147,651 | 6.91% | 423,802 | 1.85% |
| 40–44 | 199,126 | 9.32% | 697,399 | 3.04% |
| 45–49 | 241,899 | 11.33% | 923,322 | 4.03% |
| 50–54 | 328,301 | 15.37% | 1,599,931 | 6.98% |
| 55–59 | 339,660 | 15.91% | 2,339,433 | 10.21% |
| 60–64 | 277,320 | 12.99% | 4,378,852 | 19.11% |
| 65–69 | 124,670 | 5.84% | 4,311,926 | 18.82% |
| 70–74 | 42,317 | 1.98% | 2,001,707 | 8.74% |
| 75–79 | 32,224 | 1.51% | 1,746,780 | 7.62% |
| 80–84 | 24,441 | 1.14% | 1,575,799 | 6.88% |
| 85+ | 52,891 | 2.48% | 1,773,356 | 7.74% |
| Total | 2,135,090 | 22,914,026 | ||
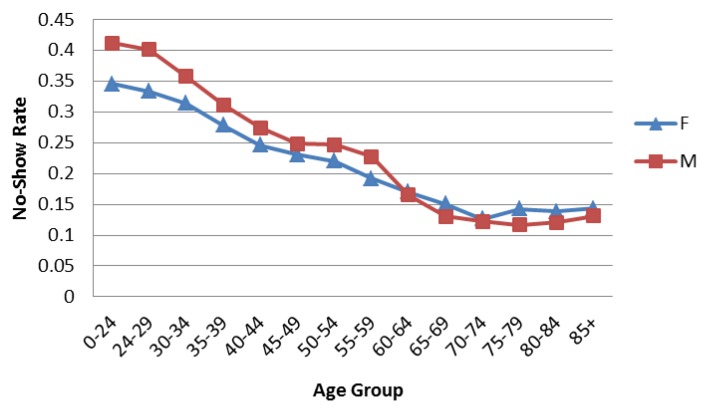
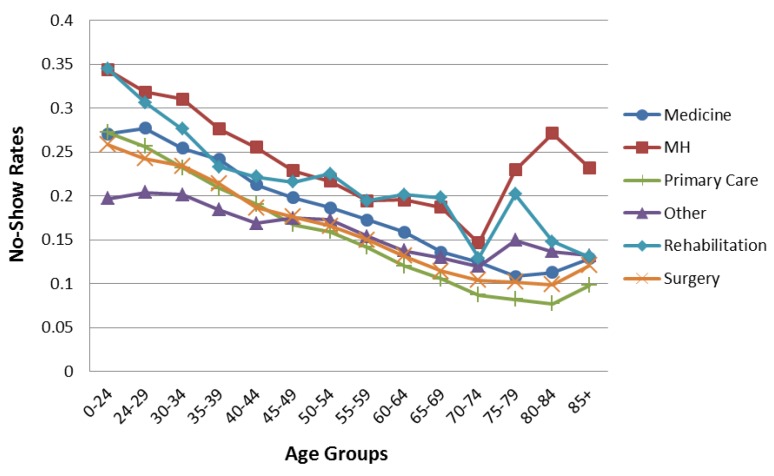
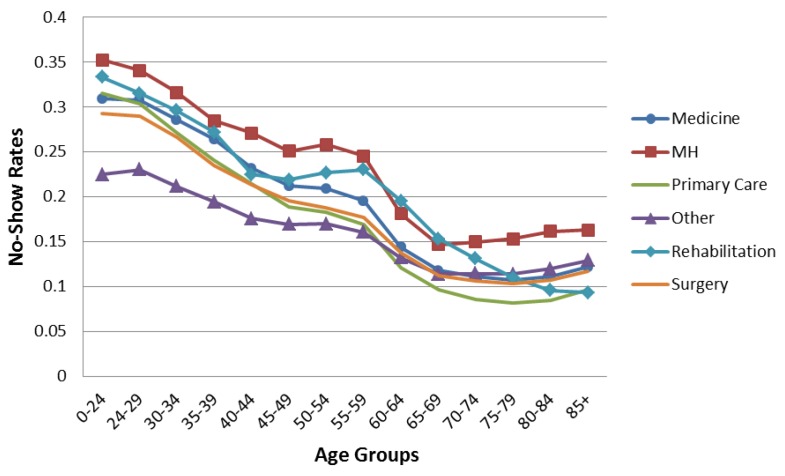
Figure 1 shows the aggregated no-show data trends. The overall average no-show rates decrease with age until 75–79, when they increase slightly. Males have higher no-show rates than females until age 65, when males and females exhibit similar rates. Figure 2 and Figure 3 compare the overall pattern segmented by service line, gender, and age. The Medical, Primary Care, and Surgery Service Lines have patterns similar to the overall results in Figure 1. Interestingly, Mental Health and Rehabilitation reveal females above age 74 with higher than overall expected no-show rates. While this observation could be influenced by relatively small numbers (see Table 2), it is an area for further study. Appointment frequencies are broken down, in Table 3, to reflect the total number of appointments for each service line by gender and age grouping.
Figure 1.
No-show rates by age group for all service lines.
Figure 2.
No-show rates for female patients by age groups separated by service line.
Figure 3.
No-show rates for male patients by age groups separated by service line.
Table 3.
Appointment frequencies for all service lines.
| Age Group | Medicine | Mental Health | Primary Care | Other | Rehabilitation | Surgery | ||||||
|---|---|---|---|---|---|---|---|---|---|---|---|---|
| Female | Male | Female | Male | Female | Male | Female | Male | Female | Male | Female | Male | |
| 0–24 | 1754 | 6586 | 3018 | 11,944 | 4321 | 11,381 | 7542 | 21,041 | 1112 | 7302 | 1926 | 5689 |
| 24–29 | 12,304 | 45,206 | 20,822 | 101,700 | 29,131 | 89,165 | 46,589 | 170,995 | 5696 | 47,220 | 16,617 | 39,924 |
| 30–34 | 17,149 | 57,504 | 29,122 | 126,908 | 36,642 | 107,362 | 60,358 | 197,751 | 7532 | 41,984 | 22,955 | 52,057 |
| 35–39 | 16,136 | 44,540 | 26,023 | 83,089 | 29,326 | 81,285 | 49,719 | 144,080 | 6533 | 28,317 | 19,914 | 42,491 |
| 40–44 | 22,920 | 81,845 | 33,637 | 134,158 | 37,011 | 132,791 | 68,282 | 229,308 | 9208 | 41,837 | 28,068 | 77,460 |
| 45–49 | 27,562 | 113,670 | 41,140 | 167,283 | 44,297 | 178,699 | 83,010 | 299,944 | 11,078 | 51,745 | 34,812 | 111,981 |
| 50–54 | 39,846 | 199,999 | 51,901 | 284,787 | 61,392 | 301,947 | 112,290 | 532,357 | 15,846 | 77,383 | 47,026 | 203,458 |
| 55–59 | 43,107 | 326,969 | 47,007 | 352,886 | 64,995 | 444,169 | 118,507 | 787,947 | 16,129 | 106,456 | 49,915 | 321,006 |
| 60–64 | 36,171 | 706,403 | 31,860 | 587,188 | 58,037 | 832,968 | 96,595 | 1,416,052 | 13,284 | 196,063 | 41,373 | 640,178 |
| 65–69 | 18,416 | 753,579 | 10,289 | 394,470 | 26,057 | 849,214 | 43,823 | 1,416,132 | 6076 | 203,456 | 20,009 | 695,075 |
| 70–74 | 6624 | 360,514 | 2256 | 89,101 | 8834 | 427,438 | 15,107 | 675,099 | 1817 | 106,472 | 7679 | 343,083 |
| 75–79 | 5765 | 295,694 | 1372 | 47,478 | 6874 | 398,430 | 10,945 | 599,550 | 1493 | 107,521 | 5775 | 298,107 |
| 80–84 | 3440 | 239,636 | 1327 | 49,929 | 5168 | 369,757 | 8965 | 530,041 | 1219 | 121,908 | 4322 | 264,528 |
| 85+ | 7613 | 244,755 | 1991 | 52,690 | 12,754 | 423,617 | 18,113 | 587,055 | 4364 | 171,569 | 8056 | 293,670 |
3.2. Appointment Age
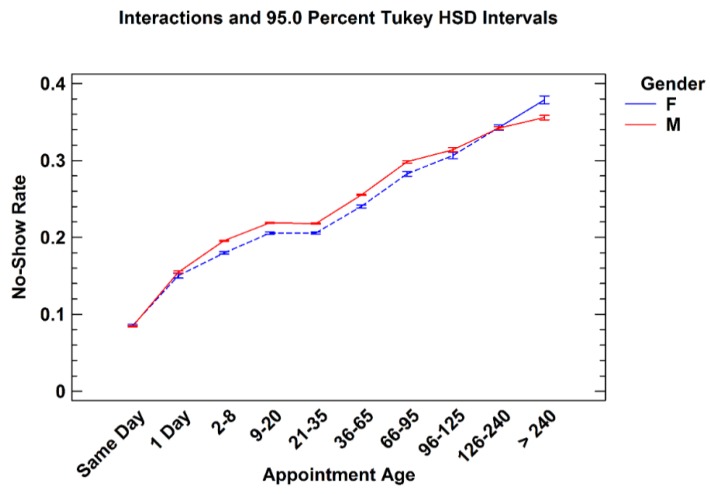
Appointment age is defined as the difference between the date an appointment was scheduled and the future pending appointment date. This shows “how far in advance” an appointment is created or made. Consistent with past research, no-show rates increase as appointment age increases [32,33]. While no-show rates for males were generally higher than females, males and females tended to have similar rates with respect to appointment age, shown in Figure 4. The appointment frequencies, in Table 4, show that the majority of the total appointments (63.6%) occurred between two and 65 days of lead time. There were also a large number of same day appointments. This holds true across all service line, shown in Table 5.
Figure 4.
No-show rates for males and females by appointment age groups.
Table 4.
Appointment frequencies and percentages by gender for appointment age groups.
| Appt Age (Day) | Female | Male | Total | |||
|---|---|---|---|---|---|---|
| Number of Appts | % Total of Female Appts | Number of Appts | % Total of Male Appts | Number of Appts | % of Total Appts | |
| Same Day | 395,364 | 18.51% | 3,689,640 | 16.1% | 4,085,004 | 16.31% |
| 1 | 84,264 | 3.95% | 814,249 | 3.55% | 898,513 | 3.59% |
| 2–8 | 313,590 | 14.68% | 3,128,648 | 13.65% | 3,442,238 | 13.74% |
| 9–20 | 364,528 | 17.07% | 3,842,965 | 16.77% | 4,207,493 | 16.8% |
| 21–35 | 417,340 | 19.54% | 4,686,005 | 20.45% | 5,103,345 | 20.37% |
| 36–65 | 268,719 | 12.58% | 2,906,762 | 12.69% | 3,175,481 | 12.68% |
| 66–95 | 113,174 | 5.3% | 1,258,943 | 5.49% | 1,372,117 | 5.48% |
| 96–125 | 54,656 | 2.56% | 726,417 | 3.17% | 781,073 | 3.12% |
| 126–240 | 86,278 | 4.04% | 1,364,690 | 5.96% | 1,450,968 | 5.79% |
| >240 | 37,560 | 1.76% | 496,253 | 2.17% | 533,813 | 2.13% |
| Total | 2,135,473 | 22,914,572 | 25,050,045 | |||
Table 5.
Appointment frequencies and percentages for all service lines by appointment age groups.
| Appt Age (Day) | Medicine | Mental Health | Other | Primary Care | Rehabilitation | Surgery | Total | |||||||
|---|---|---|---|---|---|---|---|---|---|---|---|---|---|---|
| Number of Appts | % Total Medicine appts | Number of Appts | % Total Number of MH Appts | Number of Appts | % Total Number of Other Appts | Number of Appts | % Total Number of PC Appts | Number of Appts | % Total Number of Rehab Appts | Number of Appts | % Total Number of Surgery Appts | Number of Appts | % Total Number of All Appts | |
| Same Day | 441,431 | 11.8% | 413,203 | 14.8% | 1,878,555 | 22.5% | 717,933 | 14.2% | 262,853 | 18.6% | 371,093 | 10.0% | 4,085,068 | 16.3% |
| 1 | 111,423 | 3.0% | 86,504 | 3.1% | 297,810 | 3.6% | 202,417 | 4.0% | 73,192 | 5.2% | 127,180 | 3.4% | 898,526 | 3.6% |
| 2–8 | 472,527 | 12.6% | 449,746 | 16.1% | 1,038,066 | 12.4% | 641,199 | 12.6% | 299,801 | 21.3% | 540,970 | 14.6% | 3,442,309 | 13.7% |
| 9–20 | 664,157 | 17.8% | 511,787 | 18.4% | 1,271,704 | 15.2% | 762,196 | 15.0% | 307,757 | 21.8% | 689,969 | 18.7% | 4,207,570 | 16.8% |
| 21–35 | 857,743 | 23.0% | 566,629 | 20.3% | 1,393,564 | 16.7% | 1,124,022 | 22.2% | 302,548 | 21.4% | 858,938 | 23.2% | 5,103,444 | 20.4% |
| 36–65 | 571,111 | 15.3% | 441,443 | 15.8% | 838,245 | 10.0% | 690,110 | 13.6% | 127,235 | 9.0% | 507,387 | 13.7% | 3,175,531 | 12.7% |
| 66–95 | 229,025 | 6.1% | 190,068 | 6.8% | 422,612 | 5.1% | 257,315 | 5.1% | 24,462 | 1.7% | 248,664 | 6.7% | 1,372,146 | 5.5% |
| 96–125 | 141,963 | 3.8% | 80,148 | 2.9% | 253,607 | 3.0% | 164,523 | 3.2% | 6,332 | 0.4% | 134,508 | 3.6% | 781,081 | 3.1% |
| 126–240 | 201,667 | 5.4% | 43,991 | 1.6% | 658,778 | 7.9% | 380,146 | 7.5% | 3,858 | 0.3% | 162,545 | 4.4% | 1,450,985 | 5.8% |
| >240 | 44,785 | 1.2% | 1,925 | 0.1% | 295,111 | 3.5% | 133,339 | 2.6% | 2,681 | 0.2% | 55,978 | 1.5% | 533,819 | 2.1% |
| Total | 3,735,832 | 2,785,444 | 8,348,052 | 5,073,200 | 1,410,719 | 3,697,232 | 25,050,479 | |||||||
3.2.1. New versus Established Patients
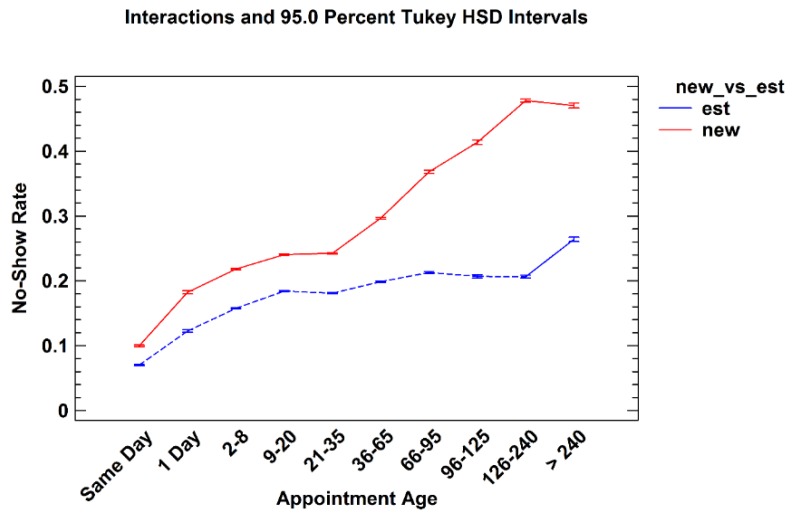
New patients are defined as those who did not have a completed appointment within a single service line clinic during the prior 24 months. Figure 5 shows the no-show rates for both new and established patients based on their appointment age. While there was only a slight difference found between rates for same day appointments, nevertheless there were significant differences between new and established patients across all appointment age groups. It is hypothesized that this finding reflects a new patient’s desire to address their clinical needs quickly. This data suggests clinic managers and practices should be particularly attentive to their new patient waiting times.
Figure 5.
No-show rates for new and established patients by appointment age groups.
3.2.2. Patient Age vs. Appointment Age
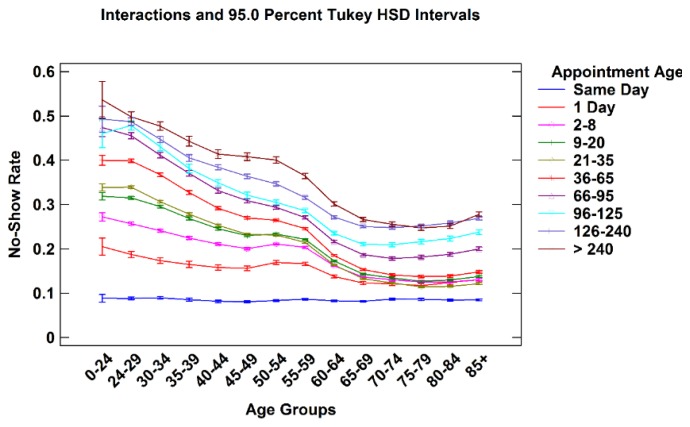
Figure 6 shows an interaction plot of patient age and appointment age. Each line represents appointments that fall into one of nine progressively longer appointment age time groups displayed by patient age. While overall no-show rates increase with appointment age for all patient age groups, the relative impact as shown by the shape of the lines, are different. Same Day appointments generate a relatively constant no-show rate across all patient age groups. However, as appointment age increases, younger patient’s no-show rates dramatically increase compared to older patients. In addition, appointment age of even one to eight days is disproportionally higher in younger patients compared to older patients. As patient age increases, the overall pattern seen in Figure 1, Figure 2 and Figure 3 emerges. This observation suggests that managers may consider confirming the intention to keep appointments especially for young patients with longer appointment ages.
Figure 6.
No-show rates for all appointment age groups by patient age.
4. Conclusions
This paper describes the variation of no-show rates with patient age, gender, appointment age, and type of request within six individual service line of the United States VHA. The analyses revealed that males had higher no-show rates than females to age 65 where males and females exhibited similar rates. Average no-show rates decrease with age until age 75–79, whereupon they increase. No-show rates increase as appointment age lengthens for all age groups. Younger patients are especially prone to no-show as appointment age increases. New patients no-show at higher rates than established patients, especially beyond 36 days of lead time. These findings suggest particular attention to female patients over age 74 in Mental Health and Rehabilitation may be warranted.
This data has several limitations. The VA population does not map directly to the general United States patient population due to the greater percentages of older, male Veterans and the fact that female Veterans tend to be younger than male Veterans [34]. This data is consistent with the overall VA population median age of 57 years and approximately 90% male. Likewise, the age distribution for females is skewed more heavily towards lower age groupings as in the overall VA population [29]. Further analyses may determine if the findings are present in a non-VA population. While this data is available by service line or type, the study did not include diagnosis-specific information. For that reason, there may be additional diagnosis-related factors influencing patient appointment attendance behaviors that influence these results.
Many additional factors have been associated with nonattendance. These factors include a patient’s race and ethnicity, socio-economic status, marital status, beliefs about their symptoms, source of illness, and severity of the patient’s condition [16,25,26,27,35,36]. Further, no-shows have been associated with structural barriers, such as distance to the clinic and lack of transportation [25,37]. Additionally, patient no-shows have been shown to vary by physician characteristics, patient-physician interaction, clinic access, administrative processes, and environmental factors including team communication and on-time appointments [25]. VHA data reveals no-show variation by geographical region and rural and urban settings. To best predict and minimize no-show rates, the influence of these additional factors may be important to understand and manage.
These findings from VHA longitudinal data allow understanding of no-shows from a large and statistically significant multi-year data set with little sampling bias. Practitioners working in the areas of operational research may find the results useful in order to more accurately characterize no-show and frequent attendance rates, and patient factor interactions. As a result of this study, clinicians and managers may wish to focus special attention on young male patients, new patients, and females over 74 in Mental Health and Rehabilitation. Computer and analytical modeling, as well as scheduling system re-engineering, may use this information to answer important questions regarding patient appointment behavior predictions and profiles. Future examination of data from the general population is needed to determine if the findings are generalizable beyond this population.
Acknowledgments
This work was supported by contracts VA244-P-1120 and VA244-12-C-0534 between the Veterans Administration and the University of Pittsburgh, and by the Katz Graduate School of Business. We would like to express a great deal of gratitude to the following members of the National Initiative to Reduce Missed Opportunities (NIRMO) project team who have spent countless hours supporting, teaching and implementing the project initiatives: Jake Arakal, Howard Bachtel, Matthew Boyas, Stacey Campbell, Catherine Carle, Nicholas Celender, Stephen Chen, Meaghan Clarry, David Cord, Adam Critchlow, Joseph DeUnger, Mitra Ebrahimi, Mary Fields, Janie Fleming, Lovetta Ford, John Gennaro, Elizabeth Helsel, Tyler Horgan, Tina Howell, Matthew Jenkins, Ian Joos, Andrew Juba, Shriranjana Karthikeyann, Nicholas Katich, Ashley Ketterer, Christina Kratz, David Macpherson, MD, Elizabeth May, Margret Mizah, Johnson Moore, Scott Moore, Jessica Ngan, Joann Orbin, Ravi Patel, Gregory Pauley, Alan Petrazzi, Barbara Schuster, Melissa Shogren, Neha Singla, Dawn Smith, Tiffany Stubbs, Deanna Suskovich, Jahan Taheri, Lanxi Tang, Kaitlyn Titus, Kimberly Toland, Jessica Varone, Rebecca Wheelock, Terry Gerigk Wolf and numerous VHA staff who supported NIRMO initiative. We could not have done this without your tireless support.
Appendix
Table A1.
Service line details.
| Medicine | Nutrition/Dietetics | Radiation Therapy | General Internal Medicine | Allergy Immunology |
| Cardiology | Dermatology | Endocrinology | ||
| Diabetes | Gastroenterology | Hematology | ||
| Oncology | Hypertension | Infectious disease | ||
| Pacemaker | Pulmonary | Renal | ||
| Rheumatology | Neurology | Oncology | ||
| Anti-Coagulation Clinic | Geriatrics | Alzheimer's/Dementia Clinic | ||
| Endoscopy | Chemotherapy | Cardiac Catheterization | ||
| Cardiac Stress Test | Hepatology Clinic | Sleep Medicine | ||
| Mental Health | Mental Health Clinic | Psychiatry | Psychology | Substance Use Disorder |
| Other | Pulmonary Function | X-ray | EEG | EKG |
| Laboratory | Nuclear Medicine | Ultrasound | ||
| Respiratory Therapy | Home Treatment/Services | Health Screening | ||
| Residential Care | Social Work Service | Topography | ||
| Emergency Dept | Urgent Care Unit | Sleep Study | ||
| Computerized Tomography | MRI | Interventional Radiography | ||
| Magnetoencephalography | Brachytherapy Treatment | Alternative Medicine | ||
| Clinical Pharmacy | Dental | Care/Case Manager | ||
| Recreation Therapy Service | Blind Rehab | Parkinson's Disease Service | ||
| Obstetrics | Genomic Care | Pediatrics | ||
| Family Practice | Epilepsy | ALSs Center | ||
| Hospice Care | Amputation Clinic | Cast clinic | ||
| Chiropractic Care | Low Vision care | Transplant | ||
| Research | Bronchoscopy | Hemodialysis | ||
| Primary Care | Primary Care/Medicine | |||
| Rehabilitation | Enterostomal Care | Radionuclide Therapy | Polytrauma | Physical Medicine Audiology |
| Speech-Language Pathology | Physical Therapy | Occupational Therapy | ||
| Spinal Cord Injury | Electromyogram | Kinesiotherapy | ||
| Intermed Low Vision Care | ||||
| Surgery | General Surgery | Cardiac Surgery | ENT | Gynecology |
| Hand surgery | Neurosurgery | Ophthalmology | ||
| Optometry | Orthopedics | Plastic surgery | ||
| Podiatry | Proctology | Thoracic Surgery | ||
| Urology | Vascular Surgery | Dialysis | ||
| Prosthetics/Orthotics | Anesthesia Surgical Consult | Pain Clinic | ||
Author Contributions
Michael L. Davies, Rachel M. Goffman, Jerrold H. May, Robert J. Monte, and Youxu C. Tjader conceived and designed the project; Jerrold H. May and Youxu C. Tjader acquired the data; Jerrold H. May, Keri L. Rodriguez, and Dominic L. Vargas analyzed and interpreted the data; Jerrold H. May, Keri L. Rodriguez, and Dominic L. Vargas wrote the manuscript; Michael L. Davies, Rachel M. Goffman, Jerrold H. May, Robert J. Monte, Keri L. Rodriguez, Youxu C. Tjader, and Dominic L. Vargas edited and approved the manuscript.
Conflicts of Interest
The authors declare no conflict of interest.
Disclaimer
The views expressed in this article are those of the authors and do not necessarily reflect the position or policy of the Department of Veterans Affairs or the United States Government.
References
- 1.Tuso P.J., Murtishaw K., Tadros W. The easy access program: A way to reduce patient no-show rate, decrease add-ons to primary care schedules, and improve patient satisfaction. Perm. J. 1999;3:68–71. [Google Scholar]
- 2.Perron N.J., Dao M.D., Kossovsky M.P., Miserez V., Chuard C., Calmy A., Gaspoz J.M. Reduction of missed appointments at an urban primary care clinic: A randomised controlled study. BMC Fam. Pract. 2010;11 doi: 10.1186/1471-2296-11-79. [DOI] [PMC free article] [PubMed] [Google Scholar]
- 3.Atun A.R., Sittampalam S.R., Mohan A. Uses and Benefits of SMS in Healthcare Delivery. Volume 21 Centre for Health Management, Imperial College; London, UK: 2005. [Google Scholar]
- 4.Turkcan A., Nuti L., DeLaurentis P.C., Tian Z., Daggy J., Zhang L., Lawley M., Sands L. No-show modeling for adult ambulatory clinics. In: Denton B.T., editor. Handbook of Healthcare Operations Management. Volume 184. Springer; New York, NY, USA: 2013. pp. 251–288. [Google Scholar]
- 5.Goldman L., Freidin R., Cook E.F., Eigner J., Grich P. A multivariate approach to the prediction of no-show behavior in a primary care center. Arch. Intern. Med. 1982;142:563–567. doi: 10.1001/archinte.1982.00340160143026. [DOI] [PubMed] [Google Scholar]
- 6.Hixon A.L., Chapman R.W., Nuovo J. Failure to keep clinic appointments: Implications for residency education and productivity. Fam. Med. 1999;31:627–630. [PubMed] [Google Scholar]
- 7.Lacy N.L., Paulman A., Reute M.D., Lovejoy B. Why we don’t come: Patient perceptions of no-shows. Ann. Fam. Med. 2004;2:541–545. doi: 10.1370/afm.123. [DOI] [PMC free article] [PubMed] [Google Scholar]
- 8.Moore C.G., Wilson-Witherspoon P., Probst J.C. Time and money: Effects of no-shows at a family practice residency clinic. Fam. Med. 2001;33:522–527. [PubMed] [Google Scholar]
- 9.Gupta D., Denton B. Appointment scheduling in health care: Challenges and opportunities. IIE Trans. 2008;40:800–819. doi: 10.1080/07408170802165880. [DOI] [Google Scholar]
- 10.Kopach R., DeLaurentis P.C., Lawley M., Muthuraman K., Ozen L., Rardin R., Wan H., Intrevado P., Qu X., Willis D. Effects of clinical characteristics on successful open access scheduling. Health Care Manag. Sci. 2007;10:111–124. doi: 10.1007/s10729-007-9008-9. [DOI] [PubMed] [Google Scholar]
- 11.Daggy J., Lawley M., Willis D., Thayer D., Suelzer C., DeLaurentis P.C., Turkcan A., Chakraborty S., Sands L. Using no-show modeling to improve clinic performance. Health Inform. J. 2010;16:246–259. doi: 10.1177/1460458210380521. [DOI] [PubMed] [Google Scholar]
- 12.Nguyen D.L., DeJesus R.S., Wieland M.L. Missed appointments in resident continuity clinic: Patient characteristics and health care outcomes. J. Grad. Med. Educ. 2011;3:350–355. doi: 10.4300/JGME-D-10-00199.1. [DOI] [PMC free article] [PubMed] [Google Scholar]
- 13.Johnson B.J., Mold J.W., Pontius J.M. Reduction and management of no-shows by family medicine residency practice exemplars. Ann. Fam. Med. 2007;5:534–539. doi: 10.1370/afm.752. [DOI] [PMC free article] [PubMed] [Google Scholar]
- 14.Bowser D.M., Utz S., Glick D., Harmon R. A systematic review of the relationship of diabetes mellitus, depression, and missed appointments in a low-income uninsured population. Arch. Psychiatr. Nurs. 2010;24:317–329. doi: 10.1016/j.apnu.2009.12.004. [DOI] [PubMed] [Google Scholar]
- 15.Nuti L.A., Lawley M., Turkcan A., Tian Z., Zhang L., Chang K., Willis D.R., Sands L.P. No-shows to primary care appointments: Subsequent acute care utilization among diabetic patients. BMC Health Serv. Res. 2012;12 doi: 10.1186/1472-6963-12-304. [DOI] [PMC free article] [PubMed] [Google Scholar]
- 16.Schectman J.M., Schorling J., Voss J.D. Appointment adherence and disparities in outcomes among patients with diabetes. J. Gen. Intern. Med. 2008;23:1685–1687. doi: 10.1007/s11606-008-0747-1. [DOI] [PMC free article] [PubMed] [Google Scholar]
- 17.United States Department of Veterans Affairs . Audit of Veterans Health Administration's Efforts to Reduce Unused Outpatient Appointments. U.S. Department of Veterans Affairs Office of Inspector General; Washington, DC, USA: 2008. Report Number 08-00879-36. [Google Scholar]
- 18.United States Department of Veterans Affairs . Focusing on the Nation’s Priorities. Department of Veterans Affairs; Washington, DC, USA: 2007. [(accessed on 6 July 2015)]. Available online: http://www.gpoaccess.gov/usbudget/fy07/pdf/budget/veterans.pdf. [Google Scholar]
- 19.D’Avolio L.W. Electronic Medical Records at a crossroads: Impetus for change or missed opportunity? JAMA. 2009;302:1109–1111. doi: 10.1001/jama.2009.1319. [DOI] [PubMed] [Google Scholar]
- 20.Perron N.J., Dao M.D., Righini N.C., Humair J.P., Broers B., Narring F., Haller D.M., Gaspoz J.M. Text-messaging versus telephone reminders to reduce missed appointments in an academic primary care clinic: A randomized controlled trial. BMC Health Serv. Res. 2013;13 doi: 10.1186/1472-6963-13-125. [DOI] [PMC free article] [PubMed] [Google Scholar]
- 21.Parikh A., Gupta K., Wilson A.C., Fields K., Cosgrove N.M., Kostis J.B. The effectiveness of outpatient appointment reminder systems in reducing no-show rates. Am. J. Med. 2010;123:542–548. doi: 10.1016/j.amjmed.2009.11.022. [DOI] [PubMed] [Google Scholar]
- 22.Woodcock E.W. Mastering Patient Flow: Using Lean Thinking to Improve Your Practice Operations. 3rd ed. Medical Group Management Association; Englewood, CO, USA: 2007. [Google Scholar]
- 23.Liu N., Ziya S., Kulkarni V.G. Dynamic scheduling of outpatient appointments under patient no-shows and cancellations. Manuf. Serv. Oper. Manag. 2010;12:347–364. doi: 10.1287/msom.1090.0272. [DOI] [Google Scholar]
- 24.Luo J., Kulkarni V.G., Ziya S. Appointment scheduling under patient no-shows and service interruptions. Manuf. Serv. Oper. Manag. 2012;14:670–684. doi: 10.1287/msom.1120.0394. [DOI] [Google Scholar]
- 25.George A., Rubin G. Non-attendance in general practice: A systematic review and its implications for access to primary health care. Fam Pract. 2003;20:178–184. doi: 10.1093/fampra/20.2.178. [DOI] [PubMed] [Google Scholar]
- 26.Samorani M., LaGanga L. Outpatient appointment scheduling given individual day-dependent no-show predictions. Eur. J. Oper. Res. 2015;240:245–257. doi: 10.1016/j.ejor.2014.06.034. [DOI] [Google Scholar]
- 27.Bagalman E. Suicide Prevention Efforts of the Veterans Health Administration. Congressional Research Service; Washington, DC, USA: 2013. Report Number 7-5700. R42340. [Google Scholar]
- 28.Mitchell A.J., Selems T. Why don’t patients attend their appointments? Maintaining engagement with psychiatric services. Adv. Psychiatr. Treat. 2007;13:423–434. doi: 10.1192/apt.bp.106.003202. [DOI] [Google Scholar]
- 29.United States Department of Veterans Affairs . Interventions to Improve Veteran’s Access to Care: A Systematic Review of the Literature. U.S. Department of Veterans Affairs, Health Services Research and Development Service, Evidence-Based Synthesis Program; Washington, DC, USA: 2011. [Google Scholar]
- 30.Weinberger M., Oddone E.Z., Henderson W.G. Does increased access to primary care reduce hospital readmissions? Veterans Affairs Cooperative Study Group on Primary Care and Hospital Readmission. N. Engl. J. Med. 1996;334:1441–1447. doi: 10.1056/NEJM199605303342206. [DOI] [PubMed] [Google Scholar]
- 31.Gardner L.I., Marks G., Craw J.A., Wilson T.E., Drainoni M.L., Moore R.D., Mugavero M.J., Rodriguez A.E., Bradley-Springer L.A., Holman S., et al. Retention in Care Study Group. A low-effort, clinic-wide intervention improves attendance for HIV primary care. Clin. Infect. Dis. 2012;55:1124–1134. doi: 10.1093/cid/cis623. [DOI] [PMC free article] [PubMed] [Google Scholar]
- 32.Kirsh S.R., Lawrence R.H., Aron D.C. Tailoring an intervention to the context and system redesign related to the intervention: A case study of implementing shared medical appointments for diabetes. Implement. Sci. 2008;3 doi: 10.1186/1748-5908-3-34. [DOI] [PMC free article] [PubMed] [Google Scholar]
- 33.Giachetti R.E. A simulation study of interventions to reduce appointment lead-time and patient no-show rate; Proceedings of the 2008 Winter Simulation Conference; Miami, FL, USA. 7–10 December 2008. [Google Scholar]
- 34.Kessler C.S., Bhandarkar S., Casey P., Tenner A. Predicting patient patterns in veterans administration emergency departments. West. J. Emerg. Med. 2011;12:204–207. [PMC free article] [PubMed] [Google Scholar]
- 35.Bean A.G., Talaga J. Predicting appointment breaking. J. Health Care Mark. 1995;15:29–34. [PubMed] [Google Scholar]
- 36.United States Department of Veterans Affairs . VetPOP 2011. Office of Policy and Planning; Washington, DC, USA: 2011. [(accessed on 6 July 2015)]. Available online: http://www.va.gov/VETDATA/Veteran_Population.asp. [Google Scholar]
- 37.Siminoff L.A., Hausmann L.R.M., Ibrahim S. Barriers to obtaining diagnostic testing for coronary artery cisease among veterans. Am. J. Public Health. 2008;98:2207–2213. doi: 10.2105/AJPH.2007.123224. [DOI] [PMC free article] [PubMed] [Google Scholar]


