

Abstract
Prokaryotic CRISPR-Cas adaptive immune systems insert spacers derived from viruses and other parasitic DNA elements into CRISPR loci to provide sequence-specific immunity1,2. This frequently results in high within-population spacer diversity3–6, but it is unclear if and why this is important. Here we show that, as a result of this spacer diversity, viruses can no longer evolve to overcome CRISPR-Cas by point mutation, which results in rapid virus extinction. This effect arises from synergy between spacer diversity and the high specificity of infection, which greatly increases overall population resistance. We propose that the resulting short-lived nature of CRISPR-dependent bacteria–virus coevolution has provided strong selection for the evolution of sophisticated virus-encoded anti-CRISPR mechanisms7.
We previously reported that Pseudomonas aeruginosa strain UCBPP-PA14 evolves high levels of CRISPR-Cas (clustered regularly interspaced short palindromic repeats; CRISPR-associated) adaptive immunity against virus DMS3vir under laboratory conditions6. However, viruses can readily evolve to overcome sequence-specific CRISPR immunity8,9. To study how CRISPR-Cas impacts virus persistence, we measured titres of virus DMS3vir over time upon infection of either wild-type P. aeruginosa or a functional CRISPR-Cas knockout (CRISPR KO) strain. Virus that infected the wild-type strain went extinct at 5 days post-infection (d.p.i.) (Fig. 1a), whereas virus infecting the CRISPR KO strain persisted in all replicates until the experiment was terminated at 30 d.p.i. (Fig. 1b). Wild-type bacteria exclusively evolved CRISPR-mediated immunity, while the CRISPR KO strain evolved immunity by mutation, loss or masking of the receptor (that is, surface mutation) (Extended Data Fig. 1a). The observation that CRISPR-Cas drives virus extinct so rapidly was unexpected since viruses can escape CRISPR immunity by a single point mutation8,9.
Figure 1. Evolution of CRISPR-mediated immunity leads to rapid extinction of virus.
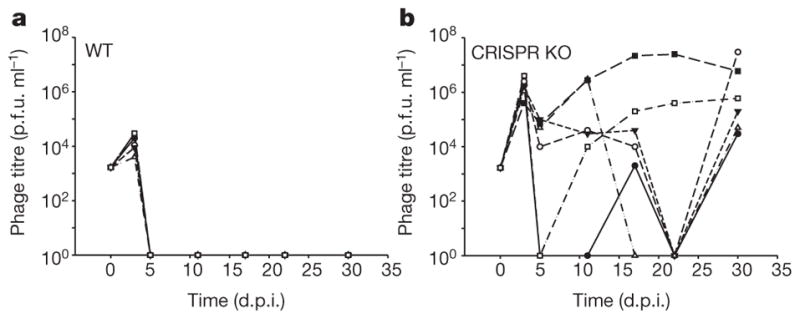
a, b, Titre (in plaque-forming units per millilitre) of virus DMS3vir over time upon infection of wild-type (WT) P. aeruginosa (a) and P. aeruginosa strain csy3::LacZ (b) (CRISPR KO strain). Each line indicates a biological replicate experiment (n = 6). The limit of detection is 200 p.f.u. ml−1.
Virus extinction might result from the high level of spacer diversity that naturally evolves upon virus exposure in this and other CRISPR-Cas systems3–6. Both theory and data suggest that host genetic diversity can synergistically reduce the spread of parasites if the infection process is specific (that is, a parasite genotype can infect a restricted number of host genotypes) and a failed infection results in parasite death10–18; assumptions that hold for CRISPR-Cas-virus interactions. While the protective effect of host diversity may be lost following the evolution of single viruses that escape from multiple spacers10,17, host diversity has the additional benefit of limiting such viral adaptation. Specifically, lower virus population sizes resulting from host diversity11,12 reduces the probability of escape mutations, and the greater the diversity the more escape mutations needed.
To examine these hypotheses, we generated bacterial populations in which we manipulated the level of spacer diversity; we used 48 individual clones with CRISPR-based immunity against virus DMS3vir to generate bacterial populations with five distinct diversity levels: monocultures or polycultures consisting of equal mixtures of either 6, 12, 24 or 48 clones. To allow for direct comparisons, each of the 48 clones was equally represented at each diversity level by adjusting the number of replicate experiments accordingly. Each population was competed against a previously described surface mutant6 in the presence or absence of virus DMS3vir and virus levels were monitored over time.
This experiment revealed a strong inverse relationship between virus persistence and the level of spacer diversity in the bacterial population (Fig. 2). Virus titres remained high in 44 out of 48 replicates when the CRISPR population consisted of a monoculture (Fig. 2a). However, as diversity increased, virus persistence decreased (Fig. 2b–e) and virus was driven extinct rapidly and reproducibly when the CRISPR population consisted of a 48-clone mixture (Fig. 2e).
Figure 2. Virus persistence inversely correlates with the level of spacer diversity.

a–e, Virus titres (in plaque-forming units per millilitre) over time upon infection of a bacterial population consisting of an equal mixture of a surface mutant and a monoculture with CRISPR-mediated immunity (a; n = 48), or polycultures with CRISPR-mediated immunity consisting of 6 clones (b; n = 8), 12 clones (c; n = 8), 24 clones (d; n =6), 48 clones (e; n = 6). The number of replicates is chosen such that all clones are equally represented in each treatment. Each line indicates a biological replicate experiment; in all cases n is the number of biological replicates. The limit of detection is 200 p.f.u. ml−1.
Next, we examined the fitness consequences of generating spacer diversity. In the absence of virus there was no significant effect of diversity on the relative fitness associated with CRISPR-Cas compared with a resistant surface mutant (Extended Data Fig. 1b; F1,52 =3.20, P =0.08). However, in the presence of virus, CRISPR-associated fitness increased with increasing spacer diversity (Fig. 3; F4,71 =40.30, P <0.0001 and Extended Data Table 1), with mean fitness increasing 11-fold from monoculture to the highest diversity population. In monoculture, the CRISPR population was outcompeted by the surface mutant (relative fitness <1; T =−11.68, P < 0.0001). However, as diversity increased, the CRISPR population consistently outcompeted the surface mutant (relative fitness >1; 6 clones: T =3.05, P = 0.0093; 12 clones: T =3.95, P = 0.0028; 24 clones: T =3.48, P = 0.0088; 48 clones: T =3.06, P = 0.014; all significant after sequential Bonferroni correction19), showing that the generation of spacer diversity is an important fitness determinant of CRISPR-Cas (Fig. 3).
Figure 3. The benefit of CRISPR immunity increases with increasing spacer diversity.
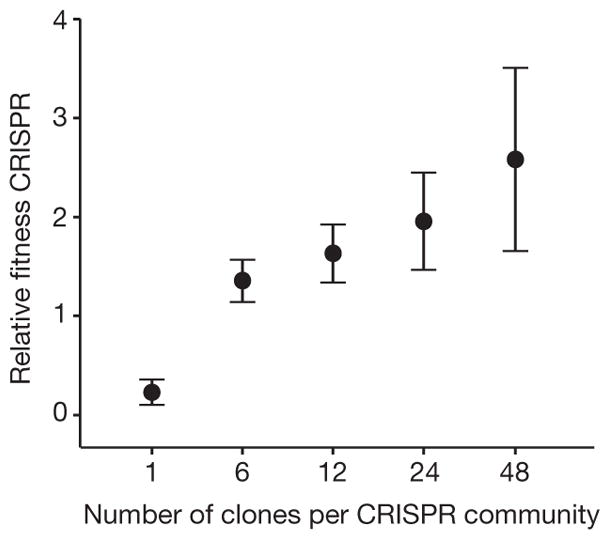
Relative fitness of bacterial populations with CRISPR-mediated immunity, with spacer diversity as indicated, at 3 d.p.i. when competing with a surface mutant. Error bars, 95% CI. In all cases, the number of biological replicates equals the n values given in the legend of Fig. 2.
Given that all bacterial clones used in the experiment were initially resistant, we hypothesized that the benefit of spacer diversity emerges from an inability of virus to evolve escape mutants. To examine this, virus isolated from each time point (0, 16, 24, 40, 48, 64 and 72 hours post-infection (h.p.i.)) was spotted onto lawns of each of the 48 CRISPR clones. As expected, we could not detect escape virus in the ancestral virus (Fig. 4a; left column, indicated in green). However, in 43 of the 48 CRISPR monocultures, virus evolved within 2 days to overcome CRISPR immunity (Fig. 4a, indicated in red). For five clones no escape virus could be detected, and virus became extinct in four of these instances (Fig. 4a, asterisks). Three of these five clones carried multiple spacers targeting the virus, which limits the emergence of escape virus16. The emergence of escape virus decreased as diversity increased to 6, 12, 24 and 48 CRISPR alleles (Fig. 4); in the last two, no escape virus could be detected. These phenotypic data were supported by results of deep sequencing of virus genotypes isolated from 1 d.p.i.: there was a significant inverse relationship between host diversity and the accumulation of viral mutations in the target sequences (Extended Data Fig. 1c, d). This is because virus needs to overcome multiple spacers in the diverse host population if it is to increase in frequency (Extended Data Fig. 1e, f). Consistent with a lack of escape virus emerging against all host genotypes, the spacer content of mixed populations of 6, 12, 24 and 48 clones did not increase between t =0 and t = 3 d.p.i. (Wilcoxon signed rank P > 0.2 for all treatments), whereas monocultures acquired novel spacers in response to emerging escape virus (Wilcoxon signed rank W =333, d.f.=47, P <0.0001; Extended Data Fig. 1g). These data show that although escape viruses can clearly evolve against most of the clones, they do not emerge when these clones are mixed.
Figure 4. Evolution of virus infectivity is constrained by spacer diversity.

Emergence of virus that overcomes host CRISPR immunity (escape virus) during the experiment shown in Fig. 2 (a–e correspond to Fig. 2a–e). Table columns correspond to time points where virus was isolated (0, 16, 24, 40, 48, 64 and 72 h.p.i.; indicated below the table in days post-infection). Green, no escape virus; red, escape virus. Bold numbers indicate individual biological replicates, as detailed in the legend of Fig. 2. In b–e replicates are separated by bold lines in the table. Numbers between parentheses refer to the clones in the CRISPR population. Asterisks indicate virus extinction.
We hypothesized that the benefit of within-population spacer diversity is due to synergy between the different clones. However, diversity will also increase the chance that the population will contain a single clone with one or more spacers that the virus is unable to overcome. Indeed, we observed five clones against which escape virus mutants were never detected, and presence of these clones in many of the diverse populations could explain the fitness advantage of diversity. To investigate if synergy plays an important role in the benefit of diversity beyond this ‘jackpot’ effect, we compared the fitness of diverse populations with the fitness of the fittest constituent clone, as measured in monoculture. This analysis revealed that synergism contributed an approximately 50% growth rate advantage when in competition with surface mutants (mean ± s.e.m. difference in fitness between mixtures and fittest constituent monoculture =0.47±0.18; P <0.01).
The short-lived nature of coevolution between CRISPR-resistant bacteria and virus escape mutants beyond a host diversity threshold may explain the evolution of sophisticated anti-CRISPR mechanisms to overcome CRISPR-Cas7. Indeed, the same DMS3vir virus carrying an anti-CRISPR gene7 was found to persist independent of CRISPR diversity levels (Extended Data Fig. 1h, i) and caused similar extinction of CRISPR-resistant monocultures and 48-clone populations that competed against a surface mutant (Fisher’s exact test, P =1.0 at t =1 d.p.i., P =0.33 at t = 3 d.p.i.; Extended Data Fig. 1j).
Finally, to test that our results were not limited to the P. aeruginosa PA14 type I-F CRISPR-Cas system, we performed a similar experiment with Streptococcus thermophilus DGCC7710 clones that evolved resistance against virus 2972 using a type II-A CRISPR-Cas system. As shown in Extended Data Fig. 2, we found a similar effect of CRISPR resistance allele diversity on virus persistence and escape virus emergence. However, during coevolution experiments the levels of evolved spacer diversity are lower in S. thermophilus (data not shown and refs 4, 5), which, consistent with theory10,17, allows for more persistent coevolution4,5. Lower levels of evolved spacer diversity might be due to a more weakly primed CRISPR-Cas system20–22.
Collectively, our data demonstrate that the propensity to generate host genetic diversity is a key fitness determinant of CRISPR-Cas adaptive immune systems because it limits the emergence of escape virus. Consistent with the idea that it is harder for a parasite to adapt to a heterogeneous host population23, virus rapidly evolved high levels of infectivity on monocultures, but not on a diverse mix of the same host genotypes. Parasites are often invoked as the selective force driving the evolution of diversity generating mechanisms23–26. In most cases, individual-level selection is assumed to be the driver of these traits, because individual benefits are high, and group selective benefits would be opposed by the invasion of individuals who do not pay the fitness costs associated with these mechanisms (for example, sex and increased mutation rates)26–28. In the case of CRISPR-Cas, we speculate that population-level selection may have contributed to its evolution. First, there were large benefits associated with synergy between diverse genotypes. Second, costs of CRISPR-Cas are conditional on virus exposure6,29, and clones lacking CRISPR immunity cannot invade populations (Extended Data Figs 3 and 4). Third, the highly structured nature of bacterial populations, and the resulting high relatedness, promotes between-population selection30. Future tests of this hypothesis are needed to reconcile the selective forces that have shaped the evolution of CRISPR-Cas systems.
METHODS
The experiments were not randomized. The investigators were not blinded to allocation during experiments and outcome assessment.
Bacterial strains and viruses
P. aeruginosa UCBPP-PA14 (WT), P. aeruginosa UCBPP-PA14 csy3::LacZ (referred to as CRISPR KO, which carries a disruption of an essential cas gene and can therefore not evolve CRISPR immunity), the CRISPR- KO-derived surface mutant and virus DMS3vir have all been described in ref. 6 and references therein. Phage DMS3vir+acrF1, which carries the anti-CRISPR gene acrF1 (formerly 30–35), was made by inserting acrF1 into the DMS3vir genome using methods described in ref. 7. S. thermophilus strain DGCC7710 and its virus 2972 have been described in ref. 2.
Coevolution experiments
The coevolution experiments shown in Fig. 1 were performed in glass microcosms by inoculating 6 ml M9 supplemented with 0.2% glucose with approximately 106 colony-forming units of bacteria from fresh overnight cultures of the wild-type P. aeruginosa UCBPP-PA14 or CRISPR KO strain and adding 104 p.f.u. of virus DMS3vir, followed by incubation at 37 °C while shaking at 180 r.p.m. (six replicates). Cultures were transferred daily 1:100 to fresh broth. Virus titres were determined at 0, 3, 5, 11, 17, 22 and 30 days after the start of the coevolution experiment by spotting virus samples isolated by chloroform extraction on a lawn of CRISPR KO bacteria. The analysis of virus immunity was performed by cross-streak assay and PCR as described previously6.
Generation of populations with different levels of CRISPR diversity
For the competition experiments, shown in Figs 2–4 and Extended Data Figs 1b–j, 3 and 4, we generated P. aeruginosa populations with varying levels of CRISPR spacer (allele) diversity. To this end, we isolated from the six replicates of the coevolution experiment (Fig. 1) a total of 48 individual clones that had acquired CRISPR immunity against virus DMS3vir. We have previously shown that individual clones tend to have unique spacers6. Using these 48 clones, populations with five different levels of CRISPR spacer (allele) diversity were generated. These populations consisted of (1) 1 clone (a monoculture; a clonal population carrying a single spacer); equal mixtures of (2) 6 clones; (3) 12 clones; (4) 24 clones and (5) 48 clones. In total, 48 different monocultures (48 × monocultures), 8× 6-clone populations, 4 × 12-clone populations, 2 × 24-clone populations and 1 × 48-clone population were generated (details of the composition of each population can be found below, in the section ‘Number of replicate experiments’).
Competition experiments
Competition experiments were done in glass microcosms in a total volume of 6 ml M9 supplemented with 0.2% glucose. Competition experiments were initiated by inoculating 1:100 from a 1:1 mixture (in M9 salts) of overnight cultures of the appropriate CRISPR population and either the surface mutant (Figs 2–4 and Extended Data Fig. 1b–j) or the CRISPR KO strain (Extended Data Figs 3 and 4). At the start of each experiment 109 p.f.u. of virus was added, unless indicated otherwise. Cultures were transferred daily 1:100 into fresh broth. At 0 and 72 h.p.i. samples were taken and cells were serially diluted in M9 salts and plated on LB agar supplemented with 50 μgml−1 X-gal (to allow discrimination between wild-type-derived CRISPR clones (white) and CRISPR KO or surface mutant (blue)). The relative frequencies of the wild-type strain were used to calculate the relative fitness (relative fitness = [(fraction strain A at t =x) × (1 − (fraction strain A at t = 0))]/[(fraction strain A at t =0) × (1 − (fraction strain A at t =x)]). At 0, 16, 24, 40, 48, 66 and 72 h.p.i., samples were taken and chloroform extractions were performed to isolate total virus, which was spotted on a lawn of CRISPR KO bacteria for quantification. All subsequent statistical analyses were performed using JMP (version 12) software.
Determination of escape virus emergence
To determine the emergence of escape virus during the competition experiments, every isolated virus sample was spotted onto 48 different bacterial lawns, corresponding to each of the different CRISPR clones. This procedure was done for each of the seven time points (see above), to enable us to track the emergence of escape virus against every individual clone over the time course of the experiment.
Deep sequencing
Isolated phage samples from t = 1 d.p.i. of the competition experiment shown in Figs 2–4 were used to perform deep sequencing of spacer target sites on the phage genomes. To obtain sufficient material, phage were amplified by plaque assay on the CRISPR KO strain. Viruses from all replicates within a single diversity treatment were pooled. As a control, ancestral virus and escape virus from competition between surface mutant and monocultures of CRISPR clones 1–3 were processed in parallel. Virus genomic DNA extraction was performed from 5 ml sample at approximately 1010 p.f.u. ml−1 using the Norgen phage DNA isolation kit, following the manufacturer’s instructions. Barcoded Illumina Truseq Nano libraries were constructed from each DNA sample with an approximately 350 bp insert size and 2 × 250 bp reads generated on an Illumina MiSeq platform. Reads were trimmed using Cutadapt version 1.2.1 and Sickle version 1.200 and then overlapping reads merged using Flash version 1.2.8 to create high quality sequence at approximately 8,000× coverage of DMS3vir per sample. These reads were mapped to PA14 and DMS3vir genomes using bwa mem version 0.7.12 and allele frequencies of single nucleotide polymorphisms within viral target regions quantified using samtools mpileup version 0.1.18. Further statistical analyses was performed in R version 3.2.2. Sequence data are available from the European Nucleotide Archive under accession number PRJEB12001 and analysis scripts are available from https://github.com/scottishwormboy/vanHoute.
Determining the acquisition of new spacers
To examine spacer acquisition during the competition experiments shown in Figs 2–4, we examined by PCR for each diversity treatment the spacer content of 384 randomly isolated clones at both t =0 and t = 3 (192 clones per time point). For each replicate experiment, the difference in the total number of spacers between t =0 and t = 3 was divided by the number of clones that were examined to calculate the average change in the number of spacers per clone.
Number of replicate experiments
To ensure equal representation of each of the 48 clones across the different treatments, the number of replicate experiments for a given diversity treatment was adjusted accordingly, with a total number of replicates of at least six for sufficient statistical power. Hence, competition experiments with the one-clone (monoculture) populations were performed in 48 independent replicates, each corresponding to a unique monoculture of a CRISPR clone (clones 1–48; each clone is equally represented). Competition experiments with the 6-clone populations were performed in eight independent replicates, each corresponding to a unique polyculture population (population 1: equal mixture of clones 1–6; population 2: clones 7–12; population 3: clones 13–18; population 4: clones 19–24; population 5: clones 25–30; population 6: clones 31–36; population 7: clones 37–42; population 8: clones 43–48). Competition experiments with the 12-clone populations were also performed in eight replicates, corresponding to four unique polyculture populations (replicate 1 and 2: clones 1–12; replicate 3 and 4: clones 13–24; replicate 5 and 6: clones 25–36; replicate 7 and 8: clones 37–48). Competition experiments with the 24-clone populations were performed in six replicates, corresponding to two unique polyculture populations (replicate 1–3: clones 1–24; replicate 4–6: clones 25–48). Competition experiments with the 48-clone populations were performed in six replicates, each corresponding to the same polyculture population (replicate 1–6: clones 1–48).
Escape phage degradation and fitness
In the experiment shown in Extended Data Fig. 1e, f, approximately 108 p.f.u. of either ancestral virus or escape virus, which was isolated from the competitions between monocultures 1–6 and the surface mutant, were used to infect a monoculture of the corresponding CRISPR clone or the 48-clone polyculture. Phage samples were taken at 0, 9, 20 and 28 h.p.i. by chloroform extraction and titrated on a lawn of the CRISPR KO strain. Fitness of each of the escape phages was determined by a competition experiment between ancestral and escape virus; a 50:50 ratio of escape and ancestral phage (109 p.f.u. total) was used to infect either a monoculture of the corresponding CRISPR clone or the 48-clone polyculture. Virus samples were taken at t =0 and t =20h.p.i. by chloroform extraction and used in a plaque assay on CRISPR KO. Next, individual plaques (48 plaques per replicate) were isolated and amplified on the CRISPR KO strain. To determine the ratio of escape and ancestral virus, virus from each individual plaque was spotted on a lawn of (1) CRISPR KO (both ancestral and escape virus form plaques) and (2) the corresponding CRISPR immune clone (only escape virus can form a plaque).
Effect of spacer diversity in S. thermophilus
S. thermophilus DGCC7710 was grown in M17 medium supplemented with 0.5% α-lactose (LM17) at 42 °C. Virus 2972 was used throughout the experiments. Virus infections were performed using 106 p.f.u. of phage 2972 and 10 mM CaCl2 to facilitate the infection process. To obtain virus-resistant S. thermophilus clones, a sample of virus lysate at 24 h.p.i. was plated on LM17 agar plates. Individual colonies were picked and PCR-screened for the acquisition of novel spacers in each of the four CRISPR loci, as described in ref. 2. A total of 44 individual clones with a novel spacer in CRISPR1 (see ref. 16 and references therein) were selected to generate 44 monocultures and a single polyculture comprising a mix of 44 clones. These cultures were infected with 107 p.f.u. of virus, and samples were taken after the indicated periods of time to isolate virus. We determined virus titres by spotting viral dilutions on lawns of ancestral bacteria, and the emergence of escape virus by spotting virus on lawns corresponding to each of the 44 CRISPR-resistant clones.
Extended Data
Extended Data Figure 1. CRISPR diversity drives virus extinct since virus cannot escape by point mutation.

a, Percentage bacteria (WT or CRISPR KO) from the experiment shown in Fig. 1 that have evolved CRISPR immunity (white bar), surface immunity (black bar) or remained sensitive (sensitive; grey bars) at 5 d.p.i. with virus DMS3vir (n = 6 for both treatments). b, Relative fitness of CRISPR immune monocultures (single spacer; low diversity, n = 48) and polycultures (48 spacers; high diversity, n = 6) at 3 d.p.i. when competing with a surface mutant (sm) in the absence of virus. c, d, Deep sequencing analysis of the frequency of mutations in the seed region and PAM of the target sequence of virus isolated at t = 1 d.p.i. from the experiment shown in Fig. 4. c, Frequency of point mutation in the target sequence of viral populations isolated from monoculture 1–3 × surface mutant competitions. d, Average frequency of point mutation across all target sites in the ancestral virus genome and in the genomes of virus from pooled samples of all biological replicates from a single diversity treatment (monocultures: n =48; 6-clone: n =8; 12-clone: n =8; 24-clone: n =6; 48-clone: n =6). e, f, Virus that escapes a single spacer present in a diverse CRISPR population decreases in frequency, despite a fitness benefit over ancestral virus. e, Titres (in plaque-forming units per millilitre) over time upon infection of monocultures (dotted line) or polycultures of 48 clones (solid line) with approximately 108 p.f.u. ancestral (closed circles) or escape (open circles) virus. Escape virus was isolated from monocultures 1–6 × surface mutant competitions shown in Figs 2–4, at 24 h.p.i. n =6 for all experiments. The limit of detection is 200 p.f.u. ml−1. f, Relative fitness of escape virus at t = 1 d.p.i. when competing with ancestral virus on CRISPR-resistant monocultures or polycultures consisting of 48 clones. n = 6 for both experiments. g, For each diversity treatment shown in Figs 2–4 we examined the spacer content of 192 randomly isolated clones at both t =0 and t = 3 d.p.i. (384 clones in total per diversity treatment). The change in the total number of spacers between t =0 and t =3 d.p.i was calculated independently for each replicate experiment (number of biological replicates as indicated in legend of Fig. 2) and divided by the number of clones that were examined. The graph indicates the average across the replicates of the change in spacer content per clone. h, i, Titres (in plaque-forming units per millilitre) over time of virus carrying an anti-CRISPR gene (DMS3vir+acrF1) following infection of a bacterial population consisting of an equal mixture of a surface mutant and a monoculture with CRISPR-mediated immunity (h; n =48) or a 48-clone polyculture with CRISPR-mediated immunity (i; n =6). Each clone is equally represented in each treatment. Each line indicates a biological replicate experiment. The limit of detection is 200 p.f.u. ml−1. j, The number of replicate experiments in which the CRISPR immune population went extinct (no detectable white colonies) at 1 and 3 d.p.i. In all cases, n is the number of biological replicates and error bars represent 95% CI.
Extended Data Figure 2. Virus persistence inversely correlates with the level of CRISPR spacer diversity in CRISPR immune populations of S. thermophilus.

a, b, Virus titres (in plaque-forming units per millilitre) over time upon infection of a bacterial population consisting of a monoculture with CRISPR-mediated immunity (a; n =44 biological replicates) or 44-clone polycultures with CRISPR-mediated immunity (b; n = 28 biological replicates). Each clone is equally represented in each treatment. Each line indicates a biological replicate experiment. The limit of detection is 200 p.f.u. ml−1. c, Absorbance at 600 nm of monocultures and polycultures at 16 and 40 h.p.i. Error bars, 95% CI. d, Emergence of virus mutants that overcome CRISPR-mediated immunity after 0, 16, 24, 40 and 48 h.p.i. Green indicates no escape virus. Red indicates emergence of escape virus. Escape virus emerged in none of the 28 biological replicates of the polyculture experiments.
Extended Data Figure 3. Sensitive bacteria are unable to invade bacterial populations with CRISPR-mediated immunity in the presence of virus.

a–e, Virus titres (in plaque-forming units per millilitre) over time upon infection of a bacterial population consisting of an equal mixture of a sensitive CRISPR KO clone and a monoculture with CRISPR-mediated immunity (a; n = 48), or polycultures with CRISPR-mediated immunity consisting of 6 clones (b; n = 8), 12 clones (c; n = 8), 24 clones (d; n =6) and 48 clones (e; n = 6). The number of replicates is chosen such that all clones are equally represented in each treatment. Each line indicates a biological replicate experiment. The limit of detection is 200 p.f.u. ml−1. f, Relative fitness of CRISPR populations at 3 d.p.i. during the competitions with the sensitive CRISPR KO described in a–e. Relative fitness of CRISPR populations decreases with increasing spacer diversity due to the rapid virus extinction, which benefits sensitive bacteria, but is higher than 1 in all cases. Error bars, 95% CI. g, Relative fitness of monoculture (single spacer; low diversity, n = 48) and polyculture (48 spacers; high diversity, n = 6) at 3 d.p.i. when competing with the CRISPR KO strain in the absence of virus. Error bars, 95% CI. In all cases n is the number of biological replicates.
Extended Data Figure 4. Evolution of virus infectivity is constrained by CRISPR diversity when CRISPR immune populations compete with sensitive CRISPR KO bacteria.

Emergence of virus mutants that overcome CRISPR-mediated immunity during the experiment shown in Extended Data Fig. 3. Each column in a table represents a time point (0, 16, 24, 40, 48, 64 and 72 h.p.i., as indicated below the table (in days post-infection)) where virus was isolated. Green indicates no escape virus. Red indicates emergence of escape virus. Panels a–e correspond to each of the experiments shown in Extended Data Fig. 3a–e. Bold numbers indicate each of the individual biological replicates, as detailed in the legend of Extended Data Fig. 3. In b–e, individual replicates are separated by bold lines. Numbers between parentheses indicate the identity of clones that are present in a population with CRISPR-mediated immunity. Asterisks indicate replicate experiments where virus went extinct during the experiment.
Extended Data Table 1.
Tukey’s honest significant difference test of all pairwise comparisons of the data in Fig. 3
| Comparison | Difference | Std Error | t Ratio | Prob>|t| | Lower 95% | Upper 95% | |
|---|---|---|---|---|---|---|---|
| 1 | 6 | −1.12680 | 0.2141986 | −5.26 | <.0001* | −1.72637 | −0.52724 |
| 1 | 12 | −1.40303 | 0.2141986 | −6.55 | <.0001* | −2.00259 | −0.80346 |
| 1 | 24 | −1.72790 | 0.2428783 | −7.11 | <.0001* | −2.40775 | −1.04806 |
| 1 | 48 | −2.35252 | 0.2428783 | −9.69 | <.0001* | −3.03236 | −1.67267 |
| 6 | 12 | −0.27622 | 0.2804518 | −0.98 | 0.8612 | −1.06124 | 0.50879 |
| 6 | 24 | −0.60110 | 0.3029225 | −1.98 | 0.2842 | −1.44901 | 0.24682 |
| 6 | 48 | −1.22571 | 0.3029225 | −4.05 | 0.0012* | −2.07363 | −0.37780 |
| 12 | 24 | −0.32488 | 0.3029225 | −1.07 | 0.8200 | −1.17279 | 0.52304 |
| 12 | 48 | −0.94949 | 0.3029225 | −3.13 | 0.0205* | −1.79741 | −0.10158 |
| 24 | 48 | −0.62462 | 0.3238378 | −1.93 | 0.3119 | −1.53108 | 0.28184 |
1, Monoculture; 6, 6-clone polyculture; 12, 12-clone polyculture; 24, 24-clone polyculture; 48, 48-clone polyculture.
Acknowledgments
We thank D. Morley and S. Kay for experimental contributions and A. Gardner for comments on the manuscript. S.v.H. has received funding from the European Union’s Horizon 2020 research and innovation programme under the Marie Skłodowska-Curie grant agreement number 660039. E.R.W. received funding from the People Programme (Marie Curie Actions) of the European Union’s Seventh Framework Programme (FP7/2007-2013) under Research Executive Agency grant agreement number 327606. E.R.W., A.B. and M.B. also acknowledge the Natural Environment Research Council, the Biotechnology and Biological Sciences Research Council, the Royal Society, the Leverhulme Trust, the Wellcome Trust and the AXA research fund for funding. J.M.B.-D. was supported by the University of California San Francisco Program for Breakthrough in Biomedical Research, the Sandler Foundation, and a National Institutes of Health Director’s Early Independence Award (DP5-OD021344). H.C. was funded by the Erasmus+ programme (European Union), the Explora’Sup programme (Région Rhône-Alpes) and the Centre Régional des Œuvres Universitaires et Scolaires (CROUS; French State).
Footnotes
Online Content Methods, along with any additional Extended Data display items and Source Data, are available in the online version of the paper; references unique to these sections appear only in the online paper.
Author Contributions E.R.W., A.B. and S.v.H. conceived and designed the experiments. H.C. performed coevolution experiments. S.v.H., E.R.W., A.K.E.E. and J.M.B. performed all competition experiments and associated analysis of virus persistence and host and virus evolution. S.P. performed and analysed deep sequencing of virus genomes. J.B.-D. supplied virus with anti-CRISPR gene. B.A. and M.B. contributed to discussions and provided feedback throughout the project. S.G. and H.C. helped to set up the experiments with S. thermophilus. S.v.H., E.R.W. and A.B. wrote the manuscript.
Sequence data are available from the European Nucleotide Archive under accession number PRJEB12001 and analysis scripts are available from https://github.com/scottishwormboy/vanHoute.
The authors declare no competing financial interests.
Readers are welcome to comment on the online version of the paper.
References
- 1.van der Oost J, Westra ER, Jackson RN, Wiedenheft B. Unravelling the structural and mechanistic basis of CRISPR-Cas systems. Nature Rev Microbiol. 2014;12:479–492. doi: 10.1038/nrmicro3279. [DOI] [PMC free article] [PubMed] [Google Scholar]
- 2.Barrangou R, et al. CRISPR provides acquired resistance against viruses in prokaryotes. Science. 2007;315:1709–1712. doi: 10.1126/science.1138140. [DOI] [PubMed] [Google Scholar]
- 3.Andersson AF, Banfield J. Virus population dynamics and acquired virus resistance in natural microbial communities. Science. 2008;320:1047–1050. doi: 10.1126/science.1157358. [DOI] [PubMed] [Google Scholar]
- 4.Paez-Espino D, et al. Strong bias in bacterial CRISPR elements that confer immunity to phage. Nature Commun. 2013;4:1430. doi: 10.1038/ncomms2440. [DOI] [PubMed] [Google Scholar]
- 5.Paez-Espino D, et al. CRISPR immunity drives rapid phage genome evolution in Streptococcus thermophilus. MBio. 2015;6:e00262–e15. doi: 10.1128/mBio.00262-15. [DOI] [PMC free article] [PubMed] [Google Scholar]
- 6.Westra ER, et al. Parasite exposure drives selective evolution of constitutive versus inducible defense. Curr Biol. 2015;25:1043–1049. doi: 10.1016/j.cub.2015.01.065. [DOI] [PubMed] [Google Scholar]
- 7.Bondy-Denomy J, Pawluk A, Maxwell KL, Davidson AR. Bacteriophage genes that inactivate the CRISPR/Cas bacterial immune system. Nature. 2013;493:429–432. doi: 10.1038/nature11723. [DOI] [PMC free article] [PubMed] [Google Scholar]
- 8.Deveau H, et al. Phage response to CRISPR-encoded resistance in Streptococcus thermophilus. J Bacteriol. 2008;190:1390–1400. doi: 10.1128/JB.01412-07. [DOI] [PMC free article] [PubMed] [Google Scholar]
- 9.Semenova E, et al. Interference by clustered regularly interspaced short palindromic repeats (CRISPR) RNA is governed by a seed sequence. Proc Natl Acad Sci USA. 2011;108:10098–10103. doi: 10.1073/pnas.1104144108. [DOI] [PMC free article] [PubMed] [Google Scholar]
- 10.Childs LM, England WE, Young MJ, Weitz JS, Whitaker RJ. CRISPR-induced distributed immunity in microbial populations. PLoS ONE. 2014;9:e101710. doi: 10.1371/journal.pone.0101710. [DOI] [PMC free article] [PubMed] [Google Scholar]
- 11.Lively CM. The effect of host genetic diversity on disease spread. Am Nat. 2010;175:E149–E152. doi: 10.1086/652430. [DOI] [PubMed] [Google Scholar]
- 12.King KC, Lively CM. Does genetic diversity limit disease spread in natural populations? Heredity. 2012;109:199–203. doi: 10.1038/hdy.2012.33. [DOI] [PMC free article] [PubMed] [Google Scholar]
- 13.Van Baalen M, Beekman M. The costs and benefits of genetic heterogeneity in resistance against parasites in social insects. Am Nat. 2006;167:568–577. doi: 10.1086/501169. [DOI] [PubMed] [Google Scholar]
- 14.Altermatt F, Ebert D. Genetic diversity of Daphnia magna populations enhances resistance to parasites. Ecol Lett. 2008;11:918–928. doi: 10.1111/j.1461-0248.2008.01203.x. [DOI] [PubMed] [Google Scholar]
- 15.Schmid-Hempel P, Crozier RH. Polygyny versus polyandry versus parasites. Phil Trans R Soc Lond B. 1999;354:507–515. [Google Scholar]
- 16.Levin BR, Moineau S, Bushman M, Barrangou R. The population and evolutionary dynamics of phage and bacteria with CRISPR immunity. PLoS Genet. 2013;9:e1003312. doi: 10.1371/journal.pgen.1003312. [DOI] [PMC free article] [PubMed] [Google Scholar]
- 17.Iranzo J, Lobkovsky AE, Wolf YI, Koonin EV. Evolutionary dynamics of the prokaryotic adaptive immune system CRISPR-Cas in an explicit ecological context. J Bacteriol. 2013;195:3834–3844. doi: 10.1128/JB.00412-13. [DOI] [PMC free article] [PubMed] [Google Scholar]
- 18.Keesing F, et al. Impacts of biodiversity on the emergence and transmission of infectious diseases. Nature. 2010;468:647–652. doi: 10.1038/nature09575. [DOI] [PMC free article] [PubMed] [Google Scholar]
- 19.Rice WR. Analyzing tables of statistical tests. Evolution. 1989;43:223–225. doi: 10.1111/j.1558-5646.1989.tb04220.x. [DOI] [PubMed] [Google Scholar]
- 20.Datsenko KA, et al. Molecular memory of prior infections activates the CRISPR/Cas adaptive bacterial immunity system. Nature Commun. 2012;3:945. doi: 10.1038/ncomms1937. [DOI] [PubMed] [Google Scholar]
- 21.Swarts DC, Mosterd C, van Passel MW, Brouns SJ. CRISPR interference directs strand specific spacer acquisition. PLoS ONE. 2012;7:e35888. doi: 10.1371/journal.pone.0035888. [DOI] [PMC free article] [PubMed] [Google Scholar]
- 22.Fineran PC, et al. Degenerate target sites mediate rapid primed CRISPR adaptation. Proc Natl Acad Sci USA. 2014;111:E1629–E1638. doi: 10.1073/pnas.1400071111. [DOI] [PMC free article] [PubMed] [Google Scholar]
- 23.Hamilton WD, Axelrod R, Tanese R. Sexual reproduction as an adaptation to resist parasites (a review) Proc Natl Acad Sci USA. 1990;87:3566–3573. doi: 10.1073/pnas.87.9.3566. [DOI] [PMC free article] [PubMed] [Google Scholar]
- 24.Pal C, Maciá MD, Oliver A, Schachar I, Buckling A. Coevolution with viruses drives the evolution of bacterial mutation rates. Nature. 2007;450:1079–1081. doi: 10.1038/nature06350. [DOI] [PubMed] [Google Scholar]
- 25.Morran LT, Schmidt OG, Gelarden IA, Parrish RC, II, Lively CM. Running with the red queen: host-parasite coevolution selects for biparental sex. Science. 2011;333:216–218. doi: 10.1126/science.1206360. [DOI] [PMC free article] [PubMed] [Google Scholar]
- 26.Ashby B, King KC. Diversity and the maintenance of sex by parasites. J Evol Biol. 2015;28:511–520. doi: 10.1111/jeb.12590. [DOI] [PubMed] [Google Scholar]
- 27.Lively CM. An epidemiological model of host–parasite coevolution and sex. J Evol Biol. 2010;23:1490–1497. doi: 10.1111/j.1420-9101.2010.02017.x. [DOI] [PubMed] [Google Scholar]
- 28.Peters AD, Lively C. The Red Queen and fluctuating epistasis: a population genetic analysis of antagonistic coevolution. Am Nat. 1999;154:393–405. doi: 10.1086/303247. [DOI] [PubMed] [Google Scholar]
- 29.Vale PF, et al. Costs of CRISPR-Cas-mediated resistance in Streptococcus thermophilus. Proc R Soc B. 2015;282:20151270. doi: 10.1098/rspb.2015.1270. [DOI] [PMC free article] [PubMed] [Google Scholar]
- 30.Gardner A, Grafen A. Capturing the superorganism: a formal theory of group adaptation. J Evol Biol. 2009;22:659–671. doi: 10.1111/j.1420-9101.2008.01681.x. [DOI] [PubMed] [Google Scholar]