Abstract
The gene that encodes C1q/TNF-related protein 5 (CTRP5), a secreted protein of the C1q family, is mutated in individuals with late-onset retinal degeneration. CTRP5 is widely expressed outside the eye and also circulates in plasma. Its physiological role in peripheral tissues, however, has yet to be elucidated. Here, we show that Ctrp5 expression is modulated by fasting and refeeding, and by different diets, in mice. Adipose expression of CTRP5 was markedly upregulated in obese and diabetic humans and in genetic and dietary models of obesity in rodents. Furthermore, human CTRP5 expression in the subcutaneous fat depot positively correlated with BMI. A genetic loss-of-function mouse model was used to address the metabolic function of CTRP5 in vivo. On a standard chow diet, CTRP5-deficient mice had reduced fasting insulin but were otherwise comparable with wild-type littermate controls in body weight and adiposity. However, when fed a high-fat diet, CTRP5-deficient animals had attenuated hepatic steatosis and improved insulin action. Loss of CTRP5 also improved the capacity of chow-fed aged mice to respond to subsequent high-fat feeding, as evidenced by decreased insulin resistance. In cultured adipocytes and myotubes, recombinant CTRP5 treatment attenuated insulin-stimulated Akt phosphorylation. Our results provide the first genetic and physiological evidence for CTRP5 as a negative regulator of glucose metabolism and insulin sensitivity. Inhibition of CTRP5 action may result in the alleviation of insulin resistance associated with obesity and diabetes.
Keywords: obesity, diabetes, adipokine, C1q/TNF-related protein 5, insulin sensitivity, C1QTNF5
c1q/tnf-related proteins (CTRP1-15) are a highly conserved family of secreted plasma proteins with a shared signature C1q globular domain (46, 62). They are widely expressed in human and mouse tissues and have important metabolic functions (36–39, 44, 45, 56–62). CTRP5 is expressed by a variety of tissues, including the adipose tissue (42, 61) and retinal pigment epithelium and ciliary body of the eye (30); interestingly, an autosomal dominant missense mutation (S163R) in the CTRP5/C1QTNF5 gene causes late onset retinal degeneration (L-ORD) in humans (2, 16, 50, 51, 55). Functional and structural studies have revealed that Ser163 plays a critical role in the protein's structural integrity, as mutation of this residue promotes protein aggregation and impairs the secretion and assembly of CTRP5 into proper higher-order oligomeric structures important for its biological function (2, 12, 16, 30, 48, 49, 54). Two targeted Ctrp5 S163R knockin mutant mouse models have been generated to model the human disease. Whereas one S163R knockin mouse model on a C57BL/6J genetic background recapitulates the phenotypes of human L-ORD (9), another knockin mouse model with a mixed genetic background (C57BL/6J X 129SV) lacks discernable retinal defects (47).
CTRP5 is detected beyond the visual system in peripheral tissues such as adipose tissue. Its function in the periphery, however, remains uncertain. Several recent studies suggest a metabolic role for CTRP5. Notably, serum CTRP5 levels are higher in genetic models of obesity and diabetes (ob/ob and db/db mice, OLETF rat) (35). In obese Pima Indians, the expression of CTRP5 transcript is upregulated in isolated subcutaneous adipocytes relative to lean controls (28). In healthy female volunteers, serum CTRP5 levels decreased after a 10-wk aerobic exercise regimen and were positively correlated with insulin resistance index (HOMA-IR) (29). However, in a different study involving a larger cohort of nondiabetic male and female volunteers, combined aerobic and resistance exercise for 12 wk modestly increased serum CTRP5 levels (10). In cultured myocytes, CTRP5 expression and secretion are increased when mitochondrial DNA is depleted, and recombinant CTRP5 treatment appears to enhance fatty acid oxidation (35). In cultured adipocytes, recombinant CTRP5 treatment also inhibits the secretion of adipokines such as resistin and adiponectin (42).
Despite these in vitro observations and correlative studies in humans, the physiological role of CTRP5 in peripheral tissues remains elusive. In an effort to illuminate the role of CTRP5 in modulating metabolic function, we used a genetic loss-of-function mouse model to help elucidate the role of CTRP5 in vivo.
MATERIALS AND METHODS
Human tissue samples.
Subcutaneous and visceral (omental) adipose tissues were obtained from the Adipose Biology Core of the National Institutes of Health-funded Mid-Atlantic Nutrition Obesity Research Center at the University of Maryland. Study protocols were approved by the Institutional Review Board for Human Subjects Research at the University of Maryland. Informed consent was obtained from all human subjects. Type 2 diabetes mellitus is defined for subjects having a hemoglobin A1c value of 6.5 or greater according to World Health Organization criteria (1). Characteristics of the lean (non-T2D), obese (non-T2D), and obese (with T2D) individuals are presented in Table 1. Fasting serum glucose, cholesterol, triglyceride, HDL, and LDL levels were not collected from the nondiabetic control individuals.
Table 1.
Characteristics of lean (nondiabetic), obese nondiabetic, and obese diabetic groups
| Lean (n = 8) | Obese Non-T2D (n = 8) | Obese T2D (n = 7) | |
|---|---|---|---|
| Age | 49.1 ± 15.2 | 32.8 ± 8.1 | 44.0 ± 8.2 |
| Sex (male or female) | 8 females | 8 females | 5 females, 2 males |
| BMI, kg/m2 | 24.0 ± 1.1 | 47.7 ± 7.3 | 44.9 ± 3.8 |
| Height, cm | 167.6 ± 7.7 | 167.1 ± 7.0 | 168.8 ± 7.6 |
| Weight, kg | 78.1 ± 29.6 | 132.5 ± 17.0 | 127.5 ± 19.4 |
| Fasting glucose, mg/dl | 90.9 ± 9.1 | 170.3 ± 66.4 | |
| Cholesterol, mg/dl | 160.5 ± 21.3 | 185.6 ± 53.8 | |
| Triglyceride, mg/dl | 77.9 ± 26.1 | 124.3 ± 35.3 | |
| HDL, mg/dl | 43.6 ± 9.3 | 40.6 ± 10.4 | |
| LDL, mg/dl | 101.23 ± 18.1 | 109.3 ± 33.0 |
Values are means ± SE. T2D, type 2 diabetes.
Mice.
Eight-week-old leptin-deficient ob/ob male mice and C57BL/6J male mice were obtained from The Jackson Laboratory (Bar Harbor, ME). Mouse tissues were collected from fasted and refed experiments. For the fasted group, food was removed for 16 h (beginning at 10 h into the light cycle), and mice were euthanized at 2–3 h into the light cycle. For the refed group, mice were fasted for 16 h and refed with chow pellets for 3 h before being euthanized. Because of the randomness of food intake, an ad libitum-fed group was not included in the fasting and refeeding studies. To generate the diet-induced obesity model, 4-wk-old C57BL/6J male mice were fed a high-fat diet (HFD; 60% kcal derived from fat, D12492; Research Diets, New Brunswick, NJ) or a control low-fat diet (LFD; 10% kcal derived from fat, D12450B; Research Diets) for 12 wk. A separate cohort of male mice was also exposed to a ketogenic diet or a matched control diet for a period of 12 wk (beginning at 8 wk old), as described previously (13). All mice were housed in polycarbonate cages under a 12:12-h light-dark photocycle and had access to water ad libitum throughout the study period. All animal experiments were approved by the Animal Care and Use Committee of the Johns Hopkins University School of Medicine.
Ctrp5-knockout mice.
The Ctrp5 (C1qtnf5) null mouse strain was created from ES cell clone 12534A-H11 obtained from the KOMP Repository (www.komp.org) and generated by Regeneron Pharmaceuticals (Tarrytown, NY). Genotyping primers for the Ctrp5 wild-type (WT) allele were TUF (5′-CAGAAACCCTGATGCCTCTACTC-3′) and TUR (5′-GGAGAAATTAGGAGCCGCAGAAG-3′). Primers for the knockout (KO) allele were: LacInf (5′-GGTAAA CTGGCTCGGATTAGGG-3′) and LacInR (5′-TTGACTGTAGCGGCTGATGTTG-3′). Ctrp5 KO mice were generated on a C57BL/6N genetic background. Unless otherwise noted, mice were fed ad libitum a standard laboratory chow diet (no. 5001; Lab Diet, St. Louis, MO). Body weights of Ctrp5 WT and KO mice were measured weekly. At the end of the studies, tissues were collected after the mice were euthanized. Epididymal white adipose tissue (eWAT), inguinal white adipose tissue (iWAT), liver, and skeletal muscle were quickly removed, snap-frozen in liquid nitrogen for RNA and protein extraction, or prepared for histological study. Blood samples were collected for serum analysis.
Glucose and insulin tolerance tests.
Glucose tolerance tests (GTT) and insulin tolerance tests (ITT) were performed on Ctrp5 WT and KO mice fed chow diet or HFD for 16–20 wk. For the GTT, mice were fasted for 6 h before intraperitoneal (ip) injection of 1 g glucose/kg body wt. Blood was collected via tail bleed before and 30 min after injection, and glucose concentrations were measured using a glucometer (BD Biosciences, San Jose, CA) at 0, 15, 30, 60, and 120 min. For the ITT, food was removed 2 h before ip injection of 1 U insulin/kg body wt. Blood glucose concentrations were measured at 0, 15, 30, 45, 60, and 90 min. The rate constant for plasma glucose disappearance (KITT) was calculated as KITT = 0.693/t1/2 (3). The plasma glucose t1/2 was calculated from the slope of least-squares analysis of the plasma glucose concentrations during the linear decay phase (3–15 min after insulin injection). The homeostatic model assessment of insulin resistance (HOMA-IR) was calculated based on fasting glucose and insulin concentrations as HOMA-IR = [fasting glucose (mM) × fasting insulin (μU/ml)]/22.5 (31). This surrogate index provides a reasonable approximation of the degree of insulin resistance and has been validated against the reference standard glucose clamp for rats (8) and mice (27).
RNA isolation and real-time PCR analysis.
Total RNA was isolated using Trizol reagent (Life Technologies, Carlsbad, CA), and 2 μg of RNA was reverse transcribed using GoScript Reverse Transcriptase (Promega, Madison, WI). Ten nanograms of cDNA from each sample were used in real-time PCR using SYBR Green PCR master mix on a CFX Connect system (Bio-Rad Laboratories, Hercules, CA). Results were analyzed using the 2−ΔΔCT method (43). Primer sequences are listed in Table 2. A ready-made human cDNA tissue panel (OriGene) was used to survey the tissue expression patterns of human CTRP5. To avoid detection of individual differences in gene expression, tissues were pooled from multiple individuals (based on the manufacturer's information); thus, each sample represented the average expression of CTRP5 in a particular tissue.
Table 2.
Primers used in real-time PCR
| Gene | Forward (5′-3′) | Reverse (5′-3′) |
|---|---|---|
| Human β-ACTIN | CCTCGCCTTTGCCGATCC | CGCGGCGATATCATCATC |
| Human CTRP5 | CCCACCTGCAAAGTGAGCTCATG | CTAGTCATTCACAATATTCCAG |
| 18s rRNA | GCAATTATTCCCCATGAACG | GGCCTCACTAAACCATCCAA |
| Mouse β-Actin | AGTGTGACGTTGACATCCGTA | GCCAGAGCAGTAATCTCCTTCT |
| Mouse Rpl-22 | AGCAGGTTTTGAAGTTCACCC | CAGCTTTCCCATTCACCTTGA |
| Mouse Ctrp5 | TGGAGTCTGAGCCTCCGG | AGAAGGGCAAGAAGTGGCC |
| Scd1 | CCCAGTCGTACACGTCATTTT | CATCATTCTCATGGTCCTGCT |
| Fasn | GCTGCGGAAACTTCAGAAAAT | AGAGACGTGTCACTCCTGGACTT |
| Srebp1c | GGAGCCATGGATTGCACATT | GGCCCGGGAAGTCACTGT |
| Acc1 | TGACAGACTGATCGCAGAGAAAG | TGGAGAGCCCCACACACA |
| Lcad | TCTTTTCCTCGGAGCATGACA | GACCTCTCTACTCACTTCTCCAG |
| Mcad | AGGGTTTAGTTTTGAGTTGACGG | CCCCGCTTTTGTCATATTCCG |
| Gpat1 | CAACACCATCCCCGACATC | GTGACCTTCGATTATGCGATCA |
| Gpat3 | GGAGGATGAAGTGACCCAGA | CCAGTTTTTGAGGCTGCTGT |
| Gpat4 | TGTCTGGTTTGAGCGTTCTG | TTCTGGGAAGATGAGGATGG |
| Agpat1 | TAAGATGGCCTTCTACAACGGC | CCATACAGGTATTTGACGTGGAG |
| Agpat2 | CAGCCAGGTTCTACGCCAAG | TGATGCTCATGTTATCCACGGT |
| Agpat3 | CTGCTTGCCTACCTGAAGACC | GATACGGCGGTATAGGTGCTT |
| Agpat4 | CCAGTTTCTATGTCACCTGGTC | GCAGAGTCTGGCATTGATCTTG |
| Agpat6 | AGCTTGATTGTCAACCTCCTG | CCGTTGGTGTAGGGCTTGT |
| Dgat1 | CCCTGAGTATCCAGGCAAGG | AAGGAGTGGGCCTCTAGACT |
| Dgat2 | GCGCTACTTCCGAGACTACTT | GGGCCTTATGCCAGGAAACT |
| F4/80 | CCCCAGTGTCCTTACAGAGTG | GTGCCCAGAGTGGATGTCT |
| Cd11c | CTGGATAGCCTTTCTTCTGCTG | GCACACTGTGTCCGAACTCA |
| Col3 | GGGTTTCCCTGGTCCTAAAG | CCTGGTTTCCCATTTTCTCC |
| Col6 | GATGAGGGTGAAGTGGGAGA | CAGCACGAAGAGGATGTCAA |
CTRP5, C1q/TNF-related protein 5; Scd1, stearoyl-CoA desaturase; Fasn, fatty acid synthase; Srebp1c, sterol regulatory element-binding protein-1c; Acc1, acetyl-CoA carboxylase 1; Lcad, long-chain acyl-CoA dehydrogenase; Mcad, medium-chain acyl-CoA dehydrogenase; Gpat; glycerol-3-phosphate acyltransferase isoform; Agpat, acylglycerolphosphate acyltransferase; Dgat, diacylglycerol-acyltransferase.
Body composition analysis.
Body composition of Ctrp5 WT and KO mice was determined using a quantitative nuclear magnetic resonance instrument (Echo-MRI-100; Echo Medical Systems, Waco, TX) at The Johns Hopkins University School of Medicine mouse phenotyping core facility. Eco-MRI analyses measured fat mass, lean mass, and water content.
Indirect calorimetry.
Ctrp5 WT and KO mice fed a HFD for 20 wk were used for simultaneous assessments of daily body weight change, food intake (corrected for spillage), physical activity, and whole body metabolic profile in an open-flow indirect calorimeter [Comprehensive Laboratory Animal Monitoring System (CLAMS), Columbus Instruments, Columbus, OH]. Data were collected for 3 days to confirm that mice were acclimated to the calorimetry chambers (indicated by stable body weights, food intakes, and diurnal metabolic patterns), and data were analyzed from the 4th day. Rates of oxygen consumption (V̇o2) and carbon dioxide production (V̇co2) in each chamber were measured throughout the studies. Respiratory exchange ratio (RER = V̇co2/V̇o2) was calculated by CLAMS software (version 4.02) to estimate relative oxidation of carbohydrates (RER = 1.0) vs. fats (RER = 0.7), not accounting for protein oxidation. Energy expenditure (EE) was calculated as EE = V̇o2 × [3.815 + (1.232 × RER)]. V̇o2, V̇co2, and EE data were normalized to lean body mass. Physical activities were measured by infrared beam breaks in the metabolic chamber. Average metabolic values were calculated per subject and averaged across subjects for statistical analysis.
Blood chemistry analysis.
Tail vein or lateral saphenous vein blood samples were allowed to clot on ice and then centrifuged for 10 min at 10,000 g. Serum samples were stored at −80°C. Serum triglycerides and cholesterol were measured using an Infinity kit (Thermo Fisher Scientific, Middletown, VA). Nonesterified free fatty acids were measured using a Wako kit (Wako Chemicals, Richmond, VA). Serum insulin, leptin, adiponectin, IL-6, and TNFα were measured by ELISA (Millipore, Billerica, MA) according to the manufacturer's instructions. Serum C-peptide levels were measured by ELISA (ALPCO Diagnostics, Salem, NH).
Measurements of triglyceride levels in tissues.
Experiments were performed as we have described previously (37). Lipids were extracted as described by Bligh and Dyer (5). Samples were weighed and then homogenized in PBS (100 mg/ml), and 1 ml of the sample was added to 3.75 ml of 1:2 (vol/vol) chloroform-methanol. Next, an additional 1.25 ml of chloroform was added; subsequently, 1.25 ml of distilled water was added to the solution. Samples were vortexed for 30 s between each addition. Samples were then centrifuged at 1,100 g for 10 min at room temperature to give a two-phase solution (aqueous phase on top and organic phase below). The lower phase was collected with a glass Pasteur pipette with gentle positive pressure. This phase was then washed three times with dH2O, and each time the upper phase was collected. Samples were then dried under nitrogen gas at 60°C and dissolved in tert-butyl alcohol-Triton X-100 (3:2). Triglycerides were then quantified colorimetrically as glycerol by use of a commercial enzymatic assay (Infinity Triglycerides; Fisher Diagnostics).
Recombinant CTRP5 production.
Full-length mouse recombinant CTRP5, containing a COOH-terminal FLAG tag epitope, was produced in mammalian human embryonic kidney (HEK)-293 cells (GripTite; Invitrogen, Carlsbad, CA), as described previously (61). Serum-free conditioned media containing recombinant CTRP5 was concentrated 25-fold, and the concentrated media were used in in vitro studies. Concentrated conditioned media from HEK-293 cells transfected with control pcDNA3 plasmid were used as control.
Cell culture and western blot analysis.
Mouse 3T3-L1 adipocytes and rat L6 myocytes were cultured and differentiated as described previously (59). For in vitro studies, differentiated 3T3-L1 adipocytes and L6 myotubes were cultured in 24-well plates. Cells were washed once with PBS and then incubated overnight in 180 μl of DMEM containing 0.5% BSA plus 20 μl of concentrated conditioned medium containing recombinant mouse CTRP5 (∼1 μg/ml) or 20 μl of control conditioned media from cells transfected with pcDNA3 control plasmid. The following day, cells were washed once with PBS and incubated for 5 min in HEPES-buffered saline solution (25 mM HEPES, pH 7.4, 120 mM NaCl, 5 mM KCl, 1.2 mM MgSO4, 1.3 mM CaCl2, 1.3 mM KH2PO4, and 0.5% BSA) containing 100 nM insulin or vehicle control. After that, medium was removed and cells were immediately lysed in lysis buffer (20 mM Tris·HCl, 150 mM NaCl, 1 mM EDTA, 0.5% NP-40, and 10% glycerol) with PhosSTOP phosphatase inhibitor cocktail (Roche, Basel, Switzerland) and protease inhibitor cocktail (Sigma-Aldrich, St. Louis, MO), boiled for 10 min in 95°C, and subjected to Western blot analysis using antibodies specific to Akt and phosphorylated Akt (Ser473; Cell Signaling Technology, Beverly, MA). Western blots were carried out and quantified as described previously (45).
Histology.
Formalin-fixed, paraffin-embedded white adipose tissue and liver sections were stained with hemotoxylin and eosin at the Pathology Core facility at Johns Hopkins University School of Medicine. Images were captured with a Zeiss Axioplan upright microscope with a Zeiss Axiocam color charged-coupled device camera (Carl Zeiss Microscopy, Thornwood, NY).
Statistical analysis.
Kruskal-Wallis analysis of variance with pairwise comparisons was used to determine differences among the three human fat depot groups. Spearman's correlation coefficient analysis was used to analyze the associations between adipose expression of CTRP5 and BMI. Other comparisons were made using either a two-tailed Student's t-test for two groups or one-way ANOVA for multiple groups. Values reported are means ± SE. P < 0.05 was considered statistically significant.
RESULTS
Expression of human CTRP5 in the peripheral tissues.
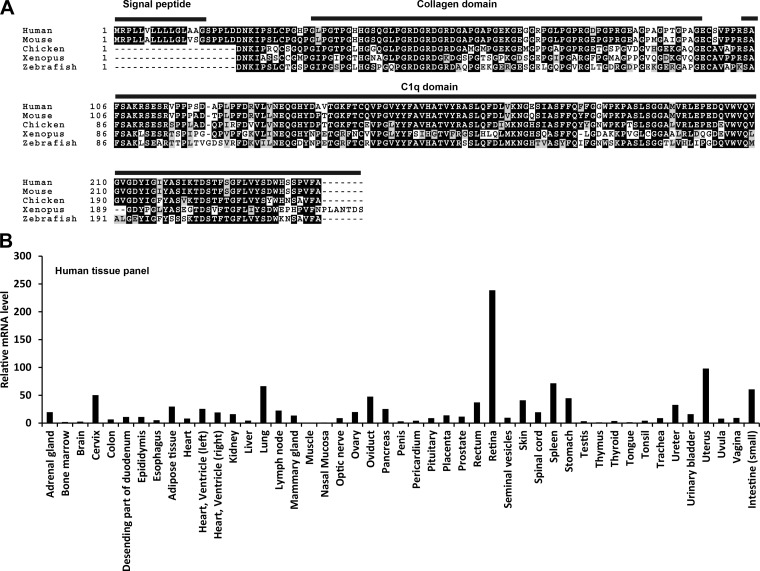
Human and mouse CTRP5 are highly conserved, with similar protein domain structure (Fig. 1A), and the full-length proteins share 94% amino acid identity. A high degree of amino acid conservation also extends to chicken (Gallus gallus; 77%), clawed frog (Xenopus tropicalis; 61%), and zebrafish (Danio rerio; 65%) CTRP5. Expression profiling of human CTRP5 across 47 tissue types clearly indicated that the transcript is also widely expressed in peripheral tissues in addition to being most highly expressed in the retina (Fig. 1B), suggesting that it likely also has a function outside of the visual system.
Fig. 1.
Evolutionary conservation of C1q/TNF-related protein 5 (CTRP5) in vertebrates and its tissue expression profile in humans. A: sequence alignment of human (NP_001265360), mouse (NP_001177248), chicken (XP_001232467), frog (Xenopus; XP_002935065), and zebrafish (NP_001025124) CTRP5 using a web-based Clustal W (version 2) tool (26). Identical amino acids are shaded black, and similar amino acids are shaded gray. Shading was done using the web-based BoxShade tool. The NH2-terminal signal peptide collagen domain (with G-X-Y repeats) and the COOH-terminal globular C1q domain are indicated. B: quantitative real-time PCR analysis of human CTRP5 mRNA expression across 47 tissue types. Expression levels of CTRP5 in each tissue were normalized to GAPDH.
Expression of Ctrp5 in wild-type and obese mice.
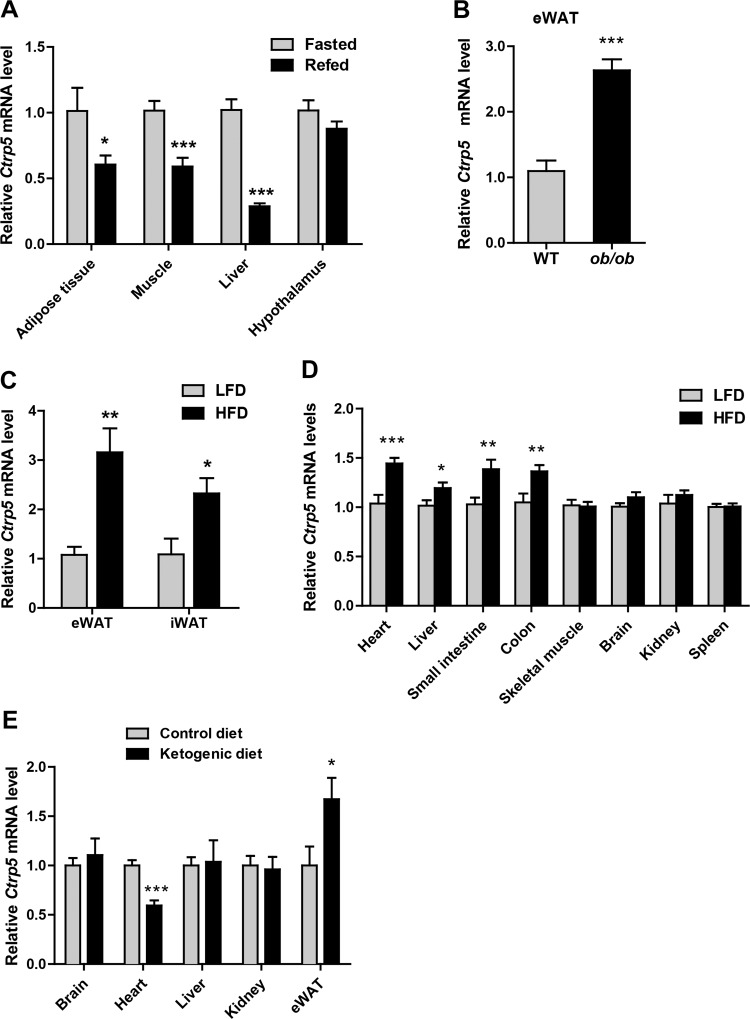
To explore the role of CTRP5 in metabolic response and energy homeostasis, we first measured the expression levels of Ctrp5 in several key metabolic tissues in wild-type C57BL/6J male mice under different metabolic states: either 16-h fast or 16-h fast followed by 3-h refeeding. The expression levels of Ctrp5 were significantly reduced in epididymal white adipose tissue (eWAT), skeletal muscle, and liver but were unchanged in the hypothalamus of refed mice compared with fasted animals (Fig. 2A). In genetic models of severe obesity, as in leptin-deficient ob/ob mice, Ctrp5 mRNA expression was markedly upregulated in eWAT (Fig. 2B), a change that parallels the increase in serum CTRP5 levels seen in these animals (35). In diet-induced obese (DIO) mouse models that more closely resemble human obesity, Ctrp5 expression was likewise significantly increased in both eWAT and iWAT of HFD-fed mice relative to animals fed a control LFD (Fig. 2C). Since Ctrp5 is relatively widely expressed, we also examined whether its mRNA levels are altered by HFD in tissues other than different fat depots. Interestingly, we also observed a modest but significant, increase in the expression of Ctrp5 in the heart, liver, small intestine, and colon of HFD-fed mice relative to control LFD-fed animals (Fig. 2D).
Fig. 2.
Ctrp5 expression in different metabolic states. A: quantitative real-time PCR analysis of Ctrp5 expression in epididymal white adipose tissue (eWAT), skeletal muscle, liver, and hypothalamus of mice subjected to overnight fast (fasted group; n = 7) or overnight fast followed by 3 h of refeeding (refed group; n = 8). Expression levels were normalized to β-actin. B and C: quantitative real-time PCR analysis of Ctrp5 expression in eWAT from leptin-deficient ob/ob (n = 10) and wild-type (WT) lean controls (n = 9) or in eWAT and inguinal white adipose tissue (iWAT) from mice fed a control low-fat diet (LFD; n = 8) vs. a high-fat diet (HFD; n = 8). D: expression levels of Ctrp5 in the brain and peripheral tissues of a separate cohort of LFD-fed (n = 11) and HFD-fed (n = 11) mice. Expression levels were normalized to β-actin. E: quantitative real-time PCR analysis of Ctrp5 expression in brain, heart, liver, kidney, and eWAT from mice fed a ketogenic diet (n = 8) or matched control diet (n = 8). Expression levels were normalized to the average of 18s rRNA, Gapdh, β-actin, and Rpl-22. *P < 0.05; **P < 0.01; ***P < 0.001.
Although both are high in fat content, HFD and ketogenic diet (low in carbohydrates) are known to elicit distinct effects on whole body energy balance and lipid metabolism (20, 22). For this reason, a separate cohort of mice was exposed to a ketogenic diet or an appropriately matched control diet. In the context of a ketogenic diet but not HFD, the expression of Ctrp5 transcript was significantly and selectively reduced in the heart but not brain, liver, or kidney (Fig. 2E). In contrast, adipose expression of Ctrp5 in ketogenic diet-fed mice was higher but the magnitude of increase was much less compared with HFD-fed mice. These results indicate the acute and chronic metabolic state-dependent modulations of Ctrp5 expression in peripheral tissues.
Expression of CTRP5 in humans.
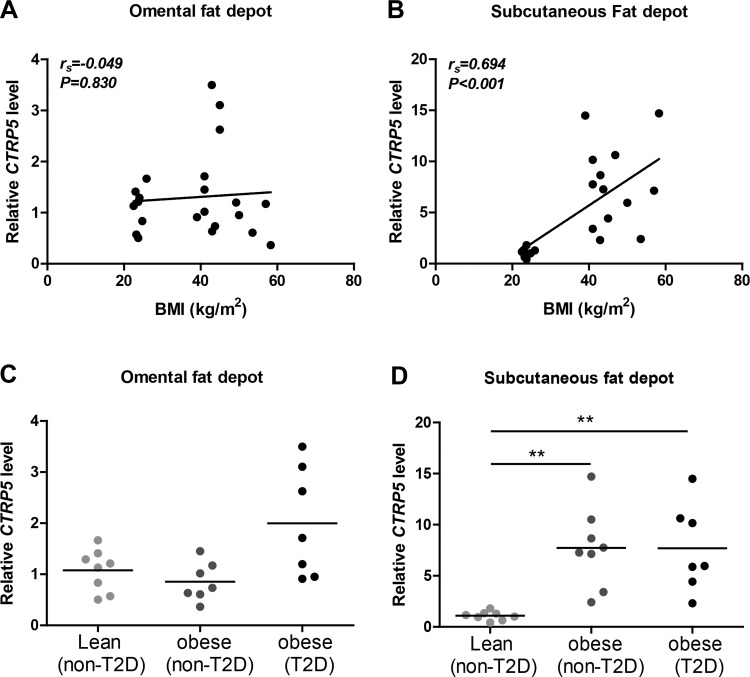
To address whether adipose expression of CTRP5 is also altered in human obesity, we measured its mRNA levels in subcutaneous and visceral (omental) fat depots. Expression of CTRP5 in subcutaneous but not omental fat depot was positively correlated with BMI (Fig. 3, A and B). A marked increase in the expression of CTRP5 was observed in subcutaneous but not omental adipose tissue of obese nondiabetic and obese diabetic individuals compared with lean controls (Fig. 3, C and D).
Fig. 3.
Expression of CTRP5 in lean and obese humans. Quantitative real-time PCR analysis of CTRP5 in omental (A and C) or subcutaneous (B and D) adipose tissue of human abdominal surgery subjects. Expression of CTRP5 in the subcutaneous fat depot is positively correlated with body mass index (BMI; B). Expression levels of CTRP5 are higher in obese individuals with or without type 2 diabetes relative to lean individuals (n = 7–8; D). Expression levels were normalized to β-actin levels in each sample. **P < 0.01.
Generation of Ctrp5 knockout mice.
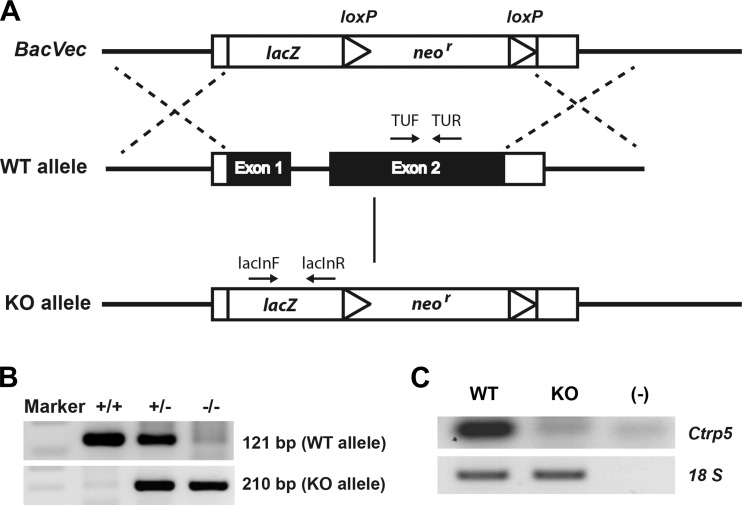
A loss-of-function mouse model was used to establish the physiological role of Ctrp5. To generate Ctrp5-null mice, the entire gene, which was comprised of two exons and one intron (1,090 bp on chromosome 9), was replaced with a targeting cassette containing a β-galactosidase reporter gene, lacZ (Fig. 4A). This strategy ensured that the KO mice were completely devoid of CTRP5 protein. Two sets of primers were designed to amplify a sequence within the protein coding region of the WT allele and a sequence spanning the upstream deletion site in the lacZ gene to confirm the genotype of WT and KO mice, respectively (Fig. 4B). As expected, Ctrp5 mRNA was absent from the eWAT of KO mice (Fig. 4C). Ctrp5 KO mice were born with the expected Mendelian ratio and appeared to be normal with no gross developmental abnormalities (data not shown). Although Ctrp5 is expressed throughout development, as early as embryonic day 7 (61), it is dispensable for embryonic development in KO mice.
Fig. 4.
Generation of Ctrp5-null mice. A: schematic showing the strategy for generating Ctrp5 knockout (KO) mice. The entire Ctrp5 gene, comprising two exons, was replaced by a neomycin resistance gene and lacZ reporter cassette. B: PCR genotyping results show the successful generation of wild-type (WT; +/+), heterozygous (+/−), and homozygous KO (−/−) alleles using the indicated primer pairs (TUF and TUR for WT allele, lacInF, and lacInR for KO allele) shown in A. C: the absence of Ctrp5 mRNA in eWAT from the KO mice was confirmed by RT-PCR with primers specific for Ctrp5 (mCtrp5F and mCtrp5R).
Metabolic phenotypes of Ctrp5 WT and KO mice fed a chow diet.
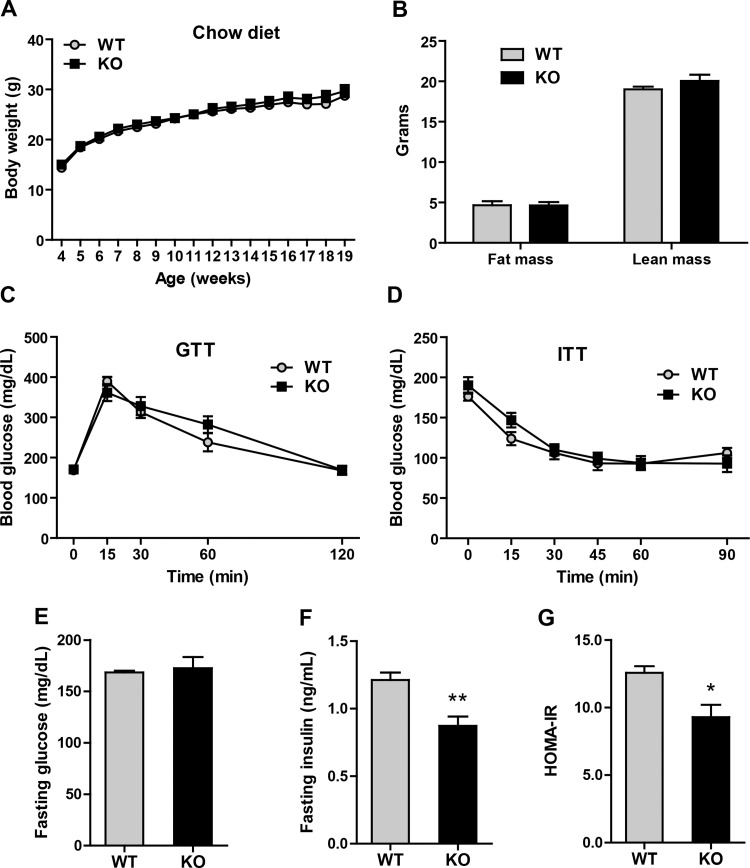
To determine the contribution of Ctrp5 to systemic energy metabolism in the normal and pathophysiological context of diet-induced obesity, weaned 4-wk-old Ctrp5 WT and KO mice were fed a standard laboratory chow or a HFD for 20 wk. On a chow diet, we observed no differences in body weight, body composition (fat and lean mass), GTT, or ITT between female WT and KO mice (data not shown). Likewise, in male Ctrp5 WT and KO mice fed a chow diet, no differences were seen in body weight, fat and lean mass, glucose, or insulin tolerance (Fig. 5, A–D). Whereas fasting blood glucose levels were not different between the two groups of mice (Fig. 5E), chow-fed Ctrp5 KO mice had significantly lower fasting insulin levels and insulin resistance index (HOMA-IR) (Fig. 5, F and G).
Fig. 5.
Metabolic phenotypes of Ctrp5-null mice fed a standard laboratory chow diet. A: body weight of wild-type (WT) and knockout (KO) male mice over time. B: fat and lean mass in WT and KO mice quantified by Echo-MRI. C: WT and KO blood glucose levels were measured at the indicated time points during glucose tolerance test (GTT). D: WT and KO blood glucose levels were measured at the indicated time points during insulin tolerance test (ITT). E and F: fasting blood glucose and insulin levels. G: calculated insulin resistance (HOMA-IR) index for WT and KO mice at 20 wk of age. WT, n = 7; KO, n = 8. *P < 0.05; **P < 0.01.
Improved insulin sensitivity in Ctrp5 KO mice fed a high-fat diet.
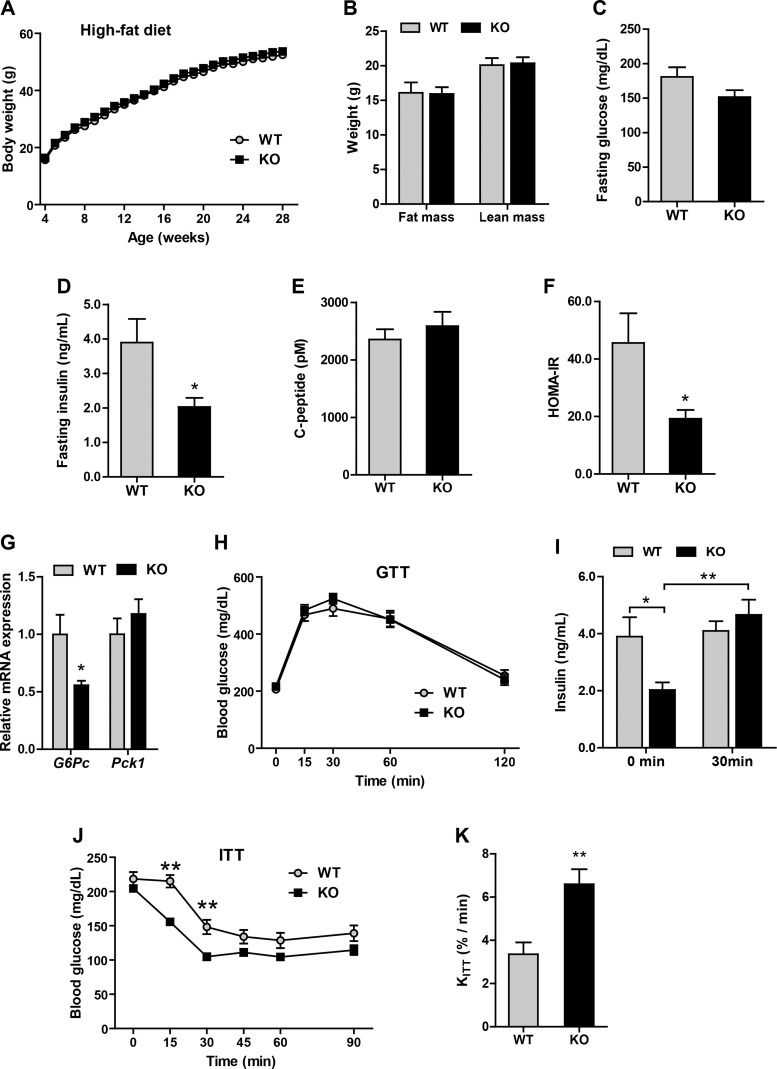
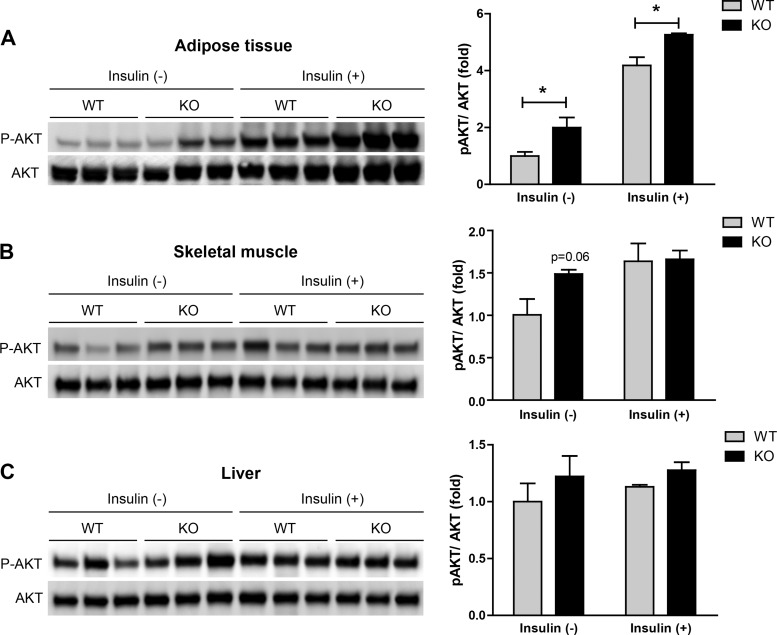
We next examined the metabolic consequences of a calorically dense HFD in our mouse model. Similar to the chow-fed groups, we observed no differences in body weight, fat, or lean mass between HFD-fed Ctrp5 WT and KO mice (Fig. 6, A and B). Although fasting blood glucose levels were indistinguishable between the two groups, HFD-fed Ctrp5 KO mice had markedly lower fasting insulin levels and insulin resistance index (HOMA-IR) as well as reduced gluconeogenic gene [glucose-6-phosphatase (G6Pc)] expression in the liver (Fig. 6, C, D, F, and G). Interestingly, fasting C-peptide levels were not different between WT and KO mice (Fig. 6E). Despite seeing no differences in a glucose tolerance test (Fig. 6H), we observed robust insulin secretion in Ctrp5 KO mice in response to glucose challenge, whereas the insulin secretion profile was severely blunted in the obese HFD-fed WT mice (Fig. 6I). When challenged with a bolus of insulin, the rate of insulin-stimulated glucose clearance in peripheral tissues was significantly greater in the Ctrp5 KO mice compared with WT controls (Fig. 6, J and K). To examine insulin signaling directly, Western blot analyses were carried out on tissues harvested from WT and KO mice injected with insulin. At baseline, prior to insulin administration, we observed a higher basal Akt phosphorylation in adipose tissue and skeletal muscle, but not liver, of Ctrp5 KO mice (Fig. 7). Upon insulin injection, the magnitude of insulin-stimulated Akt phosphorylation was also significantly higher in the adipose tissue of KO mice relative to WT controls (Fig. 7). Together, these results indicate that Ctrp5 deficiency improves peripheral tissue insulin sensitivity in HFD-fed mice.
Fig. 6.
Improved insulin sensitivity in Ctrp5-null mice fed a high-fat diet. A: body weight of wild-type (WT) and knockout (KO) male mice over time. B: fat and lean mass in WT and KO mice quantified by Echo-MRI at 21 wk of age. C–F: fasting blood glucose, insulin, and C-peptide levels as well as the calculated insulin resistance (HOMA-IR) index for WT and KO mice at 20 wk of age. G: real-time PCR for gluconeogenic gene (G6Pc and Pck1) expression in liver of WT and KO mice. H: blood glucose levels for WT and KO mice were measured at the indicated time points during glucose tolerance test (GTT). I: WT and KO serum insulin levels at 0 and 30 min after glucose injection. J: WT and KO blood glucose levels were measured at the indicated time point during insulin tolerance test (ITT). K: the decay constant (KITT) for WT and KO mice based on the ITT data. WT, n = 8; KO, n = 7. *P < 0.05; **P < 0.01.
Fig. 7.
Insulin-stimulated Akt phosphorylation in Ctrp5-null adipose tissue, skeletal muscle, and liver. Quantitative Western blot analysis of insulin-stimulated Akt (Ser473) phosphorylation in adipose tissue (A), skeletal muscle (B), and liver (C) of WT and KO mice injected with insulin (1 U/kg body wt). Tissues were harvested at 15 min post-insulin injection. A total of 10 μg protein lysate from each sample was loaded onto Western blot gels. *P < 0.05.
Lipid profiles in HFD-fed Ctrp5 KO mice.
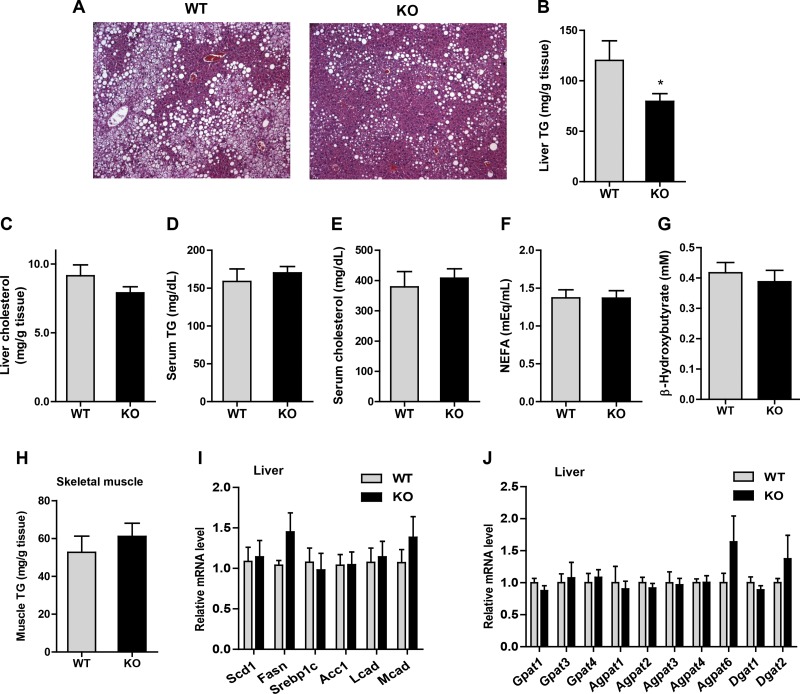
Excessive lipid accumulation in the liver, commonly known as hepatic steatosis, is frequently accompanied by insulin resistance. We performed histological analysis to determine whether changes in liver could account for the improvements in whole body insulin resistance seen in the HFD-fed Ctrp5 KO mice. Hematoxylin and eosin staining showed that liver sections from KO mice had reduced steatosis compared with WT controls (Fig. 8A). In support of the histological data, we also observed reduced hepatic TG content, but not cholesterol levels, in the KO mouse liver relative to WT controls (Fig. 8, B and C). Serum levels of TG, NEFA, β-hydroxybutyrate (ketone), and cholesterol, however, were not significantly different between the two groups (Fig. 8, D–G). In contrast to liver, triglyceride levels in the skeletal muscle were not different between WT and Ctrp5 KO animals (Fig. 8H).
Fig. 8.
Lipid and adipokine profiles of Ctrp5-null mice fed a high-fat diet. A: representative histological sections of liver from WT and KO mice stained with hematoxylin and eosin. B and C: liver triglyceride and cholesterol levels of WT and KO mice. D–G: serum concentrations of triglycerides, cholesterol, and nonesterified free fatty acids (NEFA) and β-hydroxybutyrate (ketone) in WT and KO mice. H: skeletal muscle triglyceride levels of WT and KO mice. I: quantitative PCR analysis of genes involved in de novo lipid synthesis (Scd1, Fasn, Srebp1c, and Acc1) and fat oxidation (Lcad and Mcad) in WT and KO mouse liver. J: expression of genes (Gpat, Agpat, and Dgat) involved in triglyceride synthesis in WT and KO mouse liver. All expression levels were normalized to 18s rRNA. WT, n = 8; KO, n = 7. *P < 0.05.
We next examined whether changes in the expression of hepatic lipid synthesis or fat oxidation genes might underlie the observed reduction in hepatic TG content. However, no differences were found in the expression of genes involved in de novo lipid synthesis (Scd1, Fasn, Srebp1c, and Acc1), fat oxidation (Lcad and Mcad), or TG synthesis (Gpat, Agpat, and Dgat family members) between WT and KO mice (Fig. 8, I and J).
Inflammatory and fibrotic states of adipose tissue.
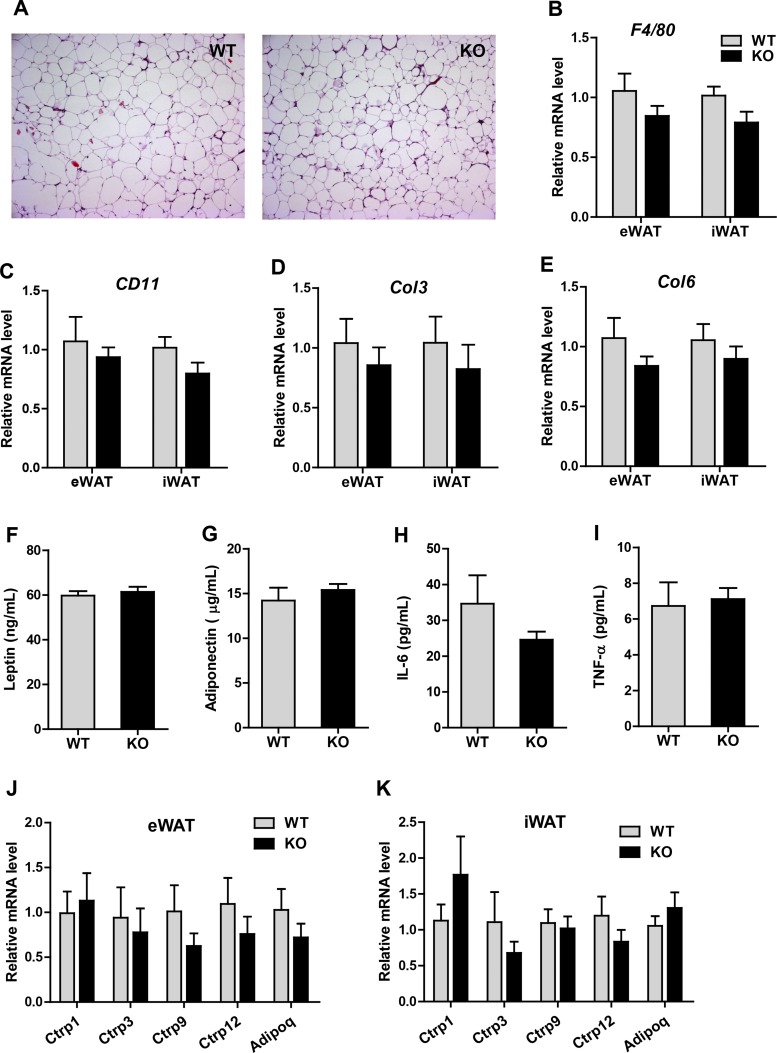
HFD-induced obesity is known to result in adipose tissue inflammation due to macrophage infiltration as well as tissue remodeling (i.e., fibrosis), both of which compromise adipose tissue health and function and lead to dysregulated systemic glucose and lipid metabolism (18, 52). We sought to determine whether there is a difference in adipose tissue inflammation and fibrosis in Ctrp5 WT and KO mice in response to HFD. Histology of visceral (epididymal) adipose tissue did not reveal any differences in the size of adipocytes or the extent of immune cell infiltration (Fig. 9A). Consistent with the histology, no significant differences were seen in the expression of macrophage marker genes (F4/80 and Cd11) in either visceral (epididymal) or subcutaneous (inguinal) white adipose tissue (Fig. 9, B and C). We also examined the expression of fibrotic collagen genes (Col3 and Col6) and did not observe any differences between the two groups of mice (Fig. 9, D and E). It has been shown that high-fat diet also disrupts pancreatic islet morphology and promotes kidney fibrosis. However, examination of tissue sections of pancreas and kidney also revealed no differences between WT and KO animals (data not shown). Since circulating adipokines produced by adipose tissue play important roles in regulating systemic insulin sensitivity, we measured serum levels of leptin, adiponectin, IL-6, and TNFα and did not see any differences between WT and KO mice (Fig. 9, F–I).
Fig. 9.
Inflammatory and fibrotic states of adipose tissue in Ctrp5-null mice. A: representative histological sections of eWAT from WT and KO mice stained with hematoxylin and eosin. B and C: quantitative PCR analysis of macrophage marker genes (F4/80 and Cd11) in visceral (epididymal; eWAT) and subcutaneous (inguinal; iWAT) white adipose tissue. D and E: expression levels of fibrotic collagen genes (Col3 and Col6) in the visceral (eWAT) and subcutaneous (iWAT) fat depots of WT and KO mice. F–I: ELISA quantification of serum leptin, adiponectin, IL-6, and TNFα levels in WT and KO mice. J and K: expression levels of adiponectin and CTRPs in the eWAT and iWAT of WT and KO mice. All expression levels were normalized to 18s rRNA levels. WT, n = 8; KO, n = 7.
Given that CTRP5 is structurally related to other CTRP family members, such as adiponectin, which is known to have important metabolic functions (21, 36–38, 56, 57), we sought to determine whether deletion of the Ctrp5 gene could lead to a compensatory upregulated expression of adiponectin and/or other CTRPs. However, in both visceral (epididymal) and subcutaneous (inguinal) fat depots, the expression of Ctrp1, Ctrp3, Ctrp9, Ctrp12, and adiponectin (adipoq) was not different between WT and KO mice (Fig. 9, J and K).
Whole body metabolic parameters of HFD-fed Ctrp5 KO mice.
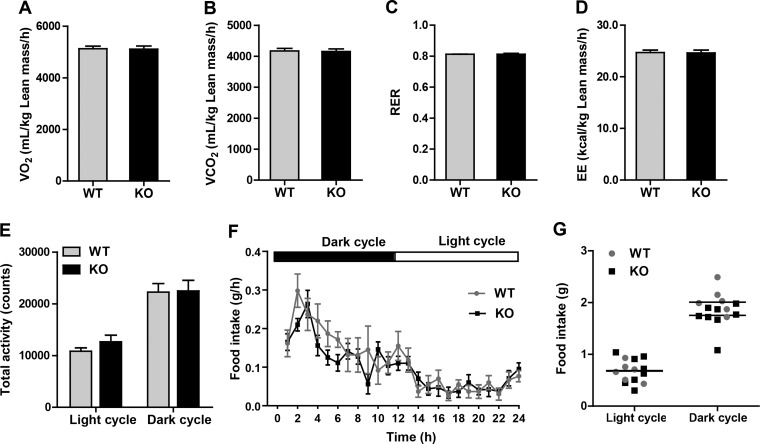
To determine the impact of CTRP5 deficiency on whole body energy balance, we performed indirect calorimetry analyses on HFD-fed WT and KO mice. Both groups of mice had similar rates of oxygen consumption (V̇o2), carbon dioxide production (V̇co2), respiratory exchange ratios (RER), and energy expenditure (EE) (Fig. 10, A–D). The physical activity levels during the light and dark phases of the light cycle were also similar between WT and KO mice (Fig. 10E). Food intake, however, was slightly reduced in Ctrp5 KO mice relative to WT controls during the dark cycle, when mice are most active (Fig. 10, F and G). The very modest reduction in food intake did not result in a significant change in average body weight or adiposity between the two groups of mice over time (Fig. 6, A and B).
Fig. 10.
Indirect calorimetry analysis of Ctrp5-null mice fed a high-fat diet. A–D: oxygen consumption (V̇o2), CO2 production (V̇co2), respiratory exchange ratio (RER), and energy expenditure (EE) for male WT and KO mice at 22 wk of age. E: total physical activity levels for WT and KO mice during the dark and light phases of the photocycle. F: real-time food intake measurements for WT and KO mice during the dark and light phases of the photocycle. G: cumulative food intake (over a 12-h period) for WT and KO mice in the dark and light phases of the photocycle. (WT, n = 6; KO, n = 8).
Improved metabolic phenotype in aged Ctrp5 KO mice fed a HFD.
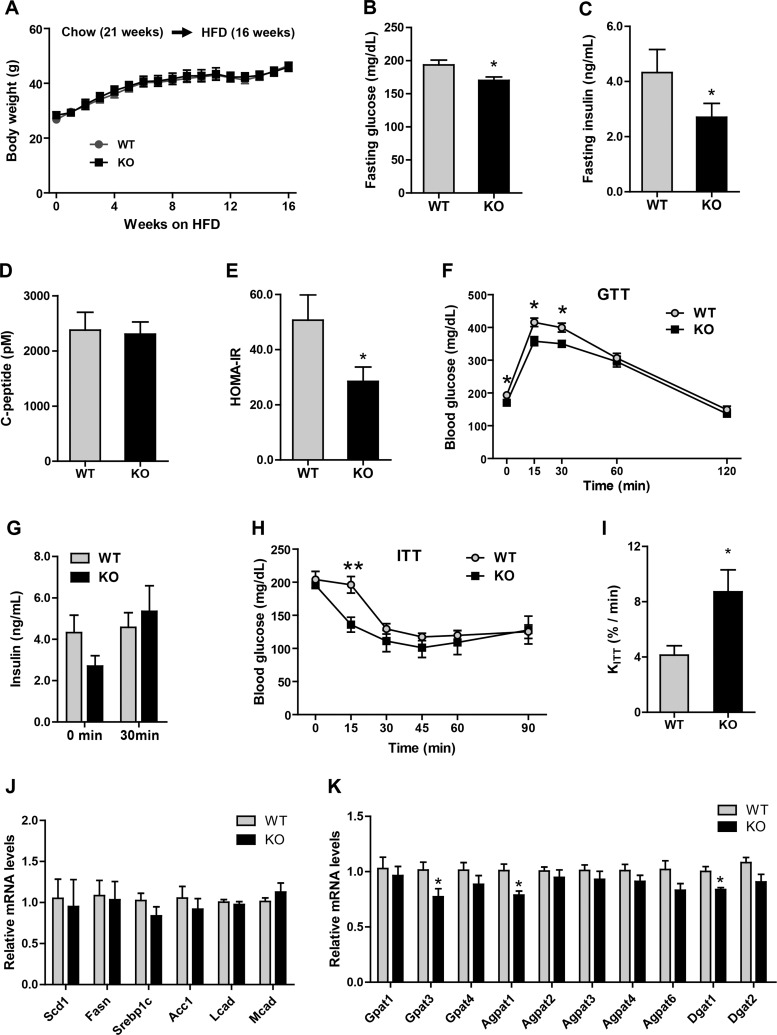
Metabolic derangement is exacerbated by age (17). Therefore, we sought to address how well the aged Ctrp5 KO mice responded to metabolic stress induced by high-fat feeding. To do so, a separate cohort of WT and KO mice were initially fed a standard laboratory chow for the first 21 wk after weaning. Thereafter, mice were switched over to a HFD for another 16 wk. This enabled us to determine how well the aged mice (41 wk old) cope with the metabolic impacts of switching to a high-fat diet as an adult. After just 1 wk of high-fat feeding, the WT mice gained proportionally more weight (%body weight gain) than the KO animals, and the differences in percent body weight gain became more significant from weeks 6 to 12 (data not shown). However, the average body weight (in g) was not different between the two groups of mice (Fig. 11A). In aged mice (>10 mo of age) fed a HFD later in life, Ctrp5 deficiency lowered fasting blood glucose and insulin (Fig. 11, B and C), reduced insulin resistance (Fig. 11E), improved glucose and insulin tolerance (Fig. 11, F–I), and decreased the expression of genes (Agpat, Gpat, and Dgat) involved in hepatic triglyceride synthesis (Fig. 11, J and K). Despite lower fasting blood glucose and insulin levels, serum C-peptide levels were not different between WT and KO mice (Fig. 11D).
Fig. 11.
Reduced insulin resistance and hepatic triglyceride synthesis gene expression in aged Ctrp5-null mice fed a high-fat diet later in life. Weaned WT and KO male mice were fed a chow diet for 21 wk and then a HFD for 16 wk. A: body weights of male WT (n = 9) and KO (n = 7) mice after being switched to a HFD. B–E: fasting blood glucose, serum insulin, and C-peptide levels as well as the calculated insulin resistance (HOMA-IR) index of aged WT and KO mice after high-fat feeding for 16 wk. F: blood glucose levels of WT (n = 7) and KO (n = 5) mice at the indicated time points during glucose tolerance test (GTT). G: serum insulin levels were measured in the same group of mice during GTT. H: blood glucose levels of WT (n = 7) and KO (n = 5) mice at the indicated time points during insulin tolerance test (ITT). I: the decay constant (KITT) for WT and KO mice based on the ITT data. J: quantitative PCR analysis of genes involved in de novo lipid synthesis (Scd1, Fasn, Srebp1c, and Acc1) and fat oxidation (Lcad and Mcad) in WT and KO mouse liver. K: expression of genes (Gpat, Agpat, and Dgat) involved in triglyceride synthesis in WT and KO mouse liver. Food was removed for 3 h before liver tissue was harvested from mice. Expression levels were normalized to 18s rRNA levels. WT, n = 7; KO, n = 6. *P < 0.05; **P < 0.01.
CTRP5 impairs insulin signaling in cultured adipocytes and myotubes.
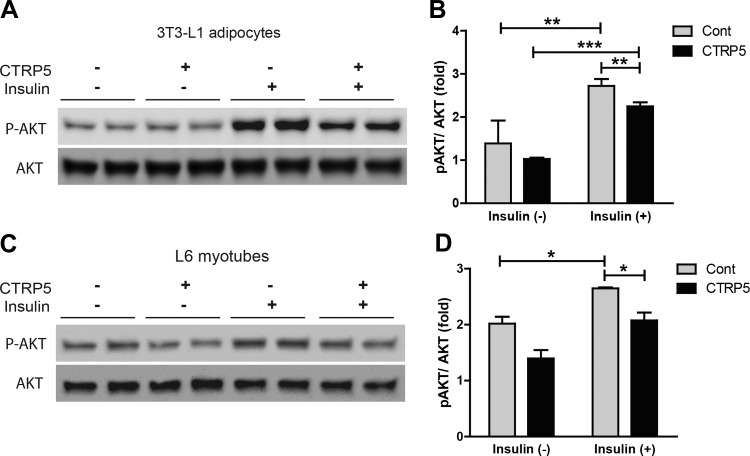
Since mice lacking CTRP5 had improved insulin action and reduced insulin resistance, we next addressed whether the observed in vivo metabolic phenotypes were due to the direct action of CTRP5 on cells or via an indirect mechanism. To test this, we used established cell culture models of mouse adipocytes (3T3-L1) and rat myotubes (L6). As expected, insulin robustly stimulated the phosphorylation of protein kinase B/Akt in adipocytes and myotubes (Fig. 12). However, when cells were pretreated with conditioned media containing recombinant CTRP5 (∼1 ng/μL), insulin-stimulated Akt phosphorylation was attenuated compared with cells treated with control conditioned media (Fig. 12), suggesting that recombinant CTRP5 can act on cells to negatively modulate insulin signaling.
Fig. 12.
Recombinant mouse CTRP5 attenuates insulin-stimulated Akt phosphorylation. A and C: mouse 3T3-L1 adipocytes (A) and rat L6 myotubes (C) were treated overnight with control conditioned medium or conditioned medium containing recombinant mouse CTRP5. The following day, cells were washed once and then stimulated with vehicle control or 100 nM insulin for 5 min. Cell lysates were then subjected to Western blot analysis with total and phosphorylated Akt antibodies. B: quantification of immunoblot results for 3T3-L1 adipocytes based on 2 independent experiments (n = 4). C: quantification of immunoblot results for L6 myotubes based on 2 independent experiments (n = 4). *P < 0.05; **P < 0.01; ***P < 0.001.
DISCUSSION
In the initial description of mouse CTRP5, we showed that the transcript is widely expressed by a variety of tissues, with the highest levels in the eye (61, 62). Expression of human CTRP5, however, has been examined only in ocular tissue in the context of disease-causing mutations that result in L-ORD (2, 16). Although the functional capabilities of CTRP5 remain largely unclear, we report here several lines of in vivo evidence to establish, for the first time, the metabolic function of CTRP5 in peripheral tissues. Consistent with a metabolic role, CTRP5 expression is highly responsive to acute and chronic alterations in metabolic state. Whereas refeeding following a fast reduced the expression of Ctrp5 in adipose, skeletal muscle, and liver relative to the fasted state, its expression was unchanged in the refed state in hypothalamus. As a negative regulator of insulin action, reduced Ctrp5 expression in these tissues may enhance insulin sensitivity in the refed state. We show that different diets also modulate the expression of Ctrp5 in peripheral tissues. Whereas HFD significantly upregulates the expression of Ctrp5 in the visceral (epididymal) white adipose tissue, a ketogenic diet not only upregulated Ctrp5 expression in eWAT but also downregulated the expression of Ctrp5 in the heart. In rodents, a ketogenic diet has been shown to promote hepatic insulin resistance despite reduced weight gain (20); thus, the upregulated expression of Ctrp5 by a ketogenic diet may contribute to impaired hepatic insulin action seen in the previous study. The significance of reduced Ctrp5 expression in the heart in response to a ketogenic diet is presently unclear. In the absence of an ELISA assay specific for mouse CTRP5, our study was limited to assessing mRNA levels in tissues and not circulating serum CTRP5 levels.
In human and rodent models of obesity, CTRP5 mRNA expression in the adipose tissue was significantly upregulated, consistent with previous studies showing increased human CTRP5 expression in obese Pima Indians (28) as well as increased serum CTRP5 levels in genetic models (ob/ob and db/db) of obesity in rodents (35). In humans, the expression of CTRP5 in subcutaneous but not visceral (omental) white adipose tissue is also positively correlated with BMI and is upregulated in obese individuals with or without type 2 diabetes. Although our sample size was small, an increase in CTRP5 expression in subcutaneous adipose tissue has also been reported for obese Pima Indians (28). These observations underscore the relevance of CTRP5 to human metabolic disorders.
Previous in vitro studies in mouse C2C12 myocytes and rat L6 myotubes using either bacterially produced recombinant rat CTRP5 (fused to a GST tag) or the truncated globular domain of human CTRP5 indicated a role for CTRP5 in ameliorating lipid-induced insulin resistance and enhancing fatty acid oxidation by activating the conserved energy-sensing AMPK signaling pathway (35, 63). In the absence of in vivo data, the physiological relevance of these in vitro findings remains uncertain. To help resolve this, we used a genetic loss-of-function approach in the present study to interrogate the metabolic function of endogenous CTRP5 in a physiological context. We show that mice lacking CTRP5 and fed either control chow, HFD at weaning, or HFD later in life (beginning at 4 mo) have improved insulin sensitivity without changes in body weight or adiposity compared with WT controls. Deleting the Ctrp5 gene also did not alter whole body metabolic rate (V̇o2), physical activity, energy expenditure, or adipose tissue inflammatory and fibrotic states. Respiratory exchange ratios (RER) did not reveal any differences in fat oxidation between Ctrp5 WT and KO mice, nor did we observe any differences in skeletal muscle AMPK phosphorylation (Thr172) or activation between WT and KO animals (data not shown). Since targeted deletion of Ctrp5 gene improved insulin action, our data suggest that CTRP5 negatively regulates glucose metabolism in vivo, contrary to the previously suggested positive role of CTRP5 based on in vitro studies (35). Our results thus underscore the importance of using a genetic approach to help establish the critical metabolic function of CTRP5 in an intact organism.
Interestingly, we did not observe any differences in fasting serum C-peptide levels between genotypes despite reduced fasting serum insulin in the Ctrp5 KO animals relative to WT controls. The C-peptide fragment is generally cosecreted with insulin in equimolar concentration, and it has a constant metabolic clearance rate; for this reason, its measurement (instead of insulin) is often used as a surrogate marker to assess pancreatic β-cell function. The observation that Ctrp5 KO mice have lower fasting insulin levels without changes in serum C-peptide levels suggests the possibility of higher insulin clearance rate in the CTRP5-deficient animals.
Using in vitro cell culture models of adipocytes and myotubes, we show that CTRP5 can attenuate insulin signaling, suggesting that the in vivo phenotypes we observed in KO mice are likely due to the effects of CTRP5 on peripheral tissues. In our in vitro studies, full-length recombinant CTRP5 was made in mammalian HEK-293 cells, thus ensuring proper posttranslational modifications of CTRP5 and the assembly of higher-order structures likely to be important for the biological function of the protein. The differences between our findings and those of Park et al. (35) may be attributable to differences between bacterially produced GST fusion and truncated protein vs. mammalian-produced full-length CTRP5.
Metabolic regulation in vivo is a complex and robust process due largely to functional redundancy and compensation. CTRP5 belongs to the C1q family of proteins that includes adiponectin (41) and 14 other related CTRP family members (6, 45, 46, 57–62), and these secreted proteins share common structural features, including a signature COOH-terminal globular domain homologous to the immune complement C1q (46, 62). Several of the CTRP family members have been shown to play important roles in regulating glucose and/or lipid metabolism in peripheral tissues (36–39, 57) as well as have a central role in modulating food intake (6, 7). Recent in vitro studies in 3T3-L1 adipocytes using bacterially produced recombinant protein suggest that CTRP5 can inhibit the secretion of adiponectin, an insulin-sensitizing adipokine (42). In Ctrp5 KO mice, circulating levels of adiponectin were not different compared with WT controls, suggesting that the improved insulin action seen in the Ctrp5 KO mice is not due to a compensatory upregulated expression of adiponectin or related CTRP family members with known metabolic functions in vivo. Rather, our data suggest a distinct metabolic role for CTRP5. Whereas other CTRPs have been shown to play positive and beneficial roles in modulating glucose and fatty acid metabolism (14, 36–39, 57), CTRP5 appears to serve as a negative regulator of insulin sensitivity and glucose metabolism. The distinct functions of different CTRP family members is consistent with their remarkable and high degree of conservation throughout vertebrate evolution (46).
In the Ctrp5 KO mice fed a HFD, hepatic TG levels were reduced, and accordingly, liver histology also indicated reduced liver steatosis compared with WT littermate controls. However, the expression of genes involved in de novo lipogenesis, fat oxidation, and triglyceride synthesis was not different between WT and Ctrp5 KO animals. Notably, however, we examined only the mRNA expression of the enzymes and not their protein levels or enzymatic activity. In contrast, aged KO mice fed an HFD later in life had reduced hepatic expression of triglyceride synthesis genes (Agpat2, Gpat3, and Dgat1). Since the HFD-fed Ctrp5 KO mice had reduced fasting insulin and enhanced insulin sensitivity, the decrease in hepatic TG levels seen in the CTRP5-deficient mice may be a consequence of improvements in systemic insulin sensitivity (4). Lipid accumulation in hepatocytes has been associated with hepatic insulin resistance (23, 24, 40, 53), but the causal relationship between these two processes remains unclear (11, 15, 34, 40). The mechanistic link between hepatic steatosis and insulin resistance remains to be fully established.
A dominant missense mutation (S163R) in the globular C1q domain of CTRP5 causes L-ORD in humans (2, 16, 51). L-ORD appears to be rare and affects individuals in the fifth and sixth decades of life (25, 33). A total of close to 50 individuals with L-ORD carrying the S163R mutation in the CTRP5 gene have thus far been identified; no metabolic parameters (e.g., BMI and fasting blood glucose) for these individuals have been reported (2, 16, 51). Interestingly, two of the Ctrp5 S163R knockin mouse models have contrasting phenotypes; one largely phenocopies the human retinal defects (9), whereas the other has no retinal abnormalities up to 2 yr of age (47). The differences between the two groups were attributed to dissimilar genetic backgrounds of the animals. Since metabolic parameters were not included (9, 47), we do not know whether these single-point mutation knockin mice (either heterozygous or homozygous for the S163R allele) have improved insulin sensitivity comparable with the homozygous KO mice reported in the present study, in which the entire Ctrp5 gene was removed. In the case where the S163R knockin mice developed L-ORD, overt retinal defects appeared between 12 and 21 mo of age (9). Since all of our studies were conducted using Ctrp5 KO mice that are younger (between 4 and 10 mo of age), and the retinal histology of 10-mo-old WT and KO mice revealed no apparent differences (data not shown), we assumed that the Ctrp5-null animals had normal retinal function within the study period.
Indeed, in Mexican cavefish (Astyanax mexicanus) that live in permanent darkness, the eye degenerates and the cavefish are blind (19). However, its genome retains the CTRP5 gene (32) (GenBank accession number: XM_007258879). The predicted A. mexicanus CTRP5 transcript (XP_007258941) is 61% identical to human CTRP5, which is comparable with the 65% identity between zebrafish and human CTRP5. The retention of CTRP5 gene in blind Mexican cavefish, despite the loss of most vision-related genes, further suggests that the encoded secreted protein has a hormonal role in peripheral tissue in addition to its role in the retina.
Our results support a metabolic function for Ctrp5. The genetic loss-of-function studies described herein establish CTRP5 as a negative regulator of glucose metabolism and insulin sensitivity, and our results provide a mechanistic link between increased adipose expression of CTRP5 and impaired glucose homeostasis in obesity. Inhibiting CTRP5 action may prove valuable in improving insulin resistance associated with obesity, and future studies using KO mice may uncover additional physiological roles for this secreted protein in both normal and disease states.
GRANTS
This work was supported by grants from the National Institutes of Health (DK-084171 to G. W. Wong and NS-072241 to M. J. Wolfgang), a postdoctoral fellowship from the American Heart Association (POST17070119) to X. Lei, and a postdoctoral fellowship from the Carlsberg Foundation and Danish Council for Independent Research (DFF-4183-00634) to P. S. Petersen.
DISCLOSURES
No conflicts of interest, financial or otherwise, are declared by the authors.
AUTHOR CONTRIBUTIONS
X.L. and G.W.W. conception and design of research; X.L., S.R., P.S.P., M.M.S., and C.E.B. performed experiments; X.L., S.R., P.S.P., C.E.B., and G.W.W. analyzed data; X.L. and G.W.W. interpreted results of experiments; X.L., P.S.P., and G.W.W. prepared figures; X.L. and G.W.W. drafted manuscript; X.L., S.R., P.S.P., and G.W.W. edited and revised manuscript; X.L., S.R., P.S.P., M.M.S., C.E.B., M.J.W., and G.W.W. approved final version of manuscript.
ACKNOWLEDGMENTS
We thank Susan Aja for help with indirect calorimetry. We thank John C. McLenithan from the University of Maryland (School of Medicine) for providing the human adipose tissue cDNAs.
REFERENCES
- 1.Alberti KG, Zimmet PZ. Definition, diagnosis and classification of diabetes mellitus and its complications. Part 1: diagnosis and classification of diabetes mellitus provisional report of a WHO consultation. Diabet Med 15: 539–553, 1998. [DOI] [PubMed] [Google Scholar]
- 2.Ayyagari R, Mandal MN, Karoukis AJ, Chen L, McLaren NC, Lichter M, Wong DT, Hitchcock PF, Caruso RC, Moroi SE, Maumenee IH, Sieving PA. Late-onset macular degeneration and long anterior lens zonules result from a CTRP5 gene mutation. Invest Ophthalmol Vis Sci 46: 3363–3371, 2005. [DOI] [PubMed] [Google Scholar]
- 3.Bonora E, Manicardi V, Zavaroni I, Coscelli C, Butturini U. Relationships between insulin secretion, insulin metabolism and insulin resistance in mild glucose intolerance. Diabete Metab 13: 116–121, 1987. [PubMed] [Google Scholar]
- 4.Brown MS, Goldstein JL. Selective versus total insulin resistance: a pathogenic paradox. Cell Metab 7: 95–96, 2008. [DOI] [PubMed] [Google Scholar]
- 5.Bligh EG, Dyer WJ. A rapid method of total lipid extraction and purification. Can J Biochem Physiol 37: 911–917, 1959. [DOI] [PubMed] [Google Scholar]
- 6.Byerly MS, Petersen PS, Ramamurthy S, Seldin MM, Lei X, Provost E, Wei Z, Ronnett GV, Wong GW. C1q/TNF-related protein 4 (CTRP4) is a unique secreted protein with two tandem C1q domains that functions in the hypothalamus to modulate food intake and body weight. J Biol Chem 289: 4055–4069, 2014. [DOI] [PMC free article] [PubMed] [Google Scholar]
- 7.Byerly MS, Swanson R, Wei Z, Seldin MM, McCulloh PS, Wong GW. A Central role for C1q/TNF-related protein 13 (CTRP13) in modulating food intake and body weight. PLoS One 8: e62862, 2013. [DOI] [PMC free article] [PubMed] [Google Scholar]
- 8.Cacho J, Sevillano J, de Castro J, Herrera E, Ramos MP. Validation of simple indexes to assess insulin sensitivity during pregnancy in Wistar and Sprague-Dawley rats. Am J Physiol Endocrinol Metab 295: E1269–E1276, 2008. [DOI] [PubMed] [Google Scholar]
- 9.Chavali VR, Khan NW, Cukras CA, Bartsch DU, Jablonski MM, Ayyagari R. A CTRP5 gene S163R mutation knock-in mouse model for late-onset retinal degeneration. Hum Mol Genet 20: 2000–2014, 2011. [DOI] [PMC free article] [PubMed] [Google Scholar]
- 10.Choi HY, Park JW, Lee N, Hwang SY, Cho GJ, Hong HC, Yoo HJ, Hwang TG, Kim SM, Baik SH, Park KS, Youn BS, Choi KM. Effects of a combined aerobic and resistance exercise program on C1q/TNF-related protein-3 (CTRP-3) and CTRP-5 levels. Diabetes Care 36: 3321–3327, 2013. [DOI] [PMC free article] [PubMed] [Google Scholar]
- 11.Cohen JC, Horton JD, Hobbs HH. Human fatty liver disease: old questions and new insights. Science 332: 1519–1523, 2011. [DOI] [PMC free article] [PubMed] [Google Scholar]
- 12.Dinculescu A, Min SH, Dyka FM, Deng WT, Stupay RM, Chiodo V, Smith WC, Hauswirth WW. Pathological Effects of Mutant C1QTNF5 (S163R) Expression in Murine Retinal Pigment Epithelium. Invest Ophthalmol Vis Sci 56: 6971–6980, 2015. [DOI] [PMC free article] [PubMed] [Google Scholar]
- 13.Ellis JM, Bowman CE, Wolfgang MJ. Metabolic and tissue-specific regulation of Acyl-CoA metabolism. PLoS One 10: e0116587, 2015. [DOI] [PMC free article] [PubMed] [Google Scholar]
- 14.Enomoto T, Ohashi K, Shibata R, Higuchi A, Maruyama S, Izumiya Y, Walsh K, Murohara T, Ouchi N. Adipolin/C1qdc2/CTRP12 functions as an adipokine that improves glucose metabolism. J Biol Chem 286: 34552–34558, 2011. [DOI] [PMC free article] [PubMed] [Google Scholar]
- 15.Farese RV Jr, Zechner R, Newgard CB, Walther TC. The problem of establishing relationships between hepatic steatosis and hepatic insulin resistance. Cell Metab 15: 570–573, 2012. [DOI] [PMC free article] [PubMed] [Google Scholar]
- 16.Hayward C, Shu X, Cideciyan AV, Lennon A, Barran P, Zareparsi S, Sawyer L, Hendry G, Dhillon B, Milam AH, Luthert PJ, Swaroop A, Hastie ND, Jacobson SG, Wright AF. Mutation in a short-chain collagen gene, CTRP5, results in extracellular deposit formation in late-onset retinal degeneration: a genetic model for age-related macular degeneration. Hum Mol Genet 12: 2657–2667, 2003. [DOI] [PubMed] [Google Scholar]
- 17.Hildrum B, Mykletun A, Hole T, Midthjell K, Dahl AA. Age-specific prevalence of the metabolic syndrome defined by the International Diabetes Federation and the National Cholesterol Education Program: the Norwegian HUNT 2 study. BMC Public Health 7: 220, 2007. [DOI] [PMC free article] [PubMed] [Google Scholar]
- 18.Hotamisligil GS. Inflammation and metabolic disorders. Nature 444: 860–867, 2006. [DOI] [PubMed] [Google Scholar]
- 19.Jeffery WR. Cavefish as a model system in evolutionary developmental biology. Dev Biol 231: 1–12, 2001. [DOI] [PubMed] [Google Scholar]
- 20.Jornayvaz FR, Jurczak MJ, Lee HY, Birkenfeld AL, Frederick DW, Zhang D, Zhang XM, Samuel VT, Shulman GI. A high-fat, ketogenic diet causes hepatic insulin resistance in mice, despite increasing energy expenditure and preventing weight gain. Am J Physiol Endocrinol Metab 299: E808–E815, 2010. [DOI] [PMC free article] [PubMed] [Google Scholar]
- 21.Kadowaki T, Yamauchi T, Kubota N, Hara K, Ueki K, Tobe K. Adiponectin and adiponectin receptors in insulin resistance, diabetes, and the metabolic syndrome. J Clin Invest 116: 1784–1792, 2006. [DOI] [PMC free article] [PubMed] [Google Scholar]
- 22.Kennedy AR, Pissios P, Otu H, Roberson R, Xue B, Asakura K, Furukawa N, Marino FE, Liu FF, Kahn BB, Libermann TA, Maratos-Flier E. A high-fat, ketogenic diet induces a unique metabolic state in mice. Am J Physiol Endocrinol Metab 292: E1724–E1739, 2007. [DOI] [PubMed] [Google Scholar]
- 23.Kotronen A, Seppala-Lindroos A, Bergholm R, Yki-Jarvinen H. Tissue specificity of insulin resistance in humans: fat in the liver rather than muscle is associated with features of the metabolic syndrome. Diabetologia 51: 130–138, 2008. [DOI] [PubMed] [Google Scholar]
- 24.Kotronen A, Vehkavaara S, Seppälä-Lindroos A, Bergholm R, Yki-Järvinen H. Effect of liver fat on insulin clearance. Am J Physiol Endocrinol Metab 293: E1709–E1715, 2007. [DOI] [PubMed] [Google Scholar]
- 25.Kuntz CA, Jacobson SG, Cideciyan AV, Li ZY, Stone EM, Possin D, Milam AH. Sub-retinal pigment epithelial deposits in a dominant late-onset retinal degeneration. Invest Ophthalmol Vis Sci 37: 1772–1782, 1996. [PubMed] [Google Scholar]
- 26.Larkin MA, Blackshields G, Brown NP, Chenna R, McGettigan PA, McWilliam H, Valentin F, Wallace IM, Wilm A, Lopez R, Thompson JD, Gibson TJ, Higgins DG. Clustal W and Clustal X version 2.0. Bioinformatics 23: 2947–2948, 2007. [DOI] [PubMed] [Google Scholar]
- 27.Lee S, Muniyappa R, Yan X, Chen H, Yue LQ, Hong EG, Kim JK, Quon MJ. Comparison between surrogate indexes of insulin sensitivity and resistance and hyperinsulinemic euglycemic clamp estimates in mice. Am J Physiol Endocrinol Metab 294: E261–E270, 2008. [DOI] [PubMed] [Google Scholar]
- 28.Lee YH, Nair S, Rousseau E, Allison DB, Page GP, Tataranni PA, Bogardus C, Permana PA. Microarray profiling of isolated abdominal subcutaneous adipocytes from obese vs non-obese Pima Indians: increased expression of inflammation-related genes. Diabetologia 48: 1776–1783, 2005. [DOI] [PMC free article] [PubMed] [Google Scholar]
- 29.Lim S, Choi SH, Koo BK, Kang SM, Yoon JW, Jang HC, Choi SM, Lee MG, Lee W, Shin H, Kim YB, Lee HK, Park KS. Effects of aerobic exercise training on C1q tumor necrosis factor alpha-related protein isoform 5 (myonectin): association with insulin resistance and mitochondrial DNA density in women. J Clin Endocrinol Metab 97: E88–E93, 2012. [DOI] [PubMed] [Google Scholar]
- 30.Mandal MN, Vasireddy V, Reddy GB, Wang X, Moroi SE, Pattnaik BR, Hughes BA, Heckenlively JR, Hitchcock PF, Jablonski MM, Ayyagari R. CTRP5 is a membrane-associated and secretory protein in the RPE and ciliary body and the S163R mutation of CTRP5 impairs its secretion. Invest Ophthalmol Vis Sci 47: 5505–5513, 2006. [DOI] [PubMed] [Google Scholar]
- 31.Matthews DR, Hosker JP, Rudenski AS, Naylor BA, Treacher DF, Turner RC. Homeostasis model assessment: insulin resistance and beta-cell function from fasting plasma glucose and insulin concentrations in man. Diabetologia 28: 412–419, 1985. [DOI] [PubMed] [Google Scholar]
- 32.McGaugh SE, Gross JB, Aken B, Blin M, Borowsky R, Chalopin D, Hinaux H, Jeffery WR, Keene A, Ma L, Minx P, Murphy D, O'Quin KE, Rétaux S, Rohner N, Searle SM, Stahl BA, Tabin C, Volff JN, Yoshizawa M, Warren WC. The cavefish genome reveals candidate genes for eye loss. Nat Commun 5: 5307, 2014. [DOI] [PMC free article] [PubMed] [Google Scholar]
- 33.Milam AH, Curcio CA, Cideciyan AV, Saxena S, John SK, Kruth HS, Malek G, Heckenlively JR, Weleber RG, Jacobson SG. Dominant late-onset retinal degeneration with regional variation of sub-retinal pigment epithelium deposits, retinal function, and photoreceptor degeneration. Ophthalmology 107: 2256–2266, 2000. [DOI] [PubMed] [Google Scholar]
- 34.Nagle CA, Klett EL, Coleman RA. Hepatic triacylglycerol accumulation and insulin resistance. J Lipid Res 50, Suppl: S74–S79, 2009. [DOI] [PMC free article] [PubMed] [Google Scholar]
- 35.Park SY, Choi JH, Ryu HS, Pak YK, Park KS, Lee HK, Lee W. C1q tumor necrosis factor alpha-related protein isoform 5 is increased in mitochondrial DNA-depleted myocytes and activates AMP-activated protein kinase. J Biol Chem 284: 27780–27789, 2009. [DOI] [PMC free article] [PubMed] [Google Scholar]
- 36.Peterson JM, Aja S, Wei Z, Wong GW. C1q/TNF-related protein-1 (CTRP1) enhances fatty acid oxidation via AMPK activation and ACC inhibition. J Biol Chem 287: 1576–1587, 2012. [DOI] [PMC free article] [PubMed] [Google Scholar]
- 37.Peterson JM, Seldin MM, Wei Z, Aja S, Wong GW. CTRP3 attenuates diet-induced hepatic steatosis by regulating triglyceride metabolism. Am J Physiol Gastrointest Liver Physiol 305: G214–G224, 2013. [DOI] [PMC free article] [PubMed] [Google Scholar]
- 38.Peterson JM, Wei Z, Seldin MM, Byerly MS, Aja S, Wong GW. CTRP9 transgenic mice are protected from diet-induced obesity and metabolic dysfunction. Am J Physiol Regul Integr Comp Physiol 305: R522–R533, 2013. [DOI] [PMC free article] [PubMed] [Google Scholar]
- 39.Peterson JM, Wei Z, Wong GW. C1q/TNF-related protein-3 (CTRP3), a Novel Adipokine That Regulates Hepatic glucose output. J Biol Chem 285: 39691–39701, 2010. [DOI] [PMC free article] [PubMed] [Google Scholar]
- 40.Samuel VT, Petersen KF, Shulman GI. Lipid-induced insulin resistance: unravelling the mechanism. Lancet 375: 2267–2277, 2010. [DOI] [PMC free article] [PubMed] [Google Scholar]
- 41.Scherer PE, Williams S, Fogliano M, Baldini G, Lodish HF. A novel serum protein similar to C1q, produced exclusively in adipocytes. J Biol Chem 270: 26746–26749, 1995. [DOI] [PubMed] [Google Scholar]
- 42.Schmid A, Kopp A, Aslanidis C, Wabitsch M, Muller M, Schaffler A. Regulation and function of C1Q/TNF-related protein-5 (CTRP-5) in the context of adipocyte biology. Exp Clin Endocrinol Diabetes 121: 310–317, 2013. [DOI] [PubMed] [Google Scholar]
- 43.Schmittgen TD, Livak KJ. Analyzing real-time PCR data by the comparative C(T) method. Nat Protoc 3: 1101–1108, 2008. [DOI] [PubMed] [Google Scholar]
- 44.Seldin MM, Lei X, Tan SY, Stanson KP, Wei Z, Wong GW. Skeletal muscle-derived myonectin activates the mTOR pathway to suppress autophagy in liver. J Biol Chem 289: 36073–36082, 2013. [DOI] [PMC free article] [PubMed] [Google Scholar]
- 45.Seldin MM, Peterson JM, Byerly MS, Wei Z, Wong GW. Myonectin (CTRP15), a novel myokine that links skeletal muscle to systemic lipid homeostasis. J Biol Chem 287: 11968–11980, 2012. [DOI] [PMC free article] [PubMed] [Google Scholar]
- 46.Seldin MM, Tan SY, Wong GW. Metabolic function of the CTRP family of hormones. Rev Endocr Metab Disord 15: 111–123, 2014. [DOI] [PMC free article] [PubMed] [Google Scholar]
- 47.Shu X, Luhmann UF, Aleman TS, Barker SE, Lennon A, Tulloch B, Chen M, Xu H, Jacobson SG, Ali R, Wright AF. Characterisation of a C1qtnf5 Ser163Arg knock-in mouse model of late-onset retinal macular degeneration. PLoS One 6: e27433, 2011. [DOI] [PMC free article] [PubMed] [Google Scholar]
- 48.Shu X, Tulloch B, Lennon A, Hayward C, O'Connell M, Cideciyan AV, Jacobson SG, Wright AF. Biochemical characterisation of the C1QTNF5 gene associated with late-onset retinal degeneration. A genetic model of age-related macular degeneration. Adv Exp Med Biol 572: 41–48, 2006. [DOI] [PubMed] [Google Scholar]
- 49.Shu X, Tulloch B, Lennon A, Vlachantoni D, Zhou X, Hayward C, Wright AF. Disease mechanisms in late-onset retinal macular degeneration associated with mutation in C1QTNF5. Hum Mol Genet 15: 1680–1689, 2006. [DOI] [PubMed] [Google Scholar]
- 50.Soumplis V, Sergouniotis PI, Robson AG, Michaelides M, Moore AT, Holder GE, Webster AR. Phenotypic findings in C1QTNF5 retinopathy (late-onset retinal degeneration). Acta Ophthalmol 91: e191–e195, 2013. [DOI] [PubMed] [Google Scholar]
- 51.Subrayan V, Morris B, Armbrecht AM, Wright AF, Dhillon B. Long anterior lens zonules in late-onset retinal degeneration (L-ORD). Am J Ophthalmol 140: 1127–1129, 2005. [DOI] [PubMed] [Google Scholar]
- 52.Sun K, Tordjman J, Clement K, Scherer PE. Fibrosis and adipose tissue dysfunction. Cell Metab 18: 470–477, 2013. [DOI] [PMC free article] [PubMed] [Google Scholar]
- 53.Sunny NE, Parks EJ, Browning JD, Burgess SC. Excessive hepatic mitochondrial TCA cycle and gluconeogenesis in humans with nonalcoholic fatty liver disease. Cell Metab 14: 804–810, 2011. [DOI] [PMC free article] [PubMed] [Google Scholar]
- 54.Tu X, Palczewski K. The macular degeneration-linked C1QTNF5 (S163) mutation causes higher-order structural rearrangements. J Struct Biol 186: 86–94, 2014. [DOI] [PMC free article] [PubMed] [Google Scholar]
- 55.Vincent A, Munier FL, Vandenhoven CC, Wright T, Westall CA, Heon E. The characterization of retinal phenotype in a family with C1QTNF5-related late-onset retinal degeneration. Retina 32: 1643–1651, 2012. [DOI] [PubMed] [Google Scholar]
- 56.Wei Z, Lei X, Petersen PS, Aja S, Wong GW. Targeted deletion of C1q/TNF-related protein 9 (CTRP9) increases food intake, decreases insulin sensitivity, and promotes hepatic steatosis in mice. Am J Physiol Endocrinol Metab 306: E779–E790, 2014. [DOI] [PMC free article] [PubMed] [Google Scholar]
- 57.Wei Z, Peterson JM, Lei X, Cebotaru L, Wolfgang MJ, Baldeviano GC, Wong GW. C1q/TNF-related protein-12 (CTRP12), a novel adipokine that improves insulin sensitivity and glycemic control in mouse models of obesity and diabetes. J Biol Chem 287: 10301–10315, 2012. [DOI] [PMC free article] [PubMed] [Google Scholar]
- 58.Wei Z, Peterson JM, Wong GW. Metabolic regulation by C1q/TNF-related protein-13 (CTRP13): activation OF AMP-activated protein kinase and suppression of fatty acid-induced JNK signaling. J Biol Chem 286: 15652–15665, 2011. [DOI] [PMC free article] [PubMed] [Google Scholar]
- 59.Wei Z, Seldin MM, Natarajan N, Djemal DC, Peterson JM, Wong GW. C1q/tumor necrosis factor-related protein 11 (CTRP11), a novel adipose stroma-derived regulator of adipogenesis. J Biol Chem 288: 10214–10229, 2013. [DOI] [PMC free article] [PubMed] [Google Scholar]
- 60.Wong GW, Krawczyk SA, Kitidis-Mitrokostas C, Ge G, Spooner E, Hug C, Gimeno R, Lodish HF. Identification and characterization of CTRP9, a novel secreted glycoprotein, from adipose tissue that reduces serum glucose in mice and forms heterotrimers with adiponectin. FASEB J 23: 241–258, 2009. [DOI] [PMC free article] [PubMed] [Google Scholar]
- 61.Wong GW, Krawczyk SA, Kitidis-Mitrokostas C, Revett T, Gimeno R, Lodish HF. Molecular, biochemical and functional characterizations of C1q/TNF family members: adipose-tissue-selective expression patterns, regulation by PPAR-gamma agonist, cysteine-mediated oligomerizations, combinatorial associations and metabolic functions. Biochem J 416: 161–177, 2008. [DOI] [PMC free article] [PubMed] [Google Scholar]
- 62.Wong GW, Wang J, Hug C, Tsao TS, Lodish HF. A family of Acrp30/adiponectin structural and functional paralogs. Proc Natl Acad Sci USA 101: 10302–10307, 2004. [DOI] [PMC free article] [PubMed] [Google Scholar]
- 63.Yang WM, Lee W. CTRP5 ameliorates palmitate-induced apoptosis and insulin resistance through activation of AMPK and fatty acid oxidation. Biochem Biophys Res Commun 452: 715–721, 2014. [DOI] [PubMed] [Google Scholar]


