Abstract
The human cervical cancer oncogene (HCCR) has been shown to be over-expressed in some solid tumors, and its function is involved in negative regulation of p53 tumor suppressor gene. However, the roles of HCCR in leukemia remain unclear. The present study is to investigate whether the expression levels of HCCR mRNA are associated with clinical prognosis in patients with acute leukemia (AL) and to explore the potential use as a biomarker for monitoring minimal residual disease (MRD) in AL. The mRNA levels of HCCR1 and HCCR2 were quantified by real-time reverse transcription polymerase chain reaction in bone marrow samples from 80 adult de novo AL patients and 20 normal healthy donors. The expressions of HCCR1 and HCCR2 were significantly higher in patients with acute myeloid leukemia (AML) and acute lymphoblastic leukemia (ALL) than those in healthy donors (P < 0.01), but there was no significant difference between AML and ALL (P > 0.05). Besides white blood cell count, we did not find any significant correlation between HCCR expression and clinical characteristics, such as age, sex, CD34 antigen expression, and response to chemotherapy. HCCR was monitored in 12 cases during remission and/or relapse. Significant reductions of both HCCR1 and HCCR2 mRNA levels were observed in patients who had achieved complete remission after chemotherapy but not in patients with non-responsive. However, an increased HCCR expression was detected in these patients who relapsed. Our findings suggest that HCCR gene is over-expressed in AL patients and may be as a useful biomarker for monitoring MRD in AL.
Keywords: Human cervical cancer oncogene, minimal residual disease, real-time polymerase chain reaction, acute leukemia
Introduction
Acute leukemia (AL) is the most frequent hematologic malignancy that is characterized by an uncontrolled expansion of clonal leukemia cells in the bone marrow (BM) and/or peripheral blood.1,2 AL is generally classified as either acute myeloid leukemia (AML) or acute lymphoblastic leukemia (ALL), and the primary treatments remain remission induction therapy and postremission chemotherapy.3,4 It had been reported that the patients with AL under 60 years old could achieve about 80% complete remission (CR) after induction chemotherapy, but the five-year overall survival rate is only in the range of 30–40%.5,6 Recently, with the introduction of high-dose chemotherapy followed by allogeneic hematopoietic stem cell transplantation (allo-HSCT) and the application of several novel therapeutic agents, significant advances have been made in the outcomes of patients with AL.7–9 However, AL currently remains an incurable malignancy due to the presence of minimal residual disease (MRD). Previous studies have demonstrated that sensitive MRD detection could better estimate the total body burden of leukemic cells and allow for earlier therapeutic intervention prior to overt relapse, which would help to improve clinical outcome of patients with AL.10–14 Currently available MRD targets in AL include recurrent cytogenetic abnormalities, immunoglobulin heavy-chain/T cell receptor rearrangements, and some gene mutations; unfortunately, well-characterized targets are lacking in many patients with AL.15 It is therefore highly desirable to identify novel biomarkers of leukemic cells for monitoring MRD in patients with AL.
The human cervical cancer oncogene (HCCR) was first identified by Ko et al.16 from human cervical tissue through differential display reverse transcription polymerase chain reaction (RT-PCR) method. The HCCR gene maps to the long arm of chromosome 12 and is classified into two species: HCCR1 (GenBank no.AF195651) and HCCR2 (GenBank no.AF315598) according to their molecular characteristics. Comparative studies have revealed that HCCR2 lacks the exon 1 of HCCR1, and they are normal alternative splicing forms.16,17 Accumulated data demonstrate that HCCR was not only over-expressed in human cervical cancer tissues but also found to have high-level expression in various human malignancies including breast, kidney, stomach, colon, liver, and ovarian cancer.15–21 The functional role of HCCR in tumorigenesis may be related to the negative regulation of the p53 tumor suppressor gene.16,21 HCCR1- or HCCR2-transgenic nude mice could form spontaneous breast cancers, which further confirmed the critical role of HCCR in tumorigenesis.22 Previous study showed that both mRNA and protein of HCCR are markedly increased in leukemia cell lines, such as K562 and HL-60 cells, when compared with normal leukocytes.16 Although several published data have shown that HCCR expression in some solid tumors is correlated to clinical outcome and confirmed it as a good biomarker of monitoring disease progression, its specific role in leukemia remains elusive.18–20
In the present study, we investigated the mRNA levels of HCCR in patients with AL using the real-time RT-PCR method and evaluated whether quantitative detection of HCCR gene is useful for monitoring MRD in AL.
Patients and methods
Clinical samples and cell lines
The study protocol was approved by the Research Ethics Committee at the Second Hospital of Hebei Medical University. BM specimens from patients with AL and adult healthy donors were collected with informed consent in the Second Hospital of Hebei Medical University from 2008 to 2011. A total of 80 patients with newly diagnosed AL (56 AML, 24 ALL) were included in the study according to the criteria revised by the French–American–British classification.23 Patients were between the ages of 18 and 72 years, and the median age was 37 years. Forty-eight patients were men, and 32 were women. Twenty healthy donors were enrolled as control (12 men and 8 women; median age 35). Leukemia cell lines HL-60 and K562 cells, served as HCCR-positive control, were purchased from the Cell Culture Center in Chinese Academy of Medical Sciences (Shanghai, China).
mRNA isolation and cDNA synthesis
Mononuclear cells (MNC) were obtained from EDTA-anticoagulated BM samples using Ficoll density centrifugation. Total RNA was isolated from MNC using the Trizol reagent (Invitrogen, Carlsbad, CA) according to the manufacturer’s instructions, and then cDNA was synthesized from 2 µg total RNA using a first-strand cDNA synthesis kit (Invitrogen, Carlsbad, CA). cDNAs were stored at −20℃ until real-time PCR could be carried out.
Quantitative detection of HCCR by real-time PCR
The PCR primers were designed and synthesized from Invitrogen Life Technologies according to previous literature.19 The primers sequences were as follows: forward primer (AF195651, 58--79): 5′-CAGTCACCCCTGGACATTTTGT-3′ and reverse primer (AF195651, 175--152): 5′-AAGTTCTTCACATCTGCCTTTG GA-3′ for human HCCR1; forward primer (AF315598, 1081--1100): 5′-GGAGGCA GAGAGAGGAGCAG-3′ and reverse primer (AF315598, 1184--1161): 5′-AGCAAG AGGGTTTGTTTCAGTTCT-3′ for human HCCR2; forward primer (BC014085, 1087-1107): 5′-CCCATCACCATCTTCCAGGAG-3′ and reverse primer (BC014085, 1371--1351): 5′-GTTGTCATGGATGACCTTGGC-3′ for the internal control glyceraldehyde-3-phosphate dehydrogenase (GAPDH). The assay was carried out in a 25 µL reaction mixture containing 12.5 µL of 2× SYBR Green Reaction Mix (KCl 100 mM, MgCl2 4 mM, per dNTP 400 µM, Taq DNA polymerase 0.2 U/µL), 2 µL of each primer (final concentration 0.2 µM), 2 µL of template cDNA, and 6.5 µL of double distilled water. The PCR amplification protocol was as follows: an initial denaturation step started with 5-min incubation at 94℃. Three-step PCR cycles (n = 40) consisted of 30-s melt at 94℃ followed by annealing for 20 s at 60℃, and an extension for 30 s at 72℃. Data were collected at 60℃ for 30 s. The mRNA levels of HCCR1, HCCR2, and GAPDH were detected using ABI 7900 (Applied Biosystems, Sunnyvale, CA) and SYBR Green chemistry. Amplification products were analyzed by melting curve data analysis. The relative quantitation of target genes was calculated with the 2−ΔΔCT formula by the comparative cycle threshold (Ct) value method.24 Real-time RT-PCR assays were performed in triplicate.
Treatment regimens and responses to treatment
The induction therapy for AML patients was the standard DA or IA (daunorubicin/idarubicin plus Ara-C) regimens. The induction therapy for ALL patients included the following: the VDLP (vincristine, daunorubicin, L-asparaginase, prednisone) regimen, VILP (vincristine, idarubicin, L-asparaginase, prednisone) regimen, and the VCDLP (vincristine, cyclophosphamide, daunorubicin, L-asparaginase, prednisone) regimen. The patients with acute promyelocytic leukemia were treated with all-trans-retinoic acid and/or arsenic trioxide.
CR was defined as a BM aspirate that showed trilineage regeneration with less than 5% blasts by morphological and immunochemical analyses, in the presence of a normal blood cells count that persisted for at least one month, and no evidence of extramedullary leukemia. All other patients were considered as non-responsive (NR). Relapse was defined as the presence of at least one of the following: recurrence of more than 10% leukemic cells in BM or any leukemic cells in PB or extramedullary sites.
Statistical analysis
All statistical data are presented as mean ± standard deviation (SD). Statistical comparisons between groups were conducted using independent samples t-test. Pearson’s correlation was used to evaluate the correlation between paired values. All analyses were performed using GraphPad Prism Version 5.0 (San Diego, CA, USA) and P < 0.05 was considered statistically significant.
Results
Expression of HCCR1 and HCCR2 mRNA in AL
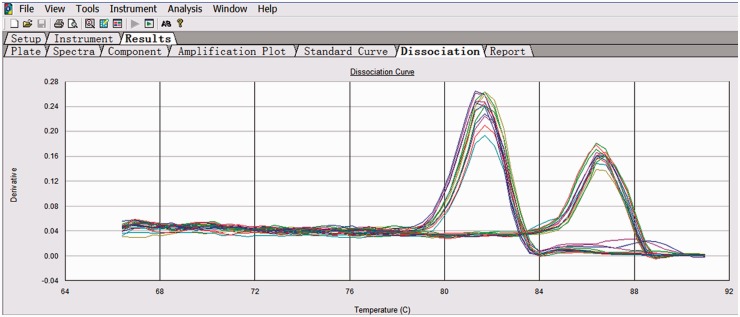
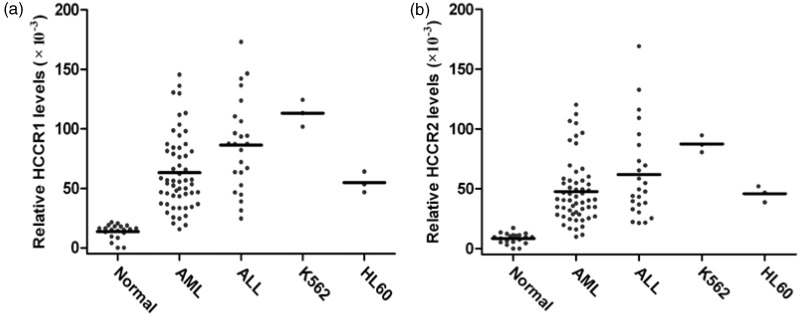
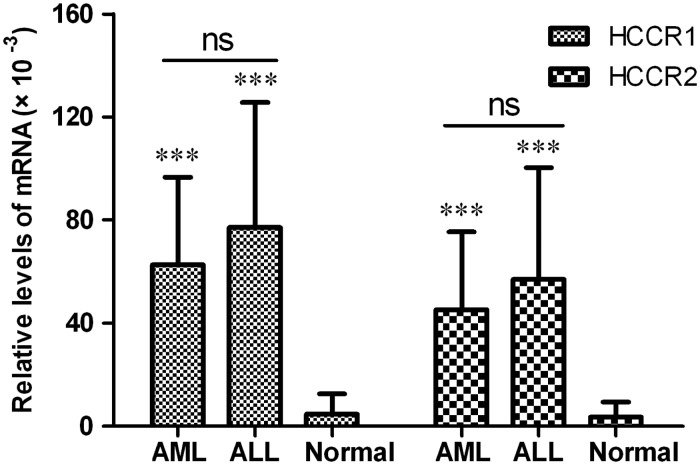
The melting curve image for HCCR and GAPDH is shown in Figure 1. The specificities of HCCR and GAPDH amplification were confirmed by analyzing the dissociation curves with the values of Tm 81.7℃ and 86.5℃, respectively. The relative levels of HCCR1 and HCCR2 mRNA in 80 patients with newly diagnosed AL, 20 normal healthy donors, and leukemia cell lines (K562 and HL60) are shown in Figure 2. Fifty (89.3%) of 56 AML cases and 20 (83.3%) of 24 ALL cases were positive for HCCR1, and 47 (83.9%) of 56 AML cases and 19 (79.2%) of 24 ALL cases were positive for HCCR2. Relative mRNA levels of HCCR1 and HCCR2 in AML patient were (60.9 ± 34.9) × 10−3 and (44.6 ± 30.1) × 10−3, respectively. Similarly, the relative mRNA levels of HCCR1 and HCCR2 in ALL patient was (76.9 ± 49.8) × 10−3 and (58.1 ± 42.8) × 10−3, respectively. In normal controls, no specific amplification products or only low level mRNA of HCCR1 and/or HCCR2 were detected out. There was a significant difference for HCCR1 and HCCR2 mRNA levels in patients with AL and normal controls (P < 0.001). However, no significant difference was observed in HCCR1 and HCCR2 levels between ALL and AML cases (Figure 3).
Figure 1.
The melting curve image for HCCR and GAPDH
Figure 2.
Levels of HCCR1 and HCCR2 mRNA in normal donors, patients with acute leukemia, and leukemia cell lines. HCCR expression was detected by real-time PCR, and the mRNA levels were normalized for GAPDH mRNA
AML: acute myeloid leukemia; ALL: acute lymphoblastic leukemia; Normal: normal healthy donor; K562: leukemia cell line derived from human chronic myelogenous cells in blastic crisis; HL60: leukemia cell line derived from human promyelocytic leukemia cells
Figure 3.
Comparisons of HCCR1 and HCCR2 levels between ALL and AML cases
Values represent the means ± standard deviation (SD). Analyzed by independent samples t-test, ***p < 0.001, with respect to normal control; ns: not significant
Relationship between clinical data and expression of HCCR1 and HCCR2
We investigated the correlation between expression levels of HCCR1 and HCCR2 mRNA and age, gender, white blood cell (WBC) count, CD34 antigen expression, and cytogenetics in 80 patients with AL. The clinical characteristics and the HCCR1 and HCCR2 mRNA levels of these patients were outlined in Table 2. No significant correlation was found between expression levels of HCCR1 or HCCR2 mRNA and patients’ age, gender, and the expression of CD34 antigen, whereas a significant positive correlation was noted between expression of either HCCR1 or HCCR2 mRNA and initial WBC count. Moreover, HCCR1 and HCCR2 expression was observed to be higher in the patients with abnormal karyotypes than in those with normal ones (P < 0.01).
Table 2.
Relationship between HCCR1 and HCCR2 expression and clinical features
| Clinical characteristics | No. of cases | HCCR1 (×10−3) | P | HCCR2 (×10−3) | P | |
|---|---|---|---|---|---|---|
| Age | ≤60 | 52 | 74.2 ± 45.6 | 0.290 | 59.7 ± 47.2 | 0.079 |
| >60 | 28 | 63.4 ± 39.3 | 41.2 ± 38.3 | |||
| Gender | M | 48 | 71.5 ± 38.5 | 0.647 | 52.3 ± 33.4 | 0.668 |
| F | 32 | 67.1 ± 46.6 | 48.3 ± 41.7 | |||
| WBC count (×109) | ≤10 | 27 | 36.4 ± 25.4 | <0.01 | 21.2 ± 16.5 | <0.01 |
| >10 | 53 | 101.8 ± 62.3 | 79.8 ± 54.8 | |||
| LDH | Normal | 16 | 65.7 ± 34.1 | 0.517 | 44.7 ± 31.5 | 0.312 |
| >Normal | 64 | 72.9 ± 40.8 | 56.2 ± 42.3 | |||
| CD34 expression | ≤20% | 43 | 71.3 ± 38.8 | 0.637 | 56.1 ± 47.6 | 0.238 |
| >20% | 37 | 67.4 ± 34.2 | 44.5 ± 38.2 | |||
| Karyotype | Normal | 46 | 42.7 ± 31.5 | <0.01 | 28.6 ± 23.9 | <0.01 |
| Abnormal | 29 | 94.8 ± 54.6 | 70.5 ± 59.3 | |||
WBC: white blood cell; LDH: lactate dehydrogenase.
The values of HCCR1 and HCCR2 are referring to the relative quantitation of that to GAPDH.
HCCR1 and HCCR2 mRNA expression and clinical prognosis of AL patients
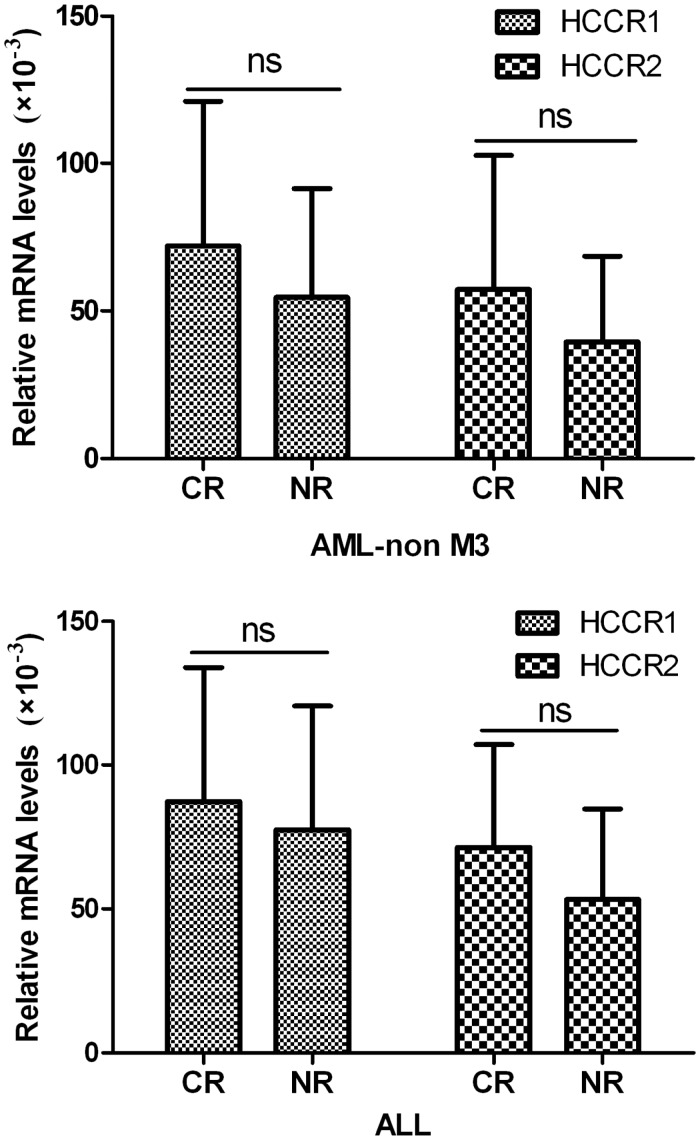
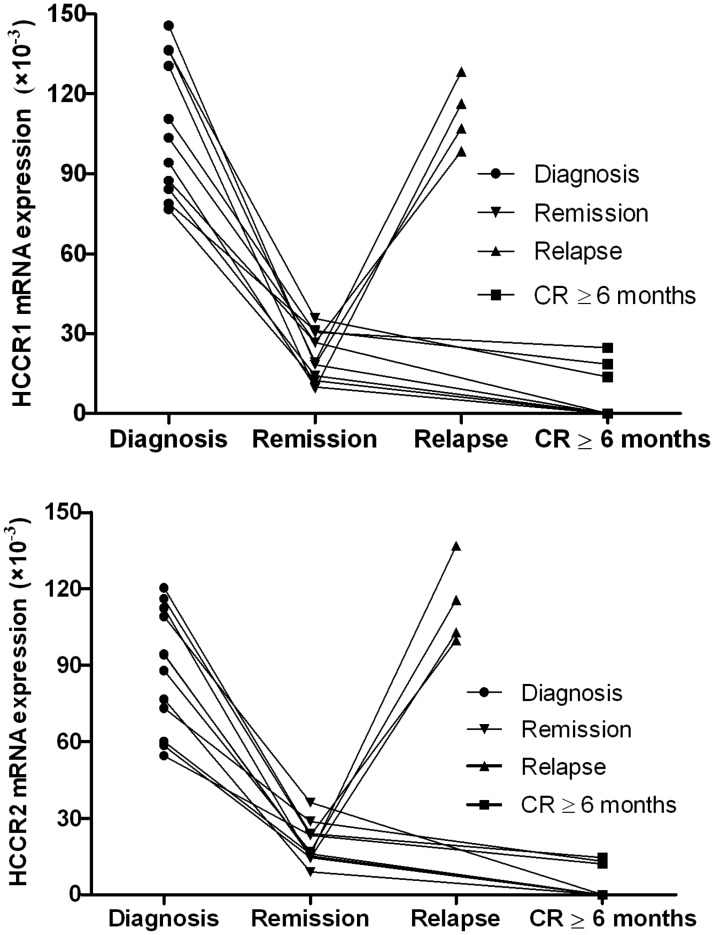
In 44 de novo patients with non-M3-AML, 28 patients (63.6%) achieved a CR, and 16 patients (36.4%) are NR after initial induction chemotherapy. The HCCR1 and HCCR2 levels in CR and NR patients at diagnosis were (72.1 ± 48.9) × 10−3 and (57.3 ± 45.4) × 10−3, as well as (54.7 ± 36.8) × 10−3 and (39.5 ± 28.9) × 10−3, respectively. In 24 patients with newly diagnosed ALL, 17 patients (70.8%) with CR and seven patients (29.2%) with NR after initial induction chemotherapy. The HCCR1 and HCCR2 levels in CR and NR patients at diagnosis were (87.3 ± 46.7) × 10−3 and (71.4 ± 35.8) × 10−3, as well as (77.5 ± 43.2) × 10−3 and (53.2 ± 31.5) × 10−3, respectively. Either non-M3-AML or ALL, no marked difference was observed in HCCR1 and HCCR2 levels between CR and NR cases (Figure 4). Additionally, we had also monitored the HCCR1 and HCCR2 mRNA levels during remission and/or relapse in 12 cases. Among these, HCCR1 and HCCR2 levels, without any exception, decreased at remission and increased again at relapses. Five cases with CR more than six months (3 AML and 2 ALL) were even found to be 0. More importantly, the expression of HCCR1 and HCCR2 increased again in four relapse cases, and the increase of HCCR in these patients is obviously earlier than his cytology relapse. Figure 5 shows the HCCR1 and HCCR2 mRNA levels during remission and/or relapse.
Figure 4.
Correlations between expression levels of HCCR1 and HCCR2 mRNA and response to initial induction chemotherapy
Values represent the means ± standard deviation (SD). Analyzed by independent samples t-test; ns: not significant; CR: complete remission; NR: non-responsive
Figure 5.
The levels of HCCR1 and HCCR2 mRNA during remission and/or relapse
Discussion
Relapse originating from MRD is the major obstacle for doctor to cure in leukemia. For this reason, precise monitoring and early treatment of MRD before relapse occurs are the best strategies to conquer relapse. Additionally, monitoring of MRD is also useful to guide therapeutic regimen, assess early treatment response, and predict prognosis.10,14,25 Currently, several methods for detecting MRD, such as the assay of chromosomal aberrations by fluorescence in situ hybridization (FISH), immunophenotype analysis of leukemic cells using multiparameter flow cytometry (FCM), and the quantitative examination of fusion genes, gene mutations/rearrangements, and over-expressed genes associated with leukemia by real-time PCR, have been developed and widely applied in clinical practice.15,26,27 Among these, real-time PCR has proved to be the most sensitive techniques (10−4 to 10−5) for MRD follow-up with a high specificity, which is superior to that of FISH or FCM. However, there are some limitations to the application of real-time PCR in leukemia because most of patients with AL lack the specific genetic markers, such as AML1/ETO PML/RARa, inv(16), and BCR/ABL. As a result, it is crucial to identify new widely expressed specific targets in patients with AL, especially for whom standard screening strategies fail to find a recurrent genetic marker.
To our knowledge, HCCR is negative in BM and/or peripheral blood cells isolated from healthy donors. In the present study, although weak HCCR1 and/or HCCR2 mRNA has also been detected out in some normal BM samples by real-time RT-PCR, it is not a problem to distinguish the leukemia-associated expression from healthy individuals. We found very low HCCR1 (13.7 ± 4.6) × 10−3 and HCCR2 (8.4 ± 4.9) × 10−3 levels in 20 healthy subjects, and this difference was found to be highly significant between patients with AL and normal controls (P < 0.001). We investigated the expression of HCCR mRNA in AL and the possibility of using HCCR as a useful biomarker for patients with AL. Our findings showed that HCCR mRNA is abnormally increased in both AML and ALL patients when compared with normal control group, while neither HCCR1 nor HCCR2 expression is significantly different between AML and ALL cases. Although HCCR gene was confirmed to be a pan-tumor expressed oncogene, it can not be considered as a biomarker to distinguish between AML and ALL.
We further examined whether HCCR mRNA expression in patients with AL is related to different clinical parameters. The results indicated that the level of HCCR mRNA in patients with AL is relatively well correlated with known factors, including the initial WBC count and cytogenetics, but no apparent correlation was found between expression of either HCCR1 or HCCR2 mRNA and response to initial chemotherapy. According to currently available data, HCCR has not been regarded as a poor prognostic indicator in AL. Further studies are required to ascertain whether HCCR gene influences the long-term prognosis of patients, especially progression-free survival and overall survival. Importantly, a significant decline or disappearance in HCCR1 and/or HCCR2 expression after the achievement of CR and recurrence or re-increase before overt cytological relapse are observed in patients with AL. These findings suggest that HCCR may be a good candidate to determine MRD and to predict relapse before morphologic relapse and even molecular relapse.
The function of HCCR gene and its protein is not yet clear. Accumulated data indicate that over-expression of HCCR gene is involved in tumor development and progression in a variety of malignant tumors. The role for HCCR gene in cancer early diagnosis and aggressiveness has been elucidated through efforts to examine HCCR1 and HCCR2 mRNA in both benign diseases and cancer. HCCR is over-expressed in hepatocellular carcinoma compared with the non-tumorous cirrhosis tissues but is undetectable in normal liver tissue.18 Jung et al.19 reported that the assay of HCCR oncoprotein had an advantage over carbohydrate antigen 15-3 (CA15-3) in diagnosing the early stages of breast cancer. Ha et al.20 found that HCCR1 was elevated in breast cancer cells and tissues compared with normal breast tissues, and suggesting the level of HCCR1 is relatively well correlated with known breast cancer factors, including the HER2 over-expression, p53 mutation, and ER/PR status. A previous report by Cho et al.28 indicated that uncontrolled HCCR1 expression may cause mitochondrial dysfunction, which lead to resistance of UVC-induced apoptosis and cancer development. Several studies have demonstrated that HCCR1 oncogene expression was regulated by the PI3K/Akt signaling pathway, and the EGF-induced HCCR1 over-expression via PI3K/AKT/mTOR signaling plays a pivotal role in pancreatic tumor progression.29,30 In our previous work, silencing HCCR2 by siRNA in vitro significantly suppressed cell proliferation, induced G1 cell cycle arrest, and promoted the apoptosis in K562 leukemia cells.31 However, the exact implications of HCCR over-expression in leukemia cells in vivo remain unknown. In the present study, we found that the expression of HCCR was much higher in AL patients with chromosomal abnormalities than in those with normal chromosomes. It is well known that abnormal karyotype often resulted in the emergence of oncoproteins, which generally involved in the intracellular signaling pathways. Thus, we speculate that HCCR protein may play an important role in the intracellular signalling pathways, regulating cellular proliferation, differentiation, and apoptosis in leukemia cells. Based on our findings, the HCCR gene appears to be important in the tumorigenesis of AL and may be a potential therapeutic target.
In conclusion, our present results found that HCCR was universally expressed leukemia gene. The expression levels of both HCCR1 and HCCR2 are useful biomarker for monitoring MRD in patients with AL, particularly for those individuals without known specific genetic markers. Although the precise mechanisms remain unclear, further studies are required to definite HCCR as a novel molecular target for the therapy of leukemia.
Table 1.
Summary of both AML and ALL patients’ characteristics
| Characteristics | AML (n = 56, 70%) | ALL (n = 24, 30%) | ||
|---|---|---|---|---|
| Age at diagnosis, year | Range: 18–72 | Median: 41 | Range: 18–69 | Median: 34 |
| Sex, n (%) | Female, 22 (39.3) | Male, 34 (60.7) | Female, 10 (41.7) | Male, 14 (58.3) |
| WBC count (×109/L) | Range: 0.8–214 | Median: 26.8 | Range: 2.4–230 | Median: 33.5 |
| Hemoglobin (g/L) | Range: 52–132 | Median: 83 | Range: 46–108 | Median: 89 |
| Platelet count (×109/L) | Range: 3–208 | Median: 52 | Range: 9–214 | Median: 46 |
| Serum LDH (U/L) | Range: 156–2401 | Median: 379 | Range: 356–2876 | Median: 501 |
| Bone marrow blasts (%) | Range: 20–98.5 | Median: 64 | Range: 26–94 | Median: 72 |
| Extramedullary disease, n (%) | Yes, 7 (12.5) | No, 49 (87.5) | Yes, 5 (20.8) | No, 19 (79.2) |
| Karyotype, n (%) (available: n = 75) | Normal, 32 (60.4) | Abnormal, 21 (39.6) | Normal, 14 (63.6) | Abnormal, 8 (36.4) |
WBC: white blood cell; AML: acute myeloid leukemia; ALL: acute lymphoblastic leukemia; LDH: lactate dehydrogenase.
ACKNOWLEDGEMENTS
This study was supported by the Foundation of Hebei Province Health Bureau (No. 06166).
Author contributions
SKQ was responsible for experimental design and performed research, analysis, and interpretation of the results; drafted the manuscript; and provided final approval of the version to be published. XNG participated in the design of the study and provided general support. All other authors treated patients at the Department of Hematology, the Second Hospital of Hebei Medical University. All authors read and approved the final manuscript.
REFERENCES
- 1.Ferrara F, Schiffer CA. Acute myeloid leukaemia in adults. Lancet 2013; 381: 484–95. [DOI] [PubMed] [Google Scholar]
- 2.Inaba H, Greaves M, Mullighan CG. Acute lymphoblastic leukaemia. Lancet 2013; 381: 1943–55. [DOI] [PMC free article] [PubMed] [Google Scholar]
- 3.Roboz GJ. Current treatment of acute myeloid leukemia. Curr Opin Oncol 2012; 24: 711–19. [DOI] [PubMed] [Google Scholar]
- 4.Jeha S. New therapeutic strategies in acute lymphoblastic leukemia. Semin Hematol 2009; 46: 76–88. [DOI] [PubMed] [Google Scholar]
- 5.Kimby E, Nygren P, Glimelius B, SBU-group. A systematic overview of chemotherapy effects in acute myeloid leukaemia. Acta Oncol 2001; 40: 231–52. [DOI] [PubMed] [Google Scholar]
- 6.Rowe JM, Buck G, Burnett AK, Chopra R, Wiernik PH, Richards SM, Lazarus HM, Franklin IM, Litzow MR, Ciobanu N, Prentice HG, Durrant J, Tallman MS, Goldstone AH. Induction therapy for adults with acute lymphoblastic leukemia: results of more than 1500 patients from the international ALL trial: MRC UKALL XII/ECOG E2993. Blood 2005; 106: 3760–7. [DOI] [PubMed] [Google Scholar]
- 7.Hamilton BK, Copelan EA. Concise review: the role of hematopoietic stem cell transplantation in the treatment of acute myeloid leukemia. Stem Cells 2012; 30: 1581–86. [DOI] [PubMed] [Google Scholar]
- 8.Khaled SK, Thomas SH, Forman SJ. Allogeneic hematopoietic cell transplantation for acute lymphoblastic leukemia in adults. Curr Opin Oncol 2012; 24: 182–90. [DOI] [PMC free article] [PubMed] [Google Scholar]
- 9.Ungewickell A, Medeiros BC. Novel agents in acute myeloid leukemia. Int J Hematol 2012; 96: 178–85. [DOI] [PubMed] [Google Scholar]
- 10.Chung NG, Buxhofer-Ausch V, Radich JP. The detection and significance of minimal residual disease in acute and chronic leukemia. Tissue Antigens 2006; 68: 371–5. [DOI] [PubMed] [Google Scholar]
- 11.Béné MC, Kaeda JS. How and why minimal residual disease studies are necessary in leukemia: a review from WP10 and WP12 of the European Leukaemia Net. Haematologica 2009; 94: 1135–50. [DOI] [PMC free article] [PubMed] [Google Scholar]
- 12.Kern W, Haferlach C, Haferlach T, Schnittger S. Monitoring of minimal residual disease in acute myeloid leukemia. Cancer 2008; 112: 4–16. [DOI] [PubMed] [Google Scholar]
- 13.Campana D. Minimal residual disease in acute lymphoblastic leukemia. Semin Hematol 2009; 46: 100–6. [DOI] [PMC free article] [PubMed] [Google Scholar]
- 14.Brüggemann M, Gökbuget N, Kneba M. Acute lymphoblastic leukemia: monitoring minimal residual disease as a therapeutic principle. Semin Oncol 2012; 39: 47–57. [DOI] [PubMed] [Google Scholar]
- 15.Jancuskova T, Plachy R, Stika J, Zemankova L, Hardekopf DW, Liehr T, Kosyakova N, Cmejla R, Zejskova L, Kozak T, Zak P, Zavrelova A, Havlikova P, Karas M, Junge A, Ramel C, Pekova S. A method to identify new molecular markers for assessing minimal residual disease in acute leukemia patients. Leuk Res 2013; 37: 1363–73. [DOI] [PubMed] [Google Scholar]
- 16.Ko J, Lee YH, Hwang SY, Lee YS, Shin SM, Hwang JH, Kim J, Kim YW, Jang SW, Ryoo ZY, Kim IK, Namkoong SE, Kim JW. Identification and differential expression of novel human cervical cancer oncogene HCCR-2 in human cancers and its involvement in p53 stabilization. Oncogene 2003; 22: 4679–89. [DOI] [PubMed] [Google Scholar]
- 17.Chung YJ, Kim JW. Novel oncogene HCCR: its diagnostic and therapeutic implications for cancer. Histol Histopathol 2005; 20: 999–1003. [DOI] [PubMed] [Google Scholar]
- 18.Yoon SK, Lim NK, Ha SA, Park YG, Choi JY, Chung KW, Sun HS, Choi MJ, Chung J, Wands JR, Kim JW. The human cervical cancer oncogene protein is a biomarker for human hepatocellular carcinoma. Cancer Res 2004; 64: 5434–41. [DOI] [PubMed] [Google Scholar]
- 19.Jung SS, Park HS, Lee IJ, Namkoong H, Shin SM, Cho GW, Ha SA, Park YG, Lee YS, Ko J, Kim JW. The HCCR oncoprotein as a biomarker for human breast cancer. Clin Cancer Res 2005; 11: 7700–8. [DOI] [PubMed] [Google Scholar]
- 20.Ha SA, Lee YS, Shin SM, Kim HK, Kim S, Namkoong H, Kim HJ, Jung SM, Lee YS, Chung YJ, Jung SS, Kim JW. Oncoprotein HCCR-1 expression in breast cancer is well correlated with known breast cancer prognostic factors including the HER2 overexpression, p53 mutation, and ER/PR status. BMC Cancer 2009; 9: 51–51. [DOI] [PMC free article] [PubMed] [Google Scholar]
- 21.Ha SA, Shin SM, Lee YJ, Kim S, Kim HK, Namkoong H, Lee H, Lee YS, Cho YS, Park YG, Jeon HM, Oh C, Kim JW. HCCRBP-1 directly interacting with HCCR-1 induces tumorigenesis through P53 stabilization. Int J Cancer 2008; 122: 501–8. [DOI] [PubMed] [Google Scholar]
- 22.Ko J, Shin SM, Oh YM, Lee YS, Ryoo ZY, Lee YH, Na DS, Kim JW. Transgenic mouse model for breast cancer: induction of breast cancer in novel oncogene HCCR-2 transgenic mice. Oncogene 2004; 23: 1950–3. [DOI] [PubMed] [Google Scholar]
- 23.Bennett JM, Catovsky D, Daniel MT, Flandrin G, Galton DA, Gralnick HR, Sultan C. Proposed revised criteria for the classification of acute myeloid leukemia. A report of the French-American- British Cooperative Group. Ann Intern Med 1985; 103: 620–5. [DOI] [PubMed] [Google Scholar]
- 24.Schmittgen TD, Livak KJ. Analyzing real-time PCR data by the comparative C (T) method. Nat Protoc 2008; 3: 1101–8. [DOI] [PubMed] [Google Scholar]
- 25.Buccisano F, Maurillo L, Del Principe MI, Del Poeta G, Sconocchia G, Lo- Coco F, Arcese W, Amadori S, Venditti A. Prognostic and therapeutic implications of minimal residual disease detection in acute myeloid leukemia. Blood 2012; 119: 332–41. [DOI] [PubMed] [Google Scholar]
- 26.Matsuda K, Sugano M, Honda T. PCR for monitoring of minimal residual disease in hematologic malignancy. Clin Chim Acta 2012; 413: 74–80. [DOI] [PubMed] [Google Scholar]
- 27.Rossi G, Minervini MM, Carella AM, de Waure C, di Nardo F, Melillo L, D'Arena G, Zini G, Cascavilla N. Comparison between multiparameter flow cytometry and WT1-RNA quantification in monitoring minimal residual disease in acute myeloid leukemia without specific molecular targets. Leuk Res 2012; 36: 401–6. [DOI] [PubMed] [Google Scholar]
- 28.Cho GW, Shin SM, Kim HK, Ha SA, Kim S, Yoon JH, Hur SY, Kim TE, Kim JW. HCCR-1, a novel oncogene, encodes a mitochondrial outer membrane protein and suppresses the UVC-induced apoptosis. BMC Cell Biol 2007; 8: 50–50. [DOI] [PMC free article] [PubMed] [Google Scholar]
- 29.Cho GW, Shin SM, Namkoong H, Kim HK, Ha SA, Hur SY, Kim TE, Chai YG, Kim JW. The phosphatidylinositol 3-kinase/Akt pathway regulates the HCCR-1 oncogene expression. Gene 2006; 384: 18–26. [DOI] [PubMed] [Google Scholar]
- 30.Xu Z, Zhang Y, Jiang J, Yang Y, Shi R, Hao B, Zhang Z, Huang Z, Kim JW, Zhang G. Epidermal growth factor induces HCCR expression via PI3K/Akt/mTOR signaling in PANC-1 pancreatic cancer cells. BMC Cancer 2010; 10: 161–161. [DOI] [PMC free article] [PubMed] [Google Scholar]
- 31.Qiao SK, Ren HY, Shi YJ, Liu W. Silencing HCCR2 expression inhibits the proliferation of leukemia cells by inducing apoptosis and promoting cell cycle arrest. Int J Mol Med 2013; 32: 1373–9. [DOI] [PubMed] [Google Scholar]


