Abstract
Insulin resistance is often characterized as the most critical factor contributing to the development of type 2 diabetes mellitus (T2DM). Sustained high glucose is an important extracellular environment that induces insulin resistance. Acquired insulin resistance is associated with reduced insulin-stimulated mitochondrial activity as a result of increased mitochondrial dysfunction. Silent information regulator 1 (SIRT1) is one member of the SIRT2 (Sir2)-like family of proteins involved in glucose homeostasis and insulin secretion in mammals. Although SIRT1 has a therapeutic effect on metabolic deterioration in insulin resistance, it is still not clear how SIRT1 is involved in the development of insulin resistance. Here, we demonstrate that pcDNA3.1 vector-mediated overexpression of SIRT1 attenuates insulin resistance in the high glucose-induced insulin-resistant skeleton muscle cells. These beneficial effects were associated with ameliorated mitochondrial dysfunction. Further studies have demonstrated that SIRT1 restores mitochondrial complex I activity leading to decreased oxidative stress and mitochondrial dysfunction. Furthermore, SIRT1 significantly elevated the level of another SIRT which is named SIRT3, and SIRT3 siRNA-suppressed SIRT1-induced mitochondria complex activity increments. Taken together, these results showed that SIRT1 improves insulin sensitivity via the amelioration of mitochondrial dysfunction, and this is achieved through the SIRT1–SIRT3–mitochondrial complex I pathway.
Keywords: Insulin resistance, high glucose, silent information regulator 1, mitochondrial dysfunction, skeletal muscle cells
Introduction
Insulin resistance, the resistance of target tissues (e.g., skeletal muscle, fat, and liver) to insulin stimulation, is a frequent feature in type 2 diabetes mellitus (T2DM). Skeletal muscle is one of the major target organs of insulin action and plays an essential role in insulin-induced glucose uptake.1 Mitochondrial dysfunction is another feature of T2DM. Numerous literatures have demonstrated that mitochondrial dysfunction is implied in insulin resistance and T2DM.2–5 In addition, mitochondrial abnormalities may accelerate the progression of insulin resistance and subsequent organ dysfunction via the increased production of reactive oxygen species (ROS).2 The mitochondrial complex I has been shown to be the main site of ROS production.6 Research has shown that the skeletal muscle mitochondrial complex I activity in the T2DM cohort is significantly lower than the corresponding activity for the normal cohort. This phenomenon indicates that mitochondrial complex I activity may play a more important role than other mitochondrial functions in the development of insulin resistance. Hyperglycemia is also a common feature in T2DM, and sustained hyperglycemia induces insulin resistance.7 Previous work indicated that high glucose levels induce insulin resistance.8 However, the precise mechanism of high glucose-induced insulin resistance is still incompletely understood.
Silent information regulator 1 (SIRT1), also known as Nicotinamide adenine dinucleotide (NAD)-dependent deacetylase sirtuin-1, is a member of a class of highly conserved proteins that have evolved in a variety of metabolic functions regulation, in particular playing a crucial role in glucose homeostasis in mammals.9 Numerous studies have demonstrated that SIRT1 alleviates insulin resistance by improving insulin sensitivity under insulin-resistant conditions.9–11 Although SIRT1 has a therapeutic effect on insulin resistance,12 the precise mechanisms by which SIRT1 improves insulin resistance remain unclear. It is worth noting that SIRT1 plays a key role in alleviating mitochondrial dysfunction and oxidative stress.13 Our previous work showed that resveratrol, an activator of SIRT1, attenuates high-fat diet-induced insulin resistance by influencing skeletal muscle lipid transport and mitochondrial beta-oxidation.14 Considering that SIRT1 agonists can still affect other insulin-important target organs,15 there is an urgent need to increase the specificity of SIRT1 in skeletal muscle, explore new ideas in internal relations, and identify the exact mechanism between SIRT1, mitochondrial dysfunction, and insulin sensitivity.
In this study, we directly investigated the effect of upregulating SIRT1 expression on insulin sensitivity in skeletal muscle cells under high glucose levels. Our data revealed that SIRT1 decreases high glucose-induced insulin resistance by alleviating mitochondrial dysfunction and oxidative stress through the SIRT1–SIRT3–mitochondrial complex I pathway. Our findings represent a potential therapeutic approach for preventing or treating insulin resistance and T2DM.
Materials and methods
Cell lines and cell culture
The mouse myoblast cell line C2C12 was purchased from the American Type Culture Collection. It was cultured in normal (5 mmol/L) or high (20 mmol/L) glucose-modified Dulbecco’s modified Eagle’s medium (DMEM) supplemented with 10% bovine serum albumin in an incubator with 5% CO2 at 37℃. The cells were passaged every three days. The cells were maintained in an incubator until 90% confluence; there after the cells were differentiated into myotubes in DMEM containing 2% horse serum (v/v; JRH Biosciences, Lenexa, KS, USA), and the medium was replaced every two days. Experiments were conducted after four to seven days of differentiation.
Construction of expression vectors and cell transfection
Total RNA was isolated from C2C12 cells using TRIzol reagent (Invitrogen, Carlsbad, CA, USA), based on the manufacturer’s instructions. The cDNA was synthesized by reverse transcription of total RNA, using the Prime Script® RT reagent kit (Takara, Dalian, China) with oligo-dT primers, according to the manufacturer’s protocol. Then, the open reading frame of SIRT1 cDNA was cloned and inserted into the pcDNA3.1 vector (Invitrogen, Carlsbad, CA, USA), namely pcDNA3.1-SIRT1 expression vector. The pcDNA3.1 vector alone transfected cells were used as negative control. For cell transfection, cells were cultured to 60% confluences; cell transfection was performed using the FuGENE HD transfection reagent (Roche, Indianapolis, IN) methods, as suggested by the manufacturer.
siRNA transfection
SIRT3 siRNA was purchased from Santa Cruz. The scramble siRNA was used as a negative control (con-siRNA). For cell transfection, 5 × 10⁴ cells were seeded in each cell of 24-well microplates, and grown for 24 h to reach 50% confluence. Then, each well had a mixture of siRNA and Lipofectamine™ 2000 reagent (Invitrogen, Carlsbad, CA, USA) in 100 -μl serum-free OPTI-MEM added, according to the manufacturer’s instructions. After 4–6 h incubation, the mixture was removed and fresh medium was added. The transfection efficiency was examined by real-time polymerase chain reaction (PCR) and western blotting.
Real-time quantitative PCR
Total RNA and total cDNA were gained as described previously. Real-time quantitative PCR (RT-PCR) reactions were performed on the Rotor-Gene RG-3000 Real-Time Thermal Cycler (Corbett Research, Australia) using SYBR® Premix Ex Taq™ II kit (Takara, Dalian, China). For SIRT1 and SIRT3 expression, the specific PCR primers were used SIRT1: 5′-CTGTTTCCTGTGGGATACCTGACT-3′ (forward), and 5′-ATCGAACATGGCTTGAGGATCT-3′ (reverse); SIRT3: 5′-GGCACTACAGGCCCAATGTC-3′ (forward) and 5′-TCTCTCAAGCCCGTCGATGT-3′ (reverse); β-actin: 5′-CACCCGCGAGTACAACCTTC-3′ (forward), and 5′-CCCATACCCACCATCACACC′ (reverse). These primers were all synthesized by Takara Biotechnology (Dalian) Co., Ltd. The PCR procedure was as follows: polymerase activation for 30 s at 95℃, 40 cycles of amplification each consisting of 95℃ for 5 s, 60℃ for 20 s, and 1 cycle of dissociation consisting of 95℃ for 15 s, 60℃ for 30 s, and 95℃ for 15 s. For mitochondrial DNA (mtDNA) copy number, total DNA was isolated using a Dneasy kit (Qiagen, Mississauga, ON, USA), according to the manufacturer’s instructions. Relative mtDNA copy number was determined by RT-PCR analysis of the ratio of mitochondrial encoded and nuclear-encoded genes. All reactions were performed in triplicate, fluorescence data were analyzed using the Rotor-Gene 6 Software (version 6.0, Corbett Research). The mRNA expression was normalized to β-actin and reported as arbitrary units.
Western blotting
The proteins were extracted from cells using radioimmunoprecipitation assay lysis buffer (Beyotime, Nantong, China). For western blotting, proteins were subjected to sodium dodecyl sulfate polyacrylamide gel electrophoresis and transferred to the nitrocellulose membrane (GE healthcare, Freiburg, Germany), followed by blocking of the membranes in 10% nonfat milk in PBS at 4℃ overnight; these were then immunoblotted with different primary antibodies. The primary antibodies are as follows: mouse anti-SIRT1, anti-SIRT3, and anti-glyceraldehyde-3-phosphate dehydrogenase (GAPDH) monoclonal antibody (Santa Cruz, CA, USA). After washing with Tris-Buffered Saline Tween-2 (TBST) buffer, the membranes were incubated for 1 h at 25℃ with Horseradish peroxidase (HRP)-conjugated secondary antibody (KangChen Bio-tech, Shanghai, China). The ECL reagents (Beyotime, Nantong, China) were using for detection. Fluorescence was scanned using the Typhoon scanner (Amersham Biosciences, Piscataway, NJ, USA). All experiments were performed in triplicate.
Glucose uptake
Glucose uptake was measured using a modification of the previously described protocol.16 Collecting successfully transfected C2C12 cells, which were cultured in normal or high glucose medium, cells were washed once in N-2-hydroxyethylpiperazine-N-ethane-sulphonicacid (HEPES) buffer and then incubated in the same solution with or without 100 nmol/L insulin for 30 min. After incubation, cells were rinsed twice with HEPES buffer. Then the glucose uptake was quantified by exposing the cells to 0.5 mmol/L 2-deoxy-d-[3H] glucose (2DOG) for 10 min at 25℃. At the end of the 10-min period, the supernatant was aspirated rapidly and the cells were washed twice with ice-cold Phosphate Buffered Saline (PBS). The cells were lysed in 50 mmol/L NaOH and the associated radioactivity was determined by liquid scintillation counting. Each experiment was assayed in duplicate.
Mitochondrial complex I activity assay
The mitochondrial complex I activity was measured in mitochondrial preparations using commercial kits (Genmed Scientifics, Wilmington, DE, USA) and detected by a WFJ7200 Spectrophotometer (Unico, Shanghai Instrument Co, Ltd, Shanghai, China). The oxidation of NADH by complex I was recorded using ubiquinone as an electron acceptor. The decrease in absorption was measured at 340 nm at 30℃ in both the absence and presence of 5 mg/L rotenone. The enzyme activity was measured for 3 min, with values recorded every 10 s after the initiation of the reaction. The reaction was started with 10 µg of mitochondrial protein, and the enzyme activity was measured at 550 nm at 30℃. The results of complexes I activities were expressed as nanomoles per minute per milligram mitochondrial protein (nM·min−1·mg mitochondrial protein−1).
Citrate synthase (CS) activity assay
CS was determined according to a previous report.17 CS was determined spectrophotometrically at 30℃ by measuring the appearance of the CoA-SH [acetyl-CoA + oxaloacetate + H2O ↔ citrate + CoA-SH + H+ (side reaction: CoA-SH + 5,5′-Dithiobis-(2-nitrobenzoic acid) (DTNB) → mercaptide ion)]. The diluted cell homogenates were used for the assay. In a 30℃ water bath, samples (100 μl) were prepared in triplicate by adding the following reagents: 650 μl of 100 mmol/L Tris (pH 8.1), used as a buffer, 50 μl of 3 mM acetyl-CoA, 100 μl of 1 mM DTNB, and 5 mmol/L oxaloacetate. Absorbance was measured at 412 nm with a spectrophotometer (Beckman, USA) maintained at 30℃. The results of CS activities were expressed as micromoles per minute per gram tissue.
Determination of oxidant production
ROS generation of C2C12 cells and other oxidants was evaluated in the homogenate by 2′,7′-Dichlorofluorescein (DCFH) oxidation rate using DCFH as a probe. DCFH is sensitive to ROS and other oxidants, and can be oxidized to the highly fluorescent dichlorofluorescein (DCF). The protocol was performed according to a previous report18 with some modification. Then, 1.5 × 10⁴ cells were seeded in each cell of 96-well plate. After washed twice by Earle’s, 25 µM 2′,7′-dichlorodihydrofluorescein diacetate (DCFH-DA) was added to each well and cells were incubated at 37℃ for 30 min. The cells were then washed twice by Earle’s after incubation. The fluorescence was detected by FLUO star OPTIMA Microplate reader (BMG LABTECH, Offenburg, Germany) reading at 488 nm for excitation and 525 nm for emission.
Determination of malondialdehyde (MDA)
For MDA content determination, cells were resuspended 2 × 10⁷ cells/mL in PBS containing 10 mmol/L butylated hydroxytoluene. The cells were sonicated on ice and the whole homogenate was used in the assay. Then, 100 µl of the sodium dodecyl sulfate lysis solution was added to 100 µl of samples and was thoroughly mixed in the tubes. The samples were then incubated for 5 min at room temperature before 250 µl of Thiobarbituric acid (TBA) reagent was add to each tube. Each tube was closed and incubated at 95℃ for 60 min. The tubes were removed and cooled to room temperature in an ice bath for 5 min before all sample tubes were centrifuge at 3000 r/min for 15 min. The supernatant was removed and the absorbance was measured at 532 nm using a spectrophotometer (Beckman, USA). MDA content was calculated based on a standard curve using 1,1,3,3-tetraethoxypropane as a standard.
Statistical analysis
Data were statistically analyzed by a paired test using a two-tailed distribution. The statistical analysis was performed with Statistical Package for Social Sciences 19.0 software (SPSS, Chicago, IL). All numeric variables are expressed as mean ± standard error (SE). Group statistical comparisons were assessed by one-way analysis of variance, and individual comparisons by Student–Newman–Keuls test. A P value <0.05 was considered statistically significant.
Results
SIRT1 overexpression increases the insulin sensitivity of C2C12 cells under high glucose conditions
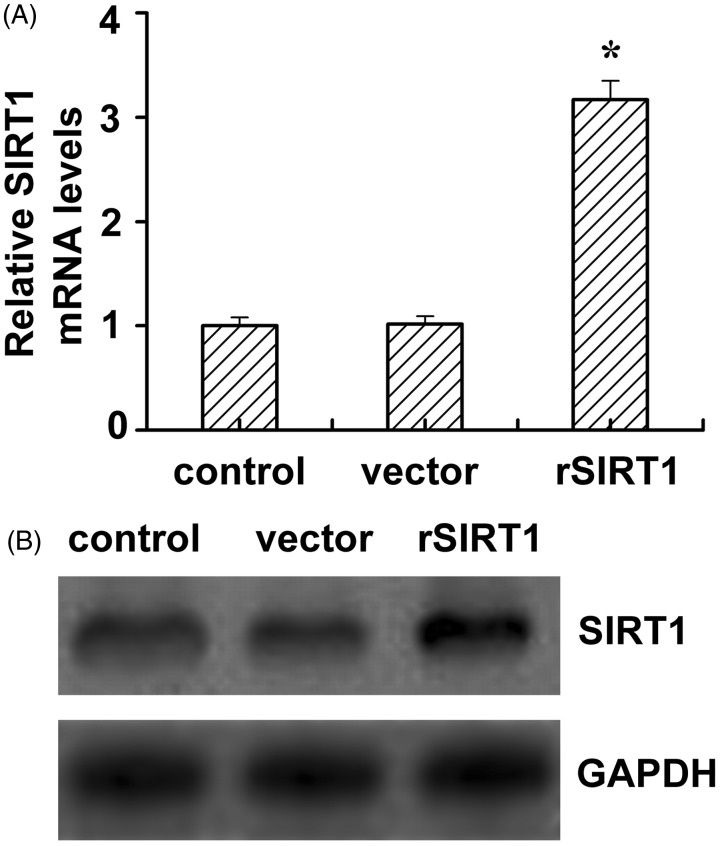
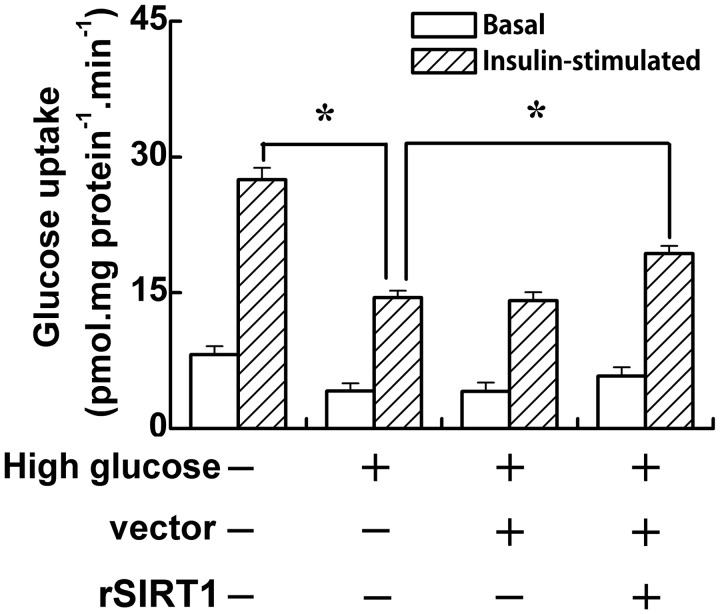
One of the common features of type 2 diabetes is hyperglycemia; sustained hyperglycemia induces insulin resistance.7 In this study, in order to investigate the effect of SIRT1 on insulin sensitivity of C2C12 cells under high glucose conditions, SIRT1 overexpressing C2C12 cells were generated by cell transfection. As showed by the results of RT-PCR analysis in Figure 1(A), the SIRT1 mRNA level in SIRT1-transfected cells was threefold higher than that of the control cells and vector-transfected cells. Similar to the RT-PCR, the SIRT1 protein expression level in SIRT1-transfected cells was higher than that in the control cells and vector-transfected cells. Furthermore, the insulin sensitivity of C2C12 cells was determined by 2DOG uptake after transfection. When cells were cultured in media containing normal glucose, insulin stimulation (100 nmol/L) induced an almost fourfold increase in 2-DOG uptake (Figure 2, the first two bars). Cells that were preincubated with high glucose demonstrated a lower rate of 2-DOG uptake than those in the normal glucose group (P < 0.05) under both basal and induced conditions (Figure 2, the left four bars). The vector transfection had no effect on the rate of 2-DOG uptake under either basal or insulin-stimulated conditions. However, SIRT1 transfection slightly increased the basal glucose uptake but obviously improved the glucose uptake (P < 0.05) under high glucose conditions. These data showed that SIRT1 transfection improves the insulin sensitivity of C2C12 cells under high glucose conditions.
Figure 1.
The SIRT1 levels in SIRT1-transfected C2C12 cell line. The SIRT1 mRNA (A) and protein (B) levels in control, vector (vector alone transfection), rSIRT1 (SIRT1 transfection) groups. Each bar represents mean ± SE. *P < 0.05, rSIRT1 versus control group
Figure 2.
SIRT1 increases insulin sensitivity under high glucose-induced insulin resistance condition. C2C12 cells were cultured in normal (5 mmol/L) or high glucose (20 mmol/L) medium. After vector or SIRT1 transfection, C2C12 cells were incubated for 30 min at 37℃ in medium with (white bars) or without (black bars) insulin (100 nM). Cells were then incubated in uptake buffer containing 2-deoxy-D-[3H] glucose (10 µmol/L) for 10 min. Data bars represent the means ± SE. *P < 0.05
SIRT1 overexpression rescues mitochondrial damage under high glucose conditions
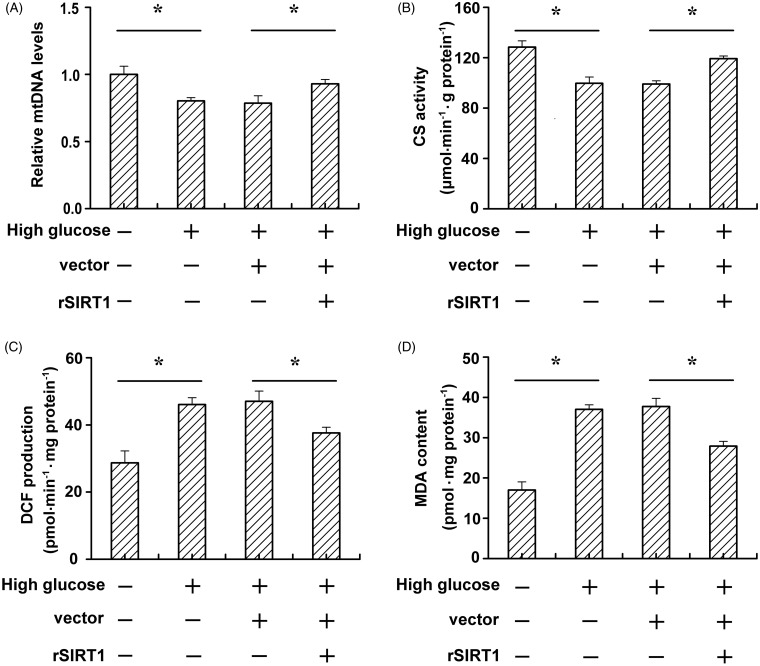
Numerous previous works have shown that insulin resistance is associated with mitochondrial dysfunction,3,5 and these results were attributed to oxidative stress in mitochondria.19–21 To further investigate whether SIRT1 increases insulin sensitivity via modulating mitochondrial damage under high glucose conditions, we determined the mtDNA levels, mitochondria-specific enzyme CS activity, ROS production, and MDA content of C2C12 cells. As shown in Figure 3(A), high glucose reduced the mtDNA levels compared to the normal glucose condition group (P < 0.05). However, SIRT1 transfection obviously increased mtDNA levels. In addition, high glucose reduced the CS activity compared to the normal glucose condition group (P < 0.05). SIRT1 transfection obviously increased the CS activity compared to the vector-transfected group (P < 0.05). The oxidant production, as revealed by the DCFH oxidation rate in C2C12 cell homogenates, was increased by high glucose (Figure 3(C), left two bars), but SIRT1 transfection significantly reduced the DCFH oxidation rate (Figure 3(C), right two bars). ROS peroxidative damage to cellular lipid and protein constituents was determined by measuring MDA content in C2C12 cells. We observed that high glucose obviously increased the MDA content. However, overexpression of SIRT1 was able to decrease the MDA content under high glucose conditions (Figure 3(D)).
Figure 3.
SIRT1 ameliorates mitochondrial dysfunction and alleviate mitochondrial oxidative stress under high glucose condition. C2C12 cells were cultured in normal (5 mmol/L) or high glucose (20 mmol/L) medium. After vector or SIRT1 transfection, relative mtDNA levels (A), CS activity (B), ROS production (C), and MDA content (D) were determined. Data bars represent the means ± SE. *P < 0.05
SIRT1 improves mitochondrial function and reduces its oxidative stress via increasing mitochondrial complex I activity in high glucose-stimulated C2C12 cells
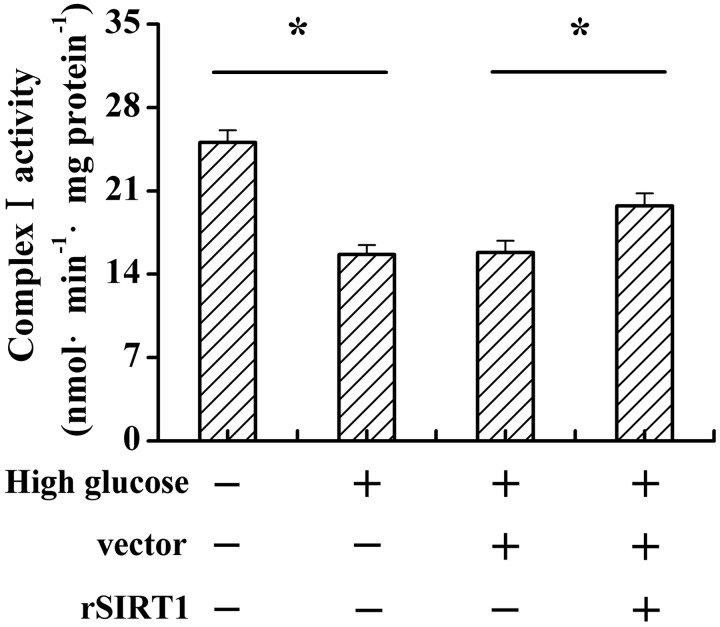
The results mentioned previously showed that SIRT1 improved mitochondrial function and reduced oxidative stress under high glucose treatment. It has been reported that mitochondrial complex I is the major site of ROS generation.22 To elucidate whether SIRT1 improves mitochondrial function and reduces its oxidative stress via complex I under high glucose treatment, we determined complex I activity. As shown in Figure 4, high glucose treatment remarkably decreased complex I activity; however, SIRT1 overexpression reversed this effect (Figure 4, P < 0.05).
Figure 4.
SIRT1 increases mitochondrial complexes I activities under high glucose condition. C2C12 cells were cultured in normal (5 mmol/L) or high glucose (20 mmol/L) medium. After vector or SIRT1 transfection, the mitochondrial complexes I activities were determined. Data bars represent the means ± SE. *P < 0.05
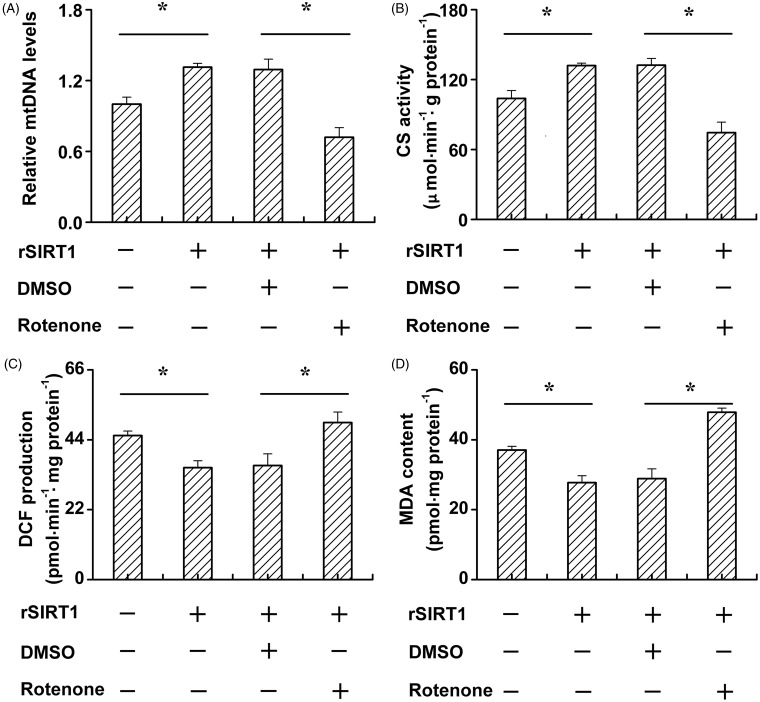
Furthermore, rotenone, a mitochondria specific complex I inhibitor was used in this study. SIRT1 transfection upregulated mtDNA levels under high glucose conditions. However, rotenone treatment notably reduced the restoration capacity of SIRT1 in mtDNA under high glucose conditions (Figure 5(A)). We next investigated CS activity under different treatments, and found that rotenone treatment reduced the function of SIRT1 on the restoration of CS activity (Figure 5(B)). Moreover, rotenone treatment increased ROS production and MDA content under high glucose conditions even when SIRT1 was overexpressed (Figure 5 (C,D)).
Figure 5.
Rotenone promotes skeleton muscle cell mitochondrial dysfunction and mitochondrial oxidative stress under high glucose condition. C2C12 cells were cultured in high (20 mmol/L) glucose medium. After vector or SIRT1 transfection, cells were treated with DMSO or rotenone. Relative mtDNA levels (A), CS activity (B), ROS production (C), and MDA content (D) was determined. Data bars represent the means ± SE. *P < 0.05
The effect of SIRT1 transfection on SIRT3 levels
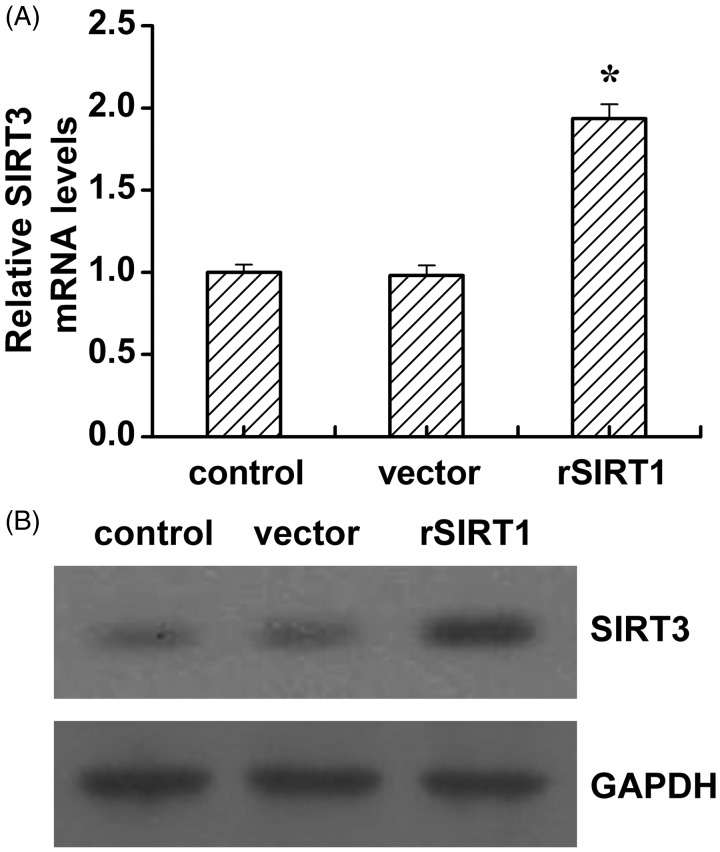
It has been reported that SIRT3 regulates skeletal muscle metabolism and insulin signaling via altered mitochondrial oxidation and ROS production.23 Moreover, SIRT3 interacts with mitochondrial complex I by deacetylation.24 Based on previous studies, we hypothesized that SIRT1 modulates complex I activity possibly via SIRT3. Therefore, we analyzed SIRT3 levels after SIRT1 transfection. As shown in Figure 6, SIRT1 significantly elevated the mRNA and protein levels of SIRT3 (Figure 6).
Figure 6.
Overexpression of SIRT1 in skeleton muscle cells upregulating SIRT3 levels. The SIRT1 mRNA (A) and protein (B) levels in control, vector (vector alone transfection), rSIRT1 (SIRT1 transfection) groups. Each bar represents mean ± SE. *P < 0.05, rSIRT1 versus control group
The effect of SIRT3 siRNA on mitochondrial complex I activity under high glucose treatment
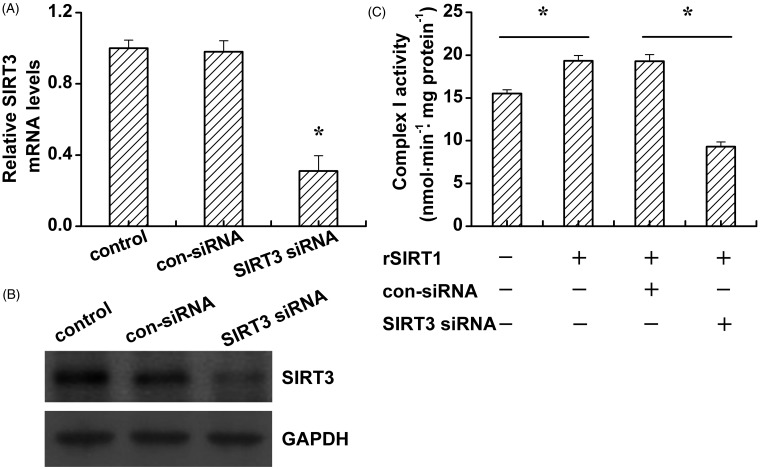
To better elucidate the relationship between SIRT3 and mitochondrial complex I, we generated SIRT3 knockdown C2C12 cells. The RNA interference efficiency was analyzed by RT-PCR and Western blotting. As shown in Figure 7, SIRT3 siRNA treatment dramatically decreases the SIRT3 mRNA and protein levels (Figure 7(A,B)). SIRT3 siRNA suppressed SIRT1 overexpression increased the activity of mitochondrial complex I.
Figure 7.
SIRT3 knockdown inhibits mitochondrial complexes I activities under high glucose condition. C2C12 cells were cultured in high glucose (20 mmol/L) medium. After control siRNA (con-siRNA) or SIRT3 siRNA transfection, the SIRT3 mRNA (A) and protein (B) levels, as well as the mitochondrial complexes I activities (C) were determined. Data bars represent the means ± SE. *P < 0.05
Discussion
Environmental change is closely related to the occurrence of disease. The influence of the environment in insulin resistance progression has gone beyond that of genetic susceptibility.25 The development of insulin resistance is a multistep process, with strong genetic and environmental influences. Sustained hyperglycemia impairs insulin-stimulated glucose utilization by peripheral tissues (i.e., muscle and fat) in animal models and humans and decreases the ability of pancreatic β-cells to respond to hyperglycemia with acute insulin release.7 However, mitochondrial dysfunction is likely to be a hub in the development of insulin resistance at the subcellular level.2 In these report, we showed that high glucose treatment induced insulin resistance in C2C12 cells both under basal and insulin-stimulated conditions. Previous data support the hypothesis that insulin resistance in the skeletal muscle of insulin-resistant offspring of patients with T2DM is associated with dysregulation of intramyocellular fatty acid metabolism, possibly because of an inherited defect in mitochondrial oxidative phosphorylation.26 New therapeutic strategies that regulate mitochondrial function and mitochondrial biogenesis may have therapeutic potential for decreased insulin action and pancreatic cell production, lipid accumulation in liver and skeletal muscle impairments.5 Our research demonstrated that high glucose interfered with mitochondrial biogenesis by reducing mtDNA levels. Moreover, high glucose also inhibited the CS activity and enhanced oxidative stress by increasing ROS production and MDA accumulation. Mitochondrial dysfunction has been implicated in the pathophysiology of insulin resistance. These results indicate that high glucose-induced insulin resistance perhaps occurs by enhancing mitochondrial dysfunction.
SIRT1, which is widely expressed in mammalian tissues, plays crucial roles in many biological processes, including stress response and cellular metabolism. SIRT1 has also been suggested to be involved in the processes of glucose homeostasis and insulin secretion.27 Scholars have confirmed that the levels of SIRT1 in insulin-sensitive tissues were positively correlated with energy metabolism and insulin sensitivity.28 Our data showed that overexpression of SIRT1 attenuates the high glucose-induced insulin resistance. Further research proved that SIRT1 attenuates the high glucose-induced mitochondrial dysfunction by increasing mtDNA levels and CS activity, as well as reducing ROS and MDA accumulation. Mitochondrial complex I plays a critical role in mitochondrial biogenesis, regulation, and ROS generation.22 Our study demonstrated that SIRT1 overexpression increases the activity of mitochondrial complex I. To better understand whether SIRT1 regulated mitochondrial dysfunction via increasing of complex I activity, we use rotenone, a mitochondrial complex I inhibitor to inhibit the activity of complex I. As expected, rotenone decreased the mitochondrial oxidative capacity and CS activity occurring in the presence of SIRT1, suggesting that SIRT1 regulates mitochondrial oxidative stress and function through the interaction with mitochondrial complex I. These results suggest that the decreased activity of complex I, especially the increase of oxidative stress, may induce mitochondrial dysfunction through ROS and MDA accumulation. This mechanism might account for the enhancement of mitochondrial dysfunction, at least partially, for insulin resistance in high glucose conditions.
There is another sirtuin member, SIRT3, mainly located in the mitochondria, which is a main deacetylase in mammalian mitochondria.24,29 SIRT3 deacetylates and activated acetyl-CoA synthetase 2 and 3-hydroxy-3-methylglutaryl CoA synthase 2 that facilitate the conversion of acetate to acetyl-CoA for energy production in extrahepatic tissues.30 Furthermore, SIRT3 can deacetylate and thereby activate a central metabolic regulator in the mitochondrial matrix, glutamate dehydrogenase, and activates isocitrate dehydrogenase 2, an enzyme that promotes regeneration of antioxidants and catalyzes a key regulation point of the citric acid cycle.30 SIRT3 can also physically interact with at least one of the known subunits of complex I, the 39-kDa protein NDUFA9, and functional studies demonstrate that mitochondria from SIRT3(−/−) animals display a selective inhibition of complex I activity.31 Notably, we found that SIRT3 knockdown by siRNA sharply suppresses SIRT1 overexpression induced complex I activity enhancement. Combined with those previous results and our data, we speculated that SIRT1 overexpression increase the CS and complex I activity via the activation of SIRT3.
Our further investigation showed that SIRT1 upregulated the expression of SIRT3, moreover, blocking the levels of SIRT3 using siRNA, the mitochondrial complex I activity was significantly suppressed. Based on these observations, we hypothesized that SIRT3 might be an intermediary between SIRT1 and mitochondrial complex I in the insulin signaling pathway.
Previous work has already showed that SIRT3 regulates skeletal muscle metabolism and insulin signaling via altered mitochondrial oxidation and the production of ROS.23 However, SIRT3 is a mitochondria protein, and upstream molecules must exist to transmitting stress signals under environmental stimuli. And we investigated that SIRT1 is one of the upstream molecules above SIRT3. Additional experiments will be needed to decipher the mechanism of SIRT1 and SIRT3 interaction under insulin resistance condition in skeleton muscle.
In summary, our results demonstrate that SIRT1 improves insulin sensitivity by reducing oxidative stress and mitochondrial dysfunction under high glucose-induced insulin resistant conditions. More importantly, SIRT1 reduces oxidative stress and mitochondrial dysfunction via the SIRT1–SIRT3–mitochondrial complex I pathway.
Acknowledgements
This work was supported by National Natural Science Foundation of China grant 81300656.
Authors’ contribution
H-HZ and G-JQ were responsible for the design and overall performance of the study as well as data analysis and preparation of the manuscript. X-JM, L-NW, Y-YZ, and P-YZ were all involved in the design and conduct of this study. Y-HZ, M-WS, FL, and F Li were responsible for the data collection and analysis. All authors read and approved the final manuscript.
References
- 1.Kubota T, Kubota N, Kumagai H, Yamaguchi S, Kozono H, Takahashi T, Inoue M, Itoh S, Takamoto I, Sasako T, Kumagai K, Kawai T, Hashimoto S, Kobayashi T, Sato M, Tokuyama K, Nishimura S, Tsunoda M, Ide T, Murakami K, Yamazaki T, Ezaki O, Kawamura K, Masuda H, Moroi M, Sugi K, Oike Y, Shimokawa H, Yanagihara N, Tsutsui M, Terauchi Y, Tobe K, Nagai R, Kamata K, Inoue K, Kodama T, Ueki K, Kadowaki T. Impaired insulin signaling in endothelial cells reduces insulin-induced glucose uptake by skeletal muscle. Cell Metab 2011; 13: 294–307. [DOI] [PubMed] [Google Scholar]
- 2.Szendroedi J, Phielix E, Roden M. The role of mitochondria in insulin resistance and type 2 diabetes mellitus. Nat Rev Endocrinol 2012; 8: 92–103. [DOI] [PubMed] [Google Scholar]
- 3.Petersen KF, Befroy D, Dufour S, Dziura J, Ariyan C, Rothman DL, DiPietro L, Cline GW, Shulman GI. Mitochondrial dysfunction in the elderly: possible role in insulin resistance. Science 2003; 300: 1140–42. [DOI] [PMC free article] [PubMed] [Google Scholar]
- 4.Lowell BB, Shulman GI. Mitochondrial dysfunction and type 2 diabetes. Science 2005; 307: 384–87. [DOI] [PubMed] [Google Scholar]
- 5.Kim J-a, Wei Y, Sowers JR. Role of mitochondrial dysfunction in insulin resistance. Circ Res 2008; 102: 401–14. [DOI] [PMC free article] [PubMed] [Google Scholar]
- 6.Grivennikova VG, Vinogradov AD. Partitioning of superoxide and hydrogen peroxide production by mitochondrial respiratory complex I. Biochim Biophys Acta 2013; 1827: 446–54. [DOI] [PubMed] [Google Scholar]
- 7.Nelson BA, Robinson KA, Buse MG. High glucose and glucosamine induce insulin resistance via different mechanisms in 3T3-L1 adipocytes. Diabetes 2000; 49: 981–91. [DOI] [PubMed] [Google Scholar]
- 8.Baron AD, Zhu JS, Zhu JH, Weldon H, Maianu L, Garvey WT. Glucosamine induces insulin resistance in vivo by affecting GLUT 4 translocation in skeletal muscle. Implications for glucose toxicity. J Clin Invest 1995; 96: 2792–801. [DOI] [PMC free article] [PubMed] [Google Scholar]
- 9.Chen Y-R, Lai Y-l, Lin S-d, Li X-t, Fu Y-C, Xu W-C. SIRT1 interacts with metabolic transcriptional factors in the pancreas of insulin-resistant and calorie-restricted rats. Mol Biol Rep 2013; 40: 3373–80. [DOI] [PubMed] [Google Scholar]
- 10.Liang F, Kume S, Koya D. SIRT1 and insulin resistance. Nat Rev Endocrinol 2009; 5: 367–73. [DOI] [PubMed] [Google Scholar]
- 11.Sun C, Zhang F, Ge X, Yan T, Chen X, Shi X, Zhai Q. SIRT1 improves insulin sensitivity under insulin-resistant conditions by repressing PTP1B. Cell Metab 2007; 6: 307–19. [DOI] [PubMed] [Google Scholar]
- 12.Milne JC, Lambert PD, Schenk S, Carney DP, Smith JJ, Gagne DJ, Jin L, Boss O, Perni RB, Vu CB, Bemis JE, Xie R, Disch JS, Ng PY, Nunes JJ, Lynch AV, Yang H, Galonek H, Israelian K, Choy W, Iffland A, Lavu S, Medvedik O, Sinclair DA, Olefsky JM, Jirousek MR, Elliott PJ, Westphal CH. Small molecule activators of SIRT1 as therapeutics for the treatment of type 2 diabetes. Nature 2007; 450: 712–6. [DOI] [PMC free article] [PubMed] [Google Scholar]
- 13.Gerhart-Hines Z, Rodgers JT, Bare O, Lerin C, Kim S-H, Mostoslavsky R, Alt FW, Wu Z, Puigserver P. Metabolic control of muscle mitochondrial function and fatty acid oxidation through SIRT1/PGC-1α. EMBO J 2007; 26: 1913–23. [DOI] [PMC free article] [PubMed] [Google Scholar]
- 14.Chen LL, Zhang HH, Zheng J, Hu X, Kong W, Hu D, Wang SX, Zhang P. Resveratrol attenuates high-fat diet-induced insulin resistance by influencing skeletal muscle lipid transport and subsarcolemmal mitochondrial beta-oxidation. Metabolism 2011; 60: 1598–609. [DOI] [PubMed] [Google Scholar]
- 15.Do G-M, Jung UJ, Park H-J, Kwon E-Y, Jeon S-M, McGregor RA, Choi M-S. Resveratrol ameliorates diabetes-related metabolic changes via activation of AMP-activated protein kinase and its downstream targets in db/db mice. Mol Nutr Food Res 2012; 56: 1282–91. [DOI] [PubMed] [Google Scholar]
- 16.Berti L, Kellerer M, Capp E, Häring HU. Leptin stimulates glucose transport and glycogen synthesis in C2C12 myotubes: evidence for a PI3-kinase mediated effect. Diabetologia 1997; 40: 606–9. [DOI] [PubMed] [Google Scholar]
- 17.Leek BT, Mudaliar SRD, Henry R, Mathieu-Costello O, Richardson RS. Effect of acute exercise on citrate synthase activity in untrained and trained human skeletal muscle. Am J Physiol Regulatory Integrat Comp Physiol 2001; 280: R441–7. [DOI] [PubMed] [Google Scholar]
- 18.Bejma J, Ji LL. Aging and acute exercise enhance free radical generation in rat skeletal muscle. J Appl Physiol 1999; 87: 465–70. [DOI] [PubMed] [Google Scholar]
- 19.Turner N, Bruce CR, Beale SM, Hoehn KL, So T, Rolph MS, Cooney GJ. Excess lipid availability increases mitochondrial fatty acid oxidative capacity in muscle: evidence against a role for reduced fatty acid oxidation in lipid-induced insulin resistance in rodents. Diabetes 2007; 56: 2085–92. [DOI] [PubMed] [Google Scholar]
- 20.Fisher-Wellman KH, Neufer PD. Linking mitochondrial bioenergetics to insulin resistance via redox biology. Trends Endocrin Met 2012; 23: 142–53. [DOI] [PMC free article] [PubMed] [Google Scholar]
- 21.Anderson EJ, Lustig ME, Boyle KE, Woodlief TL, Kane DA, Lin C-T, Price JW, III, Kang L, Rabinovitch PS, Szeto HH, Houmard JA, Cortright RN, Wasserman DH, Neufer PD. Mitochondrial H2O2 emission and cellular redox state link excess fat intake to insulin resistance in both rodents and humans. J Clin Invest 2009; 119: 573–81. [DOI] [PMC free article] [PubMed] [Google Scholar]
- 22.Koopman WJ, Nijtmans LG, Dieteren CE, Roestenberg P, Valsecchi F, Smeitink JA, Willems PH. Mammalian mitochondrial complex I: biogenesis, regulation, and reactive oxygen species generation. Antioxid Redox Sign 2010; 12: 1431–70. [DOI] [PubMed] [Google Scholar]
- 23.Jing E, Emanuelli B, Hirschey MD, Boucher J, Lee KY, Lombard D, Verdin EM, Kahn CR. Sirtuin-3 (Sirt3) regulates skeletal muscle metabolism and insulin signaling via altered mitochondrial oxidation and reactive oxygen species production. Proc Natl Acad Sci USA 2011; 108: 14608–13. [DOI] [PMC free article] [PubMed] [Google Scholar]
- 24.Giralt A, Villarroya F. SIRT3, a pivotal actor in mitochondrial functions: metabolism, cell death and aging. Biochem J 2012; 444: 1–10. [DOI] [PubMed] [Google Scholar]
- 25.Heitmann BL, Westerterp KR, Loos RJF, Sørensen TIA, O’Dea K, McLean P, Jensen TK, Eisenmann J, Speakman JR, Simpson SJ, Reed DR, Westerterp-Plantenga MS. Obesity: lessons from evolution and the environment. Obes Rev 2012; 13: 910–22. [DOI] [PubMed] [Google Scholar]
- 26.Petersen KF, Dufour S, Befroy D, Garcia R, Shulman GI. Impaired mitochondrial activity in the insulin-resistant offspring of patients with type 2 diabetes. New Engl J Med 2004; 350: 664–71. [DOI] [PMC free article] [PubMed] [Google Scholar]
- 27.Rodgers JT, Lerin C, Haas W, Gygi SP, Spiegelman BM, Puigserver P. Nutrient control of glucose homeostasis through a complex of PGC-1[alpha] and SIRT1. Nature 2005; 434: 113–8. [DOI] [PubMed] [Google Scholar]
- 28.de Kreutzenberg SV, Ceolotto G, Papparella I, Bortoluzzi A, Semplicini A, Dalla Man C, Cobelli C, Fadini GP, Avogaro A. Downregulation of the longevity-associated protein sirtuin 1 in insulin resistance and metabolic syndrome: potential biochemical mechanisms. Diabetes 2010; 59: 1006–15. [DOI] [PMC free article] [PubMed] [Google Scholar]
- 29.Jin L, Galonek H, Israelian K, Choy W, Morrison M, Xia Y, Wang X, Xu Y, Yang Y, Smith JJ, Hoffmann E, Carney DP, Perni RB, Jirousek MR, Bemis JE, Milne JC, Sinclair DA, Westphal CH. Biochemical characterization, localization, and tissue distribution of the longer form of mouse SIRT3. Protein Sci 2009; 18: 514–25. [DOI] [PMC free article] [PubMed] [Google Scholar]
- 30.Sack MN. The role of SIRT3 in mitochondrial homeostasis and cardiac adaptation to hypertrophy and aging. J Mol Cell Cardiol 2012; 52: 520–5. [DOI] [PMC free article] [PubMed] [Google Scholar]
- 31.Ahn B-H, Kim H-S, Song S, Lee IH, Liu J, Vassilopoulos A, Deng C-X, Finkel T. A role for the mitochondrial deacetylase Sirt3 in regulating energy homeostasis. Proc Natl Acad Sci USA 2008; 105: 14447–52. [DOI] [PMC free article] [PubMed] [Google Scholar]


