Abstract
Apoptosis and autophagy are critical in normal skeletal muscle homeostasis; however, dysregulation can lead to muscle atrophy and dysfunction. Lipotoxicity and/or lipid accumulation may promote apoptosis, as well as directly or indirectly influence autophagic signaling. Therefore, the purpose of this study was to examine the effect of a 16-week high-fat diet on morphological, apoptotic, and autophagic indices in oxidative and glycolytic skeletal muscle of female rats. High-fat feeding resulted in increased fat pad mass, altered glucose tolerance, and lower muscle pAKT levels, as well as lipid accumulation and reactive oxygen species generation in soleus muscle; however, muscle weights, fiber type-specific cross-sectional area, and fiber type distribution were not affected. Moreover, DNA fragmentation and LC3 lipidation as well as several apoptotic (ARC, Bax, Bid, tBid, Hsp70, pBcl-2) and autophagic (ATG7, ATG4B, Beclin 1, BNIP3, p70 s6k, cathepsin activity) indices were not altered in soleus or plantaris following high-fat diet. Interestingly, soleus muscle displayed small increases in caspase-3, caspase-8, and caspase-9 activity, as well as higher ATG12-5 and p62 protein, while both soleus and plantaris muscle showed dramatically reduced Bcl-2 and X-linked inhibitor of apoptosis protein (XIAP) levels. In conclusion, this work demonstrates that 16 weeks of high-fat feeding does not affect tissue morphology or induce a global autophagic or apoptotic phenotype in skeletal muscle of female rats. However, high-fat feeding selectively influenced a number of apoptotic and autophagic indices which could have implications during periods of enhanced muscle stress.
Keywords: Apoptosis, autophagy, skeletal muscle, fiber type, high-fat diet, gender
Introduction
Apoptosis is an essential part of skeletal muscle development and homeostasis;1 however, dysregulation is associated with muscle atrophy2 and contractile dysfunction.3 Excess lipid intake can lead to “spill over” of fatty acids into non-adipose tissues resulting in “lipotoxicity,”4 ultimately promoting glucose intolerance, insulin resistance, and tissue damage.5 In vitro studies have demonstrated that exposure of myotubes to a high-fat (HF) environment results in increased caspase-3 activity6 and DNA fragmentation.7–9 Similarly, MCK(m)-hLPL mice (which accumulate muscle lipids) have a higher percentage of apoptotic nuclei in muscle,5 while triacylglycerol infusion into lean mice increases muscle caspase-3 activation.10 Additionally, 16 weeks of HF feeding has been shown to increase caspase-3 activity in mouse muscle.11 In contrast, several reports found few apoptotic changes in muscle of obese Zucker rats12 or ob/ob and HF-fed mice.10 Thus, other degradative processes may have a role during lipotoxicity in skeletal muscle.
Autophagy plays a key role in tissue homeostasis. During autophagy, an expanding double membrane called the phagophore targets and sequesters cellular components (i.e., proteins and organelles), ultimately maturing into a double membranous vesicle called the autophagosome. Fusion of the autophagosome with a lysosome subsequently degrades these components.13 During periods of starvation, activation of autophagy provides an important source of metabolic substrates.14 In addition to its metabolic role, autophagy is critical in removing damaged organelles and proteins, which may decrease stress signaling and help to prevent cell death.15 As such, alterations in autophagic processes are now well established in the pathogenesis of muscle dysfunction and atrophy.16
Given the sensitivity of autophagic activation to metabolic perturbations, it is possible that excess lipid provision could inhibit skeletal muscle autophagy due to a surplus of metabolic substrate. Conversely, excess lipid intake and accumulation in skeletal muscle could promote autophagy in an attempt to manage elevated stress signaling due to lipotoxicity. A previous study found that ob/ob but not HF-fed mice have elevated Beclin 1 and LC3 mRNA in mixed gastrocnemius muscle;10 however, this work was limited to only a few autophagy-related markers in predominantly type II muscle. Although this study investigated morphological (extensor digitorum longus and soleus), apoptotic (tibialis anterior), and autophagic (mixed gastrocnemius) indices, these analyses were performed across different muscles. Given that there are fiber/muscle differences in apoptotic17 as well as autophagic18,19 signaling and protein expression, a concurrent evaluation of these pathways within skeletal muscles of different fiber composition would provide novel insight regarding this relationship following HF feeding. Additionally, despite evidence that some physiological responses to HF feeding are sex-dependent,20–22 much of the current literature has been conducted using male animals.10,23–32 Recently, calls to eliminate gender bias in animal research have been made;33,34 making an examination of the muscle-specific adaptations to HF feeding in a female model timely. Therefore, the purpose of this study was to examine morphological, apoptotic, and autophagic responses to HF feeding in both predominantly type I (oxidative) and type II (glycolytic) muscles of female rats.
Materials and methods
Animals and diet
Twenty-four female Sprague Dawley rats (199.3 ± 2.8 g) were randomly assigned to receive a control (CTRL, n = 12) or HF (n = 12) diet. The CTRL diet (D12450B; Research Diets, New Brunswick, NJ) was composed of 10% fat, 70% carbohydrate, and 20% protein, while the HF diet (D12451; Research Diets) was composed of 45% fat, 35% carbohydrate, and 20% protein. Rats were placed on diet at postnatal day 60 ± 2 days and had access to food ad libitum for a period of 16 weeks. Food intake was monitored weekly. All animal procedures were approved by the University of Waterloo Animal Care Committee and were in accordance with the guidelines established by the Canadian Council on Animal Care.
Muscle isolation and sample preparation
Rats were anesthetized using carbon dioxide and sacrificed by decapitation. The soleus and plantaris were removed, and a portion of the entire circumference from the mid-belly was covered in Optimal Cutting Temperature (OCT) compound, frozen in liquid nitrogen-cooled isopentane, and stored at −80℃. The remaining muscle was frozen in liquid nitrogen and stored at −80℃ for subsequent biochemical analyses.
Immunoblot analyses
Immunoblotting was performed as previously described.17,35 Briefly, equal protein was loaded on 12% sodium dodecyl sulfate poly-acrylamide gel electrophoresis (SDS-PAGE) gels, separated via electrophoresis, and transferred onto polyvinylidene difluoride (PVDF) membranes. Membranes were blocked in 5% milk-TBS-T, washed with TBS-T, and incubated with primary antibodies against p62 (Progen; Heidelberg, Germany), Bcl-2, pBcl-2 (Ser87), apoptosis repressor with caspase recruitment domain (ARC), Bax, Bid, ANT, cytochrome c, AIF (Santa Cruz Biotechnology; Dallas, TX), Hsp70, X-linked inhibitor of apoptosis protein (XIAP), MnSOD, CuZnSOD, Smac (Enzo Life Sciences; Farmingdale, NY), LC3B, Beclin 1, ATG7, ATG4B, ATG12-5, AKT, pAKT (Ser473), AMPK, pAMPK (Thr172), p70 s6k, BNIP3 (Cell Signaling; Danvers, MA), and catalase (Sigma-Aldrich, St. Louis, MO) for 1 h at room temperature or overnight at 4℃. Membranes were then washed with TBS-T and incubated with the appropriate horseradish peroxidase-conjugated secondary antibody (Santa Cruz Biotechnology) for 1 h at room temperature. Immunoreactive bands were visualized using Clarity Western ECL Substrate (BioRad Laboratories; Hercules, CA) or ECL Western Blot Substrate (BioVision; Milpitas, CA) and the ChemiGenius 2 Bio-Imaging System (Syngene, Cambridge, UK). Band optical densities were quantified using GeneTools (Syngene) and were normalized to a standard sample loaded on each gel. To ensure equal loading and quality of protein transfer, membranes were stained with Ponceau S (Sigma-Aldrich). All immunoblot analyses were performed in duplicate.
DNA fragmentation
Cytoplasmic histone-associated mono- and oligonucleosomes were determined using the Cell Death Detection ELISAPLUS Kit (Roche Diagnostics; Mississauga, Canada) as previously reported.17 Absorbance was measured at 405 nm and 490 nm using a SPECTRAmax Plus spectrophotometer (Molecular Devices; Sunnyvale, CA). A positive control for DNA fragmentation (DNA-histone-complex) was included with each assay. Absorbance was normalized to total protein content and expressed as arbitrary units (AU) per mg protein.
Caspase and cathepsin enzyme activity
Caspase-3, caspase-8, caspase-9, and cathepsin enzymatic activity in muscle homogenates was determined as previously described17 using the substrates Ac-DEVD-AMC (Enzo Life Sciences), Ac-IETD-AMC (Sigma-Aldrich), Ac-LEHD-AMC (Enzo Life Sciences), and z-FR-AFC (Enzo Life Sciences), respectively. Briefly, samples were homogenized in ice-cold lysis buffer without protease inhibitors using a glass homogenizer and incubated in duplicate at room temperature (in the dark) with the appropriate substrate. Fluorescence was measured using a SPECTRAmax Gemini XS microplate spectrofluorometer (Molecular Devices) with excitation and emission wavelengths of 360 nm and 440 nm (caspases) or 400 nm and 505 nm (cathepsin), respectively. Activity was normalized to the total protein content and expressed as fluorescence intensity in AU per mg protein.
Immunofluorescence and immunohistochemical analysis
Soleus and plantaris muscle embedded in OCT compound was cut into 10 µm cross sections using a cryostat (Thermo Scientific, Waltham, MA) maintained at −20℃. Identification of myosin heavy chain (MHC) expression and fiber cross-sectional area (CSA) was performed as previously described36 using primary antibodies against MHCI (BA-F8), MHCIIa (SC-71), and MHCIIb (BF-F3) (Developmental Studies Hybridoma Bank; Iowa City, IA), and appropriate anti-mouse isotype-specific Alexa Fluor secondary antibodies (Life Technologies; Carlsbad, CA). Imaging was performed using an Axio Observer Z1 fluorescent microscope equipped with an AxioCam HRm camera and associated AxioVision software (Carl Zeiss; Oberkochen, Germany). Quantitative data for fiber type composition were obtained by counting all fibers within a muscle section, and CSA was determined by outlining fibers from five separate regions of each cross section (∼50 fibers per muscle fiber type).
Intramuscular lipid content
Intramuscular lipid content was determined by Oil Red O staining, as adapted from Koopman et al.37 Briefly, soleus and plantaris sections were air dried and fixed for 1 h in 3.7% formaldehyde solution in deionized water. Sections were then washed three times in deionized water and immersed in warm Oil Red O solution (Cayman Chemical Company; Ann Arbor, MI) prepared in 60% triethyl-phosphate (Sigma-Aldrich) for 30 min. After three additional washes, coverslips were mounted with ProLong Gold antifade reagent (Life Technologies). Slides were imaged with an Axio Observer Z1 microscope. Fluorescence was determined in 20 fibers of each fiber type for each muscle.
Reactive oxygen species generation
Reactive oxygen species (ROS) production in whole muscle was determined using dichlorofluorescein-diacetate (DCFH-DA) as previously described.17,38 Briefly, samples were homogenized using a glass homogenizer in ice-cold buffer with protease inhibitors. Muscle homogenates (in duplicate) were incubated with 5 µM DCFH-DA (Life Technologies) at 37℃ in the dark. Fluorescence was quantified using a SPECTRAmax Gemini XS microplate spectrofluorometer (Molecular Devices) with excitation and emission wavelengths of 490 nm and 525 nm, respectively. Fluorescence intensity was normalized to total protein content and expressed as AU per mg of protein.
Glucose tolerance
Glucoregulation was measured in non-anesthetized animals on a monthly basis. Following an overnight fast lasting approximately 12 h, animals were weighed and blood glucose levels measured with a portable glucose meter (Glucometer Elite, Bayer; Toronto, Canada) using a drop of blood obtained via a tail poke. An oral bolus of a glucose solution was then administered (2 g glucose/kg body weight), and blood glucose levels measured 30, 60, 90, and 120 min later.
Statistical analyses
Results are presented as mean ± SEM. All data (except where noted below) were analyzed using a Student’s t-test to determine difference between CTRL and HF groups. Muscle fiber CSA and Oil Red O data were analyzed using a two-way analysis of variance, with Tukey’s post hoc test used to determine differences between groups. P < 0.05 was considered statistically significant.
Results
Biometric data
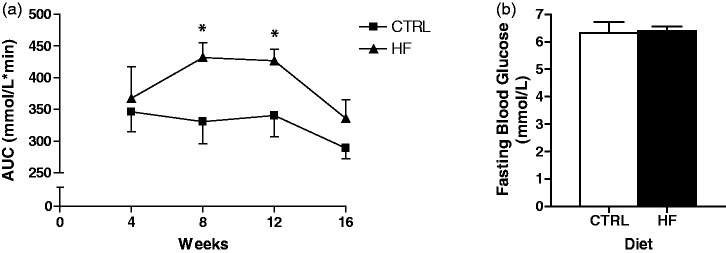
No statistically significant differences were found in terminal body mass, soleus muscle mass, or plantaris muscle mass (Table 1); however, retroperitoneal fat pad mass was higher (P < 0.01) in HF animals. Food intake was significantly lower (P < 0.001) in the HF compared to CTRL group. Conversely, energy intake was higher (P < 0.01) in the HF group (Table 1). At four weeks of the dietary period, no differences in glucose levels were detected following an oral glucose tolerance test (OGTT) (Figure 1(a)). In contrast, at eight and 12 weeks, the HF group exhibited higher (P < 0.05) blood glucose levels compared to the CTRL group following an OGTT (Figure 1(a)). Interestingly, no differences in glucose levels were observed between groups following an OGTT at 16 weeks (Figure 1(a)). There were no group differences in terminal fasting blood glucose (Figure 1(b)).
Table 1.
Biometric data from rats receiving a control (CTRL) or high-fat (HF) diet for 16 weeks
| CTRL | HF | |
|---|---|---|
| Terminal body mass (g) | 275.8 ± 4.0 | 287.1 ± 8.4 |
| Soleus mass (mg) | 113.4 ± 3.0 | 120.8 ± 5.3 |
| Plantaris mass (mg) | 337.0 ± 5.7 | 344.7 ± 12.1 |
| Retroperitoneal fat pad mass (g) | 1.3 ± 0.1 | 2.0 ± 0.2§ |
| Food intake (g) | 273.3 ± 4.2 | 237.2 ± 3.8φ |
| Energy intake (kcal) | 1052.4 ± 16.2 | 1121.8 ± 17.9§ |
P < 0.01 vs. CTRL; φP < 0.001 vs. CTRL
Figure 1.
Oral glucose tolerance test (OGTT) and fasting glucose. OGTT average area under the curve (AUC; mmol/L*min) for the CTRL and HF group at each four-week interval of the dietary intervention (a). Terminal fasting blood glucose (mmol/L) (b). *P < 0.05 vs. CTRL
Muscle fiber composition, CSA, fiber lipid content, and mitochondrial protein content
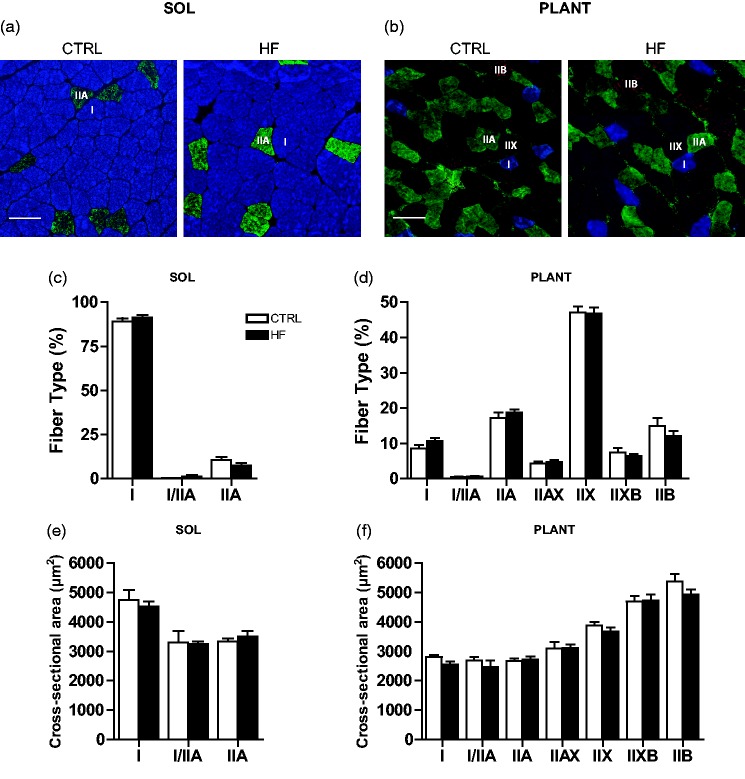
Fiber type distribution and the total number of fibers (data not shown) in soleus (Figure 2(a) and (c)) and plantaris (Figure 2(b) and (d)) were not different between groups. Muscle fiber CSA was not statistically different between groups in soleus (Figure 2(e)) or plantaris (Figure 2(f)).
Figure 2.
Skeletal muscle fiber type and cross-sectional area (CSA). Representative images of MHC staining in soleus (a) and plantaris (b) showing type I (I; blue), type IIA (IIA; green), type IIX (IIX; unstained), and type IIB (IIB; red) fibers. Quantification of fiber type distribution (c and d) and fiber cross-sectional area in soleus and plantaris (e and f), respectively. Bars represent 100 µm. (A color version of this figure is available in the online journal.)
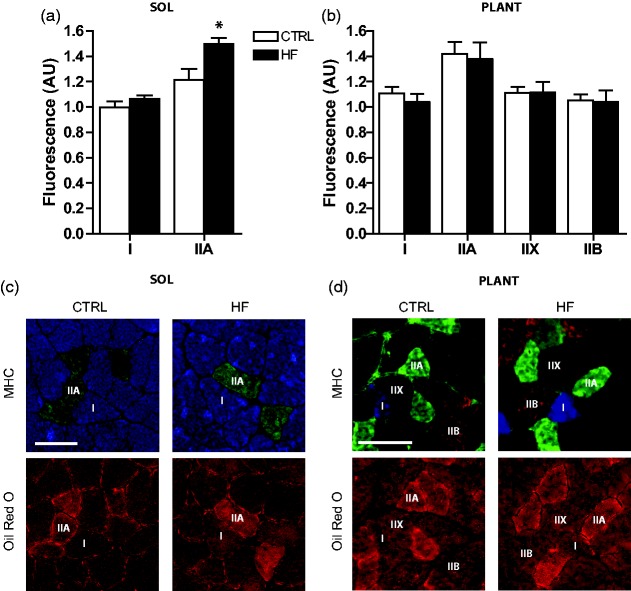
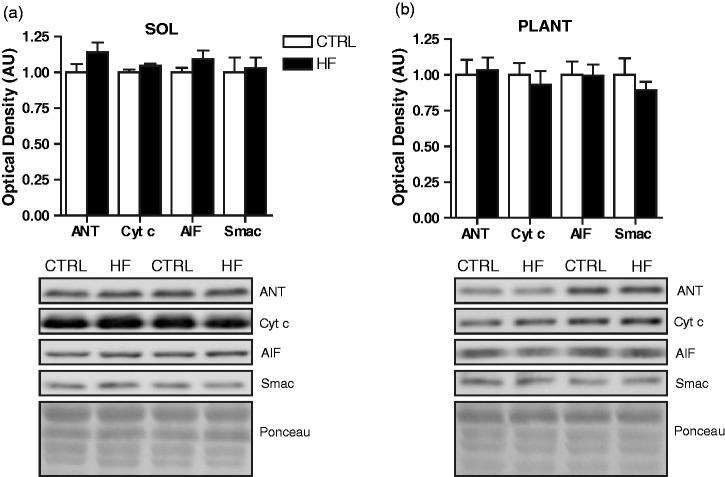
Fiber lipid content was higher (P < 0.05) in soleus of the HF compared to CTRL animals. Post hoc analysis revealed that this was primarily due to elevated lipid deposition in type IIA fibers (P < 0.05) of HF animals (Figure 3(a) and (c)). No differences in lipid content were observed between groups in the plantaris (Figure 3(b) and (d)). Mitochondrial content was estimated through immunoblot analyses of the mitochondrial proteins ANT, AIF, cytochrome c, and Smac.17 There were no significant differences in these mitochondrial proteins across groups in either soleus (Figure 4(a)) or plantaris (Figure 4(b)).
Figure 3.
Skeletal muscle intramuscular lipid content. Quantification of fiber type-specific Oil Red O staining in soleus (a) and plantaris (b), where values are normalized to the fluorescence measured in type I fibers of CTRL soleus. Representative images of MHC staining and corresponding serial cross sections showing Oil Red O staining in soleus (c) and plantaris (d). Shown are type I (I; blue), type IIA (IIA; green), type IIX (IIX; unstained), and type IIB (IIB; red) fibers. *P < 0.05 vs. CTRL. Bars represent 100 µm. (A color version of this figure is available in the online journal.)
Figure 4.
Skeletal muscle markers of mitochondrial content. Quantitative analysis and representative immunoblots of ANT, cytochrome c, AIF, and Smac protein in soleus (a) and plantaris (b). Also shown are corresponding Ponceau-stained membranes
DNA fragmentation and caspase enzymatic activity
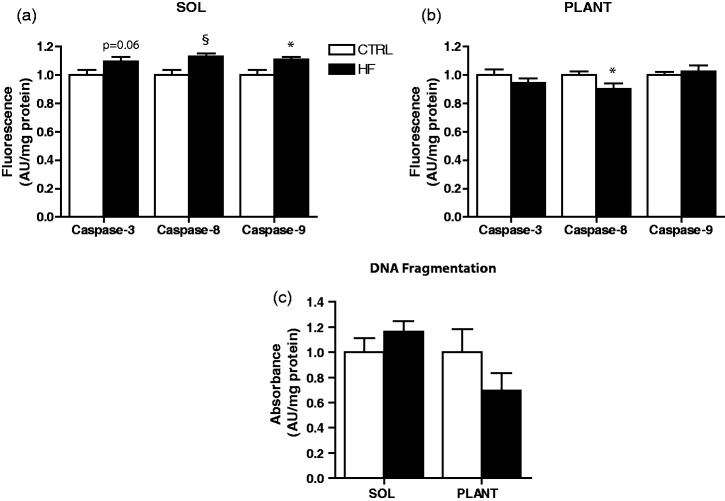
The level of DNA fragmentation was not significantly different between groups in soleus or plantaris (Figure 5(c)). However, there was a trend toward elevated caspase-3 enzymatic activity (P = 0.06) in soleus of HF rats. Consistent with this finding, soleus of HF animals had elevated caspase-8 (P < 0.01) and caspase-9 (P < 0.05) enzymatic activity (Figure 5(a)). In contrast, caspase-3 and caspase-9 activity were not different between groups in plantaris muscle. Interestingly, caspase-8 activity was lower (P < 0.05) in plantaris of the HF animals (Figure 5(b)).
Figure 5.
Proteolytic enzyme activity and DNA fragmentation. Caspase-3, -8, and -9 activity in soleus (a) and plantaris (b). DNA fragmentation in soleus and plantaris (c). *P < 0.05 vs. CTRL. §P < 0.01 vs. CTRL
Apoptosis-related protein content
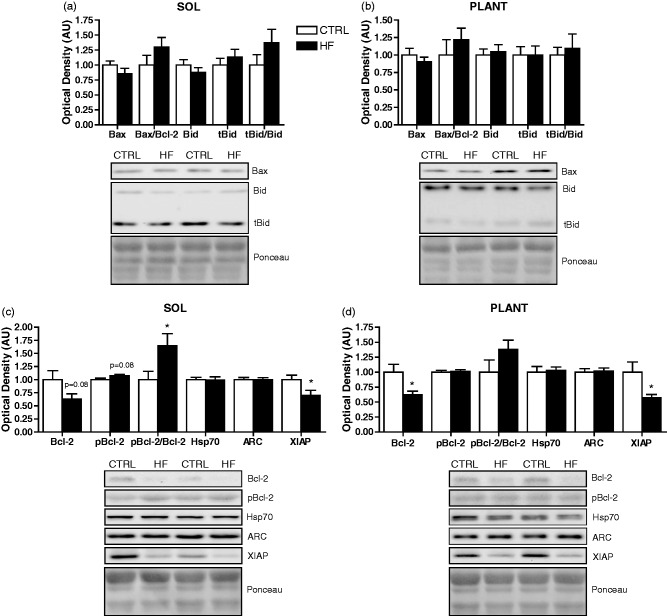
There were trends toward lower Bcl-2 (P = 0.08) and higher pBcl-2 (P = 0.08) protein in soleus of HF animals, resulting in a higher (P < 0.05) pBcl-2/Bcl-2 ratio (Figure 6(c)). Similarly, Bcl-2 protein was lower (P < 0.05) in plantaris of the HF group; however, no differences in pBcl-2 or the pBcl-2/Bcl-2 ratio were observed (Figure 6(d)). In addition, XIAP protein was lower (P < 0.05) in soleus (Figure 6(c)) and plantaris (Figure 6(d)) of HF animals. No significant differences were found in Bid, tBid, the tBid/Bid ratio, Bax, the Bax/Bcl-2 ratio, Hsp70, and ARC protein between groups in soleus (Figure 6(a) and (c)) or plantaris (Figure 6(b) and (d)).
Figure 6.
Apoptosis-related protein expression. Quantitative analysis and representative immunoblots of Bax, Bid, and tBid (as well as calculated Bax/Bcl-2 and tBid/Bid ratios) in soleus (a) and plantaris (b). Quantitative analysis and representative immunoblots of Bcl-2, pBcl-2, Hsp70, ARC, and XIAP (as well as calculated pBcl-2/Bcl-2 ratio) in soleus (c) and plantaris (d). Also shown are corresponding Ponceau-stained membranes. *P < 0.05 vs. CTRL
Autophagy-related protein markers and cathepsin enzymatic activity
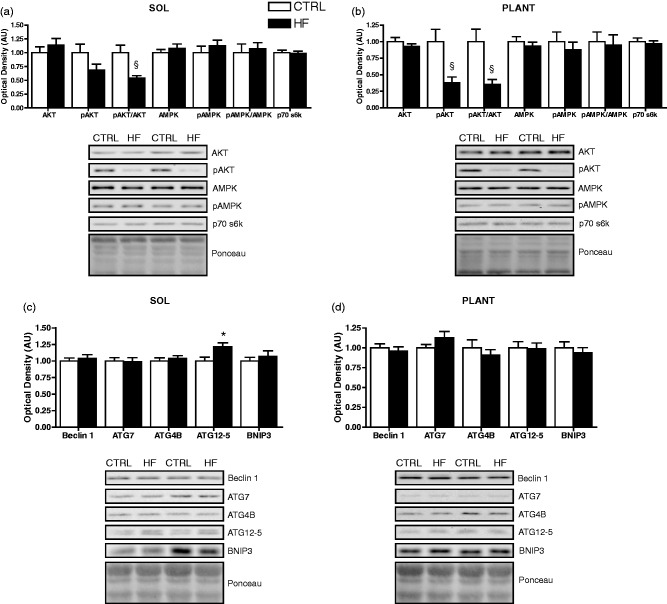
There were no differences in AMPK and pAMPK protein, or the pAMPK/AMPK ratio between groups in soleus (Figure 7(a)) or plantaris (Figure 7(b)). There were no significant differences in AKT or pAKT protein in soleus; however, there was a lower (P < 0.01) pAKT/AKT ratio in the soleus of HF animals (Figure 7(a)). In plantaris, lower (P < 0.01) pAKT protein and pAKT/AKT ratio was found in the HF group (Figure 7(b)). There was no difference in p70 s6k protein content in soleus (Figure 7(a)) or plantaris between groups (Figure 7(b)).
Figure 7.
Autophagy-related signaling protein expression. Quantitative analysis and representative immunoblots of p70 s6k, AKT, pAKT, AMPK, and pAMPK (as well as calculated pAKT/AKT and pAMPK/AMPK ratios) in soleus (a) and plantaris (b). Quantitative analysis and representative immunoblots of Beclin 1, ATG7, ATG4B, ATG12-5, and BNIP3 in soleus (c) and plantaris (d). Also shown are corresponding Ponceau-stained membranes. *P < 0.05 vs. CTRL. §P < 0.01 vs. CTRL
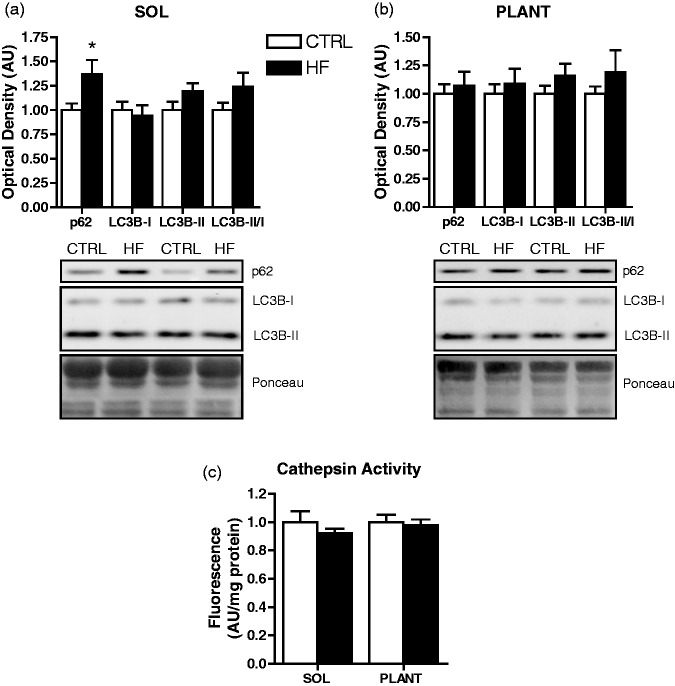
Protein levels of ATG12-5 were higher (P < 0.05) in soleus of HF animals (Figure 7(c)), but not in plantaris (Figure 7(d)). There were no differences in Beclin 1, BNIP3, ATG4B, and ATG7 protein between groups in soleus (Figure 7(c)) or plantaris (Figure 7(d)). Levels of p62 protein were higher (P < 0.05) in soleus of HF animals (Figure 8(a)), but not different in plantaris (Figure 8(b)). There were no differences in LC3B-I and LC3B-II protein, or the LC3B-II/I ratio between groups in soleus (Figure 8(a)) or plantaris (Figure 8(b)). Cathepsin enzymatic activity was also not different between groups in soleus or plantaris (Figure 8(c)).
Figure 8.
Autophagosome-associated protein expression and lysosomal enzymatic activity. Quantitative analysis and representative immunoblots of p62, LC3B-I, and LC3B-II (as well as calculated LC3B-II/I ratio) in soleus (a) and plantaris (b). Also shown are corresponding Ponceau-stained membranes. Quantitative analysis of cathepsin enzymatic activity in soleus and plantaris (c). *P < 0.05 vs. CTRL
ROS generation and antioxidant protein content
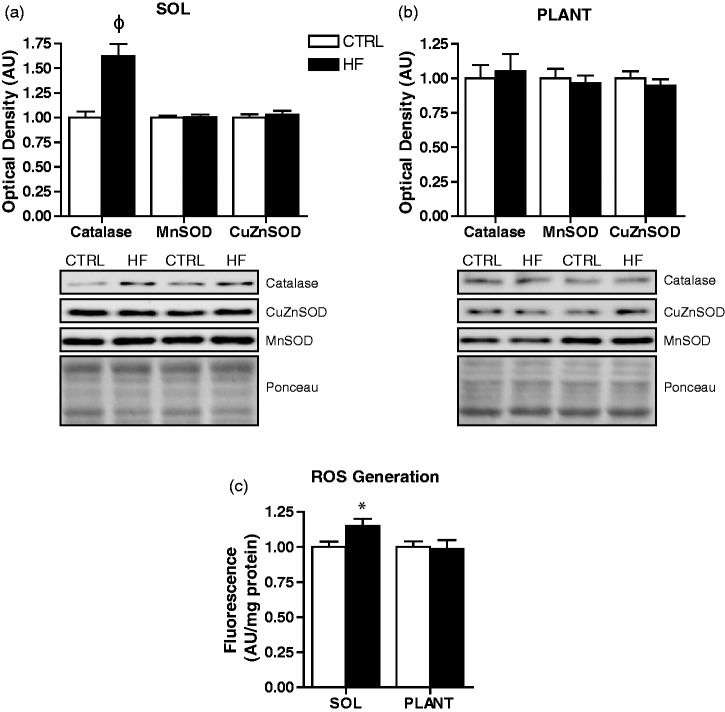
Soleus muscle of HF animals had elevated (P < 0.001) catalase protein; however, CuZnSOD and MnSOD protein levels were not different between groups (Figure 9(a)). In addition, muscle ROS generation was higher (P < 0.05) in soleus of HF animals (Figure 9(c)). Catalase, CuZnSOD, and MnSOD protein, as well as ROS generation were not different between groups in the plantaris (Figure 9(b) and (c)).
Figure 9.
Antioxidant enzyme protein content and ROS generation. Quantitative analysis and representative immunoblots of catalase, MnSOD, and CuZnSOD in soleus (a) and plantaris (b). Also shown are corresponding Ponceau-stained membranes. Quantitative analysis of reactive oxygen species (ROS) generation in soleus and plantaris (c). *P < 0.05 vs. CTRL. φP < 0.001 vs. CTRL
Discussion
In the present study, we characterized the morphological, autophagic, and apoptotic responses to a chronic HF diet in oxidative (soleus) and glycolytic (plantaris) skeletal muscles. Animals displayed several common HF diet-induced changes including increased fat pad mass and increased lipid accumulation, as well as significantly altered glucose tolerance for part of the dietary intervention. However, we found no significant differences in soleus and plantaris mass, fiber type-specific cross-sectional area, or fiber type distribution. In addition, although HF feeding resulted in elevated ROS generation as well as alterations to a number of apoptotic and autophagic factors in soleus, we found no clear evidence of down-stream autophagic activation or apoptosis.
As expected, HF animals displayed increased skeletal muscle lipid deposition,23,24 but interestingly, this result was isolated to the soleus. A similar muscle-type accumulation was also observed by Kim et al.25 who reported increased triglyceride content in soleus but not in epitrochlearis (glycolytic muscle) after a HF diet. These disparities in muscle lipid deposition could be due to higher fatty acid transport39,40 and/or higher rates of triacylglycerol (TAG) synthesis in oxidative compared to glycolytic muscle.41 Indeed, TAG pools have been shown to be higher in oxidative compared to glycolytic muscle.42,43 Of further interest was that the increased lipid deposition in the soleus was specific to type IIA fibers. Although this finding may appear contradictory, it is important to note that oxidative capacity is higher in type IIA than type I fibers of rat muscle.36 This raises the possibility that lipid accumulation is related to muscle/fiber oxidative capacity.
Similar to previous work, our HF animals demonstrated increased ROS generation,26 which was also consistent with the observed higher levels of catalase protein. Interestingly, these effects were limited to soleus muscle. Given that the mitochondria is a major site of ROS generation in skeletal muscle, it is possible that this increased ROS is due to greater lipid handling39,40 and metabolism in oxidative muscle44,45 following a HF diet. Non-mitochondrial sources such as xanthine oxidase may also be responsible; an enzyme with greater activity in soleus compared to plantaris46 which is important in muscle ROS production following a HF diet.47 We also found a reduction in the pAKT/AKT ratio in both soleus and plantaris of HF animals; a key player in insulin signaling and glucose metabolism.48 These data are consistent with previous reports demonstrating altered insulin-stimulated glucose transport in both oxidative and glycolytic muscle of HF fed rats27,29 and support our OGTT data, as well as a general phenotype toward altered muscle substrate reliance/availability following a HF diet. Together, these data suggest that HF feeding induced several metabolic and stress signaling alterations in skeletal muscle.
Increased apoptotic signaling contributes to wasting and functional decline in skeletal muscle.3,49 A variety of signaling events can activate apoptosis in skeletal muscle, including ROS.38 We found increased caspase-3, caspase-8, and caspase-9 activity in soleus muscle of HF-fed rats which may be due to the elevated ROS generation observed in this muscle. In further support of these data, we found dramatically reduced XIAP and Bcl-2 protein in soleus; two antiapoptotic proteins critical in regulating caspase activation.50 Although these proteins were also depressed in plantaris, subsequent activation of caspases was likely limited to the soleus due to the presence of an initiating apoptotic stress (i.e., ROS generation). Despite these changes in key apoptotic molecules, there were no down-stream effects on DNA fragmentation; a hallmark of apoptosis. In addition to DNA fragmentation, increased apoptotic signaling and caspase activation can contribute to wasting by cleaving muscle-specific substrates such as actin.49 However, we did not observe changes in muscle weight or fiber CSA. Although muscle cell culture experiments7,8 and transgenic animals with extreme muscle lipid overload5 demonstrate signs of elevated apoptosis such as DNA fragmentation, few apoptotic differences are observed in obese Zucker rats12 as well as ob/ob and HF-fed mice.10 Thus, this raises the likelihood that under most physiological and pathological “high-fat” conditions, skeletal muscle is generally capable of mitigating apoptosis. Aside from inducing apoptosis, caspases have “non-lethal” roles given their ability to cleave numerous cellular substrates;51 effects which are directed by their level of activation. For example, caspase levels observed during apoptosis exceed those occurring during differentiation.52 Thus, the small level of caspase activation we observed in soleus of high-fat fed animals may not be sufficient to induce an apoptotic phenotype, but could be involved in alternative cellular functions. In fact, several caspases have metabolic roles53–55 and are able to cleave enzymes involved in metabolism.53,56 Taken together, our data suggest that HF feeding is able to induce changes to several key apoptotic signaling and regulatory factors in muscle, but not to a level that is sufficient to result in a global apoptotic phenotype. Importantly, changes to key antiapoptotic proteins (Bcl-2, XIAP) following a HF diet may leave skeletal muscle more susceptible to apoptosis during additional cellular stress. A possible non-lethal role of caspase activation following HF feeding requires further investigation.
The dramatic reduction in XIAP and Bcl-2 protein we observed across both muscles was of particular interest. While we are unaware of any studies demonstrating reduced levels of these proteins in skeletal muscle following a HF diet, decreased Bcl-2 protein has been demonstrated in hepatocytes28 and cardiomyocytes57 of HF-fed animals. Interestingly, these studies also found impaired AKT phosphorylation,28,57 which is consistent with our data. In fact, AKT phosphorylation can regulate Bcl-2 gene transcription and protein content.58,59 Phosphorylated AKT can also stabilize XIAP and prevent its degradation.60 Collectively, these data suggest that the reduced pAKT levels following HF feeding may contribute to decreased Bcl-2 and XIAP protein content; an effect that warrants further investigation.
Previous reports have demonstrated that a HF diet10 and alterations to AKT signaling can influence autophagy-related gene expression and autophagic flux.61,62 We found no change in ATG7, ATG4B, Beclin 1, p70 s6k, and BNIP3 protein content or cathepsin enzymatic activity in soleus or plantaris of HF-fed rats. Similar to previous reports,10,63 HF feeding did not significantly alter the autophagosomal marker LC3B-II or the LC3B-II/I ratio in skeletal muscle. In contrast, HF-fed rats had increased ATG12-5 protein levels in soleus muscle. Considering that autophagy can increase in response to ROS generation,64 and that higher ROS was present in soleus following HF feeding, it is possible that elevated ATG12-5 protein may reflect an attempt to promote autophagy. Interestingly, HF feeding elevated p62 protein content in soleus muscle, which is consistent with a previous report.63 An increase in p62 typically reflects a lower rate or inhibition of autophagic flux;65 however, this remains to be determined in this context. It is possible that the elevated p62 in soleus following a HF diet is required to target caspase substrates or ROS damaged proteins/organelles for degradation. Alternatively, p62 may be playing a metabolic role. For example, genetic knockdown of p62 results in glucose intolerance, insulin resistance, increased adipogenesis, and obesity.66,67 Interestingly, p62 interacts with IRS-1 to enhance AKT phosphorylation upon insulin stimulation.68 Therefore, the higher p62 levels may be an attempt to enhance the lower AKT phosphorylation in muscle of HF fed animals. Collectively, these data are consistent with the caspase activation and elevated ROS observed in soleus muscle and provide further support for muscle-specific responses to HF feeding.
It is important to note that this study was performed in female rats, while similar work has used male rodents10,11 or has not specified the gender.5,12 Thus, discrepancies between our work and previous literature may be a result of gender-related differences. In fact, a number of physiological and metabolic effects of a HF diet have been shown to be sex-dimorphic. For example, DNA microarray analysis in skeletal muscle revealed 35 differentially expressed transcripts between male and female rats following a HF diet.21 Similarly, compared to their male counterparts, female rats elevate mitochondrial content to a lesser extent20 and do not show changes in fiber type22 following a HF diet. More importantly, gender-related differences in both apoptosis69,70 and autophagy69,71,72 have been noted in the literature. Thus, sex-dependent cellular responses may differentially influence apoptotic and autophagic signaling (directly or indirectly) following HF feeding; however, this remains to be determined.
In conclusion, this work demonstrates that 16 weeks of HF feeding in female rats does not alter muscle morphology or phenotype. In addition, although down-stream autophagic and apoptotic responses were not altered, HF feeding selectively influenced several autophagic (p62, ATG12-5) and apoptotic (Bcl-2, XIAP, caspases) factors. This work also provides further support for differential autophagic and apoptotic responses across muscles. Thus, future research should consider gender and investigate multiple muscle types to better understand skeletal muscle apoptotic and autophagic responses to various perturbations.
Acknowledgement
This research was supported by funds provided by the Natural Sciences and Engineering Research Council of Canada (NSERC) to John G. Mielke (RGPIN 371693) and Joe Quadrilatero (RGPIN 258590).
Author's contributions
Animal feeding, animal biometric measures, and blood glucose analyses were performed in the laboratory of JGM. All other analyses were performed in the laboratory of JQ. TLC, JGM, and JQ contributed to the conception and design of the experiments. TLC, ASM, EMM, DB, DP, IM, and JQ contributed to the collection, analysis, and interpretation of data. TLC, ASM, EMM, DB, and JQ were responsible for drafting the article or revising it critically for important intellectual content. All authors approved the final version of the manuscript for publication.
References
- 1.Elmore S. Apoptosis: a review of programmed cell death. Toxicol Pathol 2007; 35: 495–516. [DOI] [PMC free article] [PubMed] [Google Scholar]
- 2.Plant PJ, Bain JR, Correa JE, Woo M, Batt J. Absence of caspase-3 protects against denervation-induced skeletal muscle atrophy. J Appl Physiol (1985) 2009; 107: 224–34. [DOI] [PubMed] [Google Scholar]
- 3.Supinski GS, Callahan LA. Caspase activation contributes to endotoxin-induced diaphragm weakness. J Appl Physiol (1985) 2006; 100: 1770–7. [DOI] [PubMed] [Google Scholar]
- 4.Kusminski CM, Shetty S, Orci L, Unger RH, Scherer PE. Diabetes and apoptosis: lipotoxicity. Apoptosis 2009; 14: 1484–95. [DOI] [PubMed] [Google Scholar]
- 5.Tamilarasan KP, Temmel H, Das SK, Al Zoughbi W, Schauer S, Vesely PW, Hoefler G. Skeletal muscle damage and impaired regeneration due to LPL-mediated lipotoxicity. Cell Death Dis 2012; 3: e354–e354. [DOI] [PMC free article] [PubMed] [Google Scholar]
- 6.Yuzefovych L, Wilson G, Rachek L. Different effects of oleate vs. palmitate on mitochondrial function, apoptosis, and insulin signaling in L6 skeletal muscle cells: role of oxidative stress. Am J Physiol Endocrinol Metab 2010; 299: E1096–105. [DOI] [PMC free article] [PubMed] [Google Scholar]
- 7.Turpin SM, Lancaster GI, Darby I, Febbraio MA, Watt MJ. Apoptosis in skeletal muscle myotubes is induced by ceramides and is positively related to insulin resistance. Am J Physiol Endocrinol Metab 2006; 291: E1341–50. [DOI] [PubMed] [Google Scholar]
- 8.Peterson JM, Wang Y, Bryner RW, Williamson DL, Alway SE. Bax signaling regulates palmitate-mediated apoptosis in C(2)C(12) myotubes. Am J Physiol Endocrinol Metab 2008; 295: E1307–14. [DOI] [PMC free article] [PubMed] [Google Scholar]
- 9.Rachek LI, Musiyenko SI, LeDoux SP, Wilson GL. Palmitate induced mitochondrial deoxyribonucleic acid damage and apoptosis in l6 rat skeletal muscle cells. Endocrinology 2007; 148: 293–9. [DOI] [PubMed] [Google Scholar]
- 10.Turpin SM, Ryall JG, Southgate R, Darby I, Hevener AL, Febbraio MA, Kemp BE, Lynch GS, Watt MJ. Examination of ‘lipotoxicity' in skeletal muscle of high-fat fed and ob/ob mice. J Physiol 2009; 587: 1593–605. [DOI] [PMC free article] [PubMed] [Google Scholar]
- 11.Yuzefovych LV, Musiyenko SI, Wilson GL, Rachek LI. Mitochondrial DNA damage and dysfunction, and oxidative stress are associated with endoplasmic reticulum stress, protein degradation and apoptosis in high fat diet-induced insulin resistance mice. PLoS One 2013; 8: e54059–e54059. [DOI] [PMC free article] [PubMed] [Google Scholar]
- 12.Peterson JM, Bryner RW, Sindler A, Frisbee JC, Alway SE. Mitochondrial apoptotic signaling is elevated in cardiac but not skeletal muscle in the obese Zucker rat and is reduced with aerobic exercise. J Appl Physiol (1985) 2008; 105: 1934–43. [DOI] [PMC free article] [PubMed] [Google Scholar]
- 13.Ravikumar B, Sarkar S, Davies JE, Futter M, Garcia-Arencibia M, Green-Thompson ZW, Jimenez-Sanchez M, Korolchuk VI, Lichtenberg M, Luo S, Massey DC, Menzies FM, Moreau K, Narayanan U, Renna M, Siddiqi FH, Underwood BR, Winslow AR, Rubinsztein DC. Regulation of mammalian autophagy in physiology and pathophysiology. Physiol Rev 2010; 90: 1383–435. [DOI] [PubMed] [Google Scholar]
- 14.Singh R, Cuervo AM. Autophagy in the cellular energetic balance. Cell Metab 2011; 13: 495–504. [DOI] [PMC free article] [PubMed] [Google Scholar]
- 15.Maiuri MC, Zalckvar E, Kimchi A, Kroemer G. Self-eating and self-killing: crosstalk between autophagy and apoptosis. Nat Rev Mol Cell Biol 2007; 8: 741–52. [DOI] [PubMed] [Google Scholar]
- 16.Sandri M. Autophagy in skeletal muscle. FEBS Lett 2010; 584: 1411–6. [DOI] [PubMed] [Google Scholar]
- 17.McMillan EM, Quadrilatero J. Differential apoptosis-related protein expression, mitochondrial properties, proteolytic enzyme activity, and DNA fragmentation between skeletal muscles. Am J Physiol Regul Integr Comp Physiol 2011; 300: R531–43. [DOI] [PubMed] [Google Scholar]
- 18.Yamada E, Bastie CC, Koga H, Wang Y, Cuervo AM, Pessin JE. Mouse skeletal muscle fiber-type-specific macroautophagy and muscle wasting are regulated by a Fyn/STAT3/Vps34 signaling pathway. Cell Rep 2012; 1: 557–69. [DOI] [PMC free article] [PubMed] [Google Scholar]
- 19.Ogata T, Oishi Y, Higuchi M, Muraoka I. Fasting-related autophagic response in slow- and fast-twitch skeletal muscle. Biochem Biophys Res Commun 2010; 394: 136–40. [DOI] [PubMed] [Google Scholar]
- 20.Gomez-Perez Y, Capllonch-Amer G, Gianotti M, Llado I, Proenza AM. Long-term high-fat-diet feeding induces skeletal muscle mitochondrial biogenesis in rats in a sex-dependent and muscle-type specific manner. Nutr Metab (Lond) 2012; 9: 15-7075--9-15–15-7075--9-15. [DOI] [PMC free article] [PubMed] [Google Scholar]
- 21.Oh TS, Yun JW. DNA microarray analysis reveals differential gene expression in the soleus muscle between male and female rats exposed to a high fat diet. Mol Biol Rep 2012; 39: 6569–80. [DOI] [PubMed] [Google Scholar]
- 22.Denies MS, Johnson J, Maliphol AB, Bruno M, Kim A, Rizvi A, Rustici K, Medler S. Diet-induced obesity alters skeletal muscle fiber types of male but not female mice. Physiol Rep 2014; 2: e00204–e00204. [DOI] [PMC free article] [PubMed] [Google Scholar]
- 23.Chanseaume E, Malpuech-Brugere C, Patrac V, Bielicki G, Rousset P, Couturier K, Salles J, Renou JP, Boirie Y, Morio B. Diets high in sugar, fat, and energy induce muscle type-specific adaptations in mitochondrial functions in rats. J Nutr 2006; 136: 2194–200. [DOI] [PubMed] [Google Scholar]
- 24.Timmers S, de Vogel-van den Bosch J, Towler MC, Schaart G, Moonen-Kornips E, Mensink RP, Hesselink MK, Hardie DG, Schrauwen P. Prevention of high-fat diet-induced muscular lipid accumulation in rats by alpha lipoic acid is not mediated by AMPK activation. J Lipid Res 2010; 51: 352–9. [DOI] [PMC free article] [PubMed] [Google Scholar]
- 25.Kim JY, Nolte LA, Hansen PA, Han DH, Ferguson K, Thompson PA, Holloszy JO. High-fat diet-induced muscle insulin resistance: relationship to visceral fat mass. Am J Physiol Regul Integr Comp Physiol 2000; 279: R2057–65. [DOI] [PubMed] [Google Scholar]
- 26.Anderson EJ, Lustig ME, Boyle KE, Woodlief TL, Kane DA, Lin CT, Price JW, 3rd, Kang L, Rabinovitch PS, Szeto HH, Houmard JA, Cortright RN, Wasserman DH, Neufer PD. Mitochondrial H2O2 emission and cellular redox state link excess fat intake to insulin resistance in both rodents and humans. J Clin Invest 2009; 119: 573–81. [DOI] [PMC free article] [PubMed] [Google Scholar]
- 27.Han DH, Hansen PA, Host HH, Holloszy JO. Insulin resistance of muscle glucose transport in rats fed a high-fat diet: a reevaluation. Diabetes 1997; 46: 1761–7. [DOI] [PubMed] [Google Scholar]
- 28.Han JW, Zhan XR, Li XY, Xia B, Wang YY, Zhang J, Li BX. Impaired PI3K/Akt signal pathway and hepatocellular injury in high-fat fed rats. World J Gastroenterol 2010; 16: 6111–8. [DOI] [PMC free article] [PubMed] [Google Scholar]
- 29.Hancock CR, Han DH, Chen M, Terada S, Yasuda T, Wright DC, Holloszy JO. High-fat diets cause insulin resistance despite an increase in muscle mitochondria. Proc Natl Acad Sci U S A 2008; 105: 7815–20. [DOI] [PMC free article] [PubMed] [Google Scholar]
- 30.Turner N, Kowalski GM, Leslie SJ, Risis S, Yang C, Lee-Young RS, Babb JR, Meikle PJ, Lancaster GI, Henstridge DC, White PJ, Kraegen EW, Marette A, Cooney GJ, Febbraio MA, Bruce CR. Distinct patterns of tissue-specific lipid accumulation during the induction of insulin resistance in mice by high-fat feeding. Diabetologia 2013; 56: 1638–48. [DOI] [PubMed] [Google Scholar]
- 31.Honors MA, Hargrave SL, Kinzig KP. Glucose tolerance in response to a high-fat diet is improved by a high-protein diet. Obesity (Silver Spring) 2012; 20: 1859–65. [DOI] [PubMed] [Google Scholar]
- 32.Matsuzawa-Nagata N, Takamura T, Ando H, Nakamura S, Kurita S, Misu H, Ota T, Yokoyama M, Honda M, Miyamoto K, Kaneko S. Increased oxidative stress precedes the onset of high-fat diet-induced insulin resistance and obesity. Metabolism 2008; 57: 1071–7. [DOI] [PubMed] [Google Scholar]
- 33.Zucker I, Beery AK. Males still dominate animal studies. Nature 2010; 465: 690–690. [DOI] [PubMed] [Google Scholar]
- 34.Clayton JA, Collins FS. Policy: NIH to balance sex in cell and animal studies. Nature 2014; 509: 282–3. [DOI] [PMC free article] [PubMed] [Google Scholar]
- 35.Bloemberg D, McDonald E, Dulay D, Quadrilatero J. Autophagy is altered in skeletal and cardiac muscle of spontaneously hypertensive rats. Acta Physiol (Oxf) 2014; 210: 381–91. [DOI] [PubMed] [Google Scholar]
- 36.Bloemberg D, Quadrilatero J. Rapid determination of myosin heavy chain expression in rat, mouse, and human skeletal muscle using multicolor immunofluorescence analysis. PLoS One 2012; 7: e35273–e35273. [DOI] [PMC free article] [PubMed] [Google Scholar]
- 37.Koopman R, Schaart G, Hesselink MK. Optimisation of oil red O staining permits combination with immunofluorescence and automated quantification of lipids. Histochem Cell Biol 2001; 116: 63–8. [DOI] [PubMed] [Google Scholar]
- 38.Dam AD, Mitchell AS, Rush JW, Quadrilatero J. Elevated skeletal muscle apoptotic signaling following glutathione depletion. Apoptosis 2012; 17: 48–60. [DOI] [PubMed] [Google Scholar]
- 39.Bonen A, Luiken JJ, Liu S, Dyck DJ, Kiens B, Kristiansen S, Turcotte LP, Van Der Vusse GJ, Glatz JF. Palmitate transport and fatty acid transporters in red and white muscles. Am J Physiol 1998; 275: E471–8. [DOI] [PubMed] [Google Scholar]
- 40.Luiken JJ, Han XX, Dyck DJ, Bonen A. Coordinately regulated expression of FAT/CD36 and FACS1 in rat skeletal muscle. Mol Cell Biochem 2001; 223: 61–9. [DOI] [PubMed] [Google Scholar]
- 41.Budohoski L, Gorski J, Nazar K, Kaciuba-Uscilko H, Terjung RL. Triacylglycerol synthesis in the different skeletal muscle fiber sections of the rat. Am J Physiol 1996; 271: E574–81. [DOI] [PubMed] [Google Scholar]
- 42.Spriet LL, Heigenhauser GJ, Jones NL. Endogenous triacylglycerol utilization by rat skeletal muscle during tetanic stimulation. J Appl Physiol (1985) 1986; 60: 410–5. [DOI] [PubMed] [Google Scholar]
- 43.Gorski J, Nawrocki A, Murthy M. Characterization of free and glyceride-esterified long chain fatty acids in different skeletal muscle types of the rat. Mol Cell Biochem 1998; 178: 113–8. [DOI] [PubMed] [Google Scholar]
- 44.Holness MJ, Kraus A, Harris RA, Sugden MC. Targeted upregulation of pyruvate dehydrogenase kinase (PDK)-4 in slow-twitch skeletal muscle underlies the stable modification of the regulatory characteristics of PDK induced by high-fat feeding. Diabetes 2000; 49: 775–81. [DOI] [PubMed] [Google Scholar]
- 45.Dyck DJ, Peters SJ, Glatz J, Gorski J, Keizer H, Kiens B, Liu S, Richter EA, Spriet LL, van der Vusse GJ, Bonen A. Functional differences in lipid metabolism in resting skeletal muscle of various fiber types. Am J Physiol 1997; 272: E340–51. [DOI] [PubMed] [Google Scholar]
- 46.Apple FS, Hyde JE, Ingersoll-Stroubos AM, Theologides A. Geographic distribution of xanthine oxidase, free radical scavengers, creatine kinase, and lactate dehydrogenase enzyme systems in rat heart and skeletal muscle. Am J Anat 1991; 192: 319–23. [DOI] [PubMed] [Google Scholar]
- 47.Bravard A, Bonnard C, Durand A, Chauvin MA, Favier R, Vidal H, Rieusset J. Inhibition of xanthine oxidase reduces hyperglycemia-induced oxidative stress and improves mitochondrial alterations in skeletal muscle of diabetic mice. Am J Physiol Endocrinol Metab 2011; 300: E581–91. [DOI] [PubMed] [Google Scholar]
- 48.Chang L, Chiang SH, Saltiel AR. Insulin signaling and the regulation of glucose transport. Mol Med 2004; 10: 65–71. [DOI] [PMC free article] [PubMed] [Google Scholar]
- 49.Du J, Wang X, Miereles C, Bailey JL, Debigare R, Zheng B, Price SR, Mitch WE. Activation of caspase-3 is an initial step triggering accelerated muscle proteolysis in catabolic conditions. J Clin Invest 2004; 113: 115–23. [DOI] [PMC free article] [PubMed] [Google Scholar]
- 50.Fesik SW. Promoting apoptosis as a strategy for cancer drug discovery. Nat Rev Cancer 2005; 5: 876–85. [DOI] [PubMed] [Google Scholar]
- 51.Feinstein-Rotkopf Y, Arama E. Can't live without them, can live with them: roles of caspases during vital cellular processes. Apoptosis 2009; 14: 980–95. [DOI] [PubMed] [Google Scholar]
- 52.Fernando P, Megeney LA. Is caspase-dependent apoptosis only cell differentiation taken to the extreme? FASEB J 2007; 21: 8–17. [DOI] [PubMed] [Google Scholar]
- 53.Shao W, Yeretssian G, Doiron K, Hussain SN, Saleh M. The caspase-1 digestome identifies the glycolysis pathway as a target during infection and septic shock. J Biol Chem 2007; 282: 36321–9. [DOI] [PubMed] [Google Scholar]
- 54.Kotas ME, Jurczak MJ, Annicelli C, Gillum MP, Cline GW, Shulman GI, Medzhitov R. Role of caspase-1 in regulation of triglyceride metabolism. Proc Natl Acad Sci U S A 2013; 110: 4810–5. [DOI] [PMC free article] [PubMed] [Google Scholar]
- 55.Logette E, Le Jossic-Corcos C, Masson D, Solier S, Sequeira-Legrand A, Dugail I, Lemaire-Ewing S, Desoche L, Solary E, Corcos L. Caspase-2, a novel lipid sensor under the control of sterol regulatory element binding protein 2. Mol Cell Biol 2005; 25: 9621–31. [DOI] [PMC free article] [PubMed] [Google Scholar]
- 56.Hilder TL, Carlson GM, Haystead TA, Krebs EG, Graves LM. Caspase-3 dependent cleavage and activation of skeletal muscle phosphorylase b kinase. Mol Cell Biochem 2005; 275: 233–42. [DOI] [PubMed] [Google Scholar]
- 57.Zhang Y, Yuan M, Bradley KM, Dong F, Anversa P, Ren J. Insulin-like growth factor 1 alleviates high-fat diet-induced myocardial contractile dysfunction: role of insulin signaling and mitochondrial function. Hypertension 2012; 59: 680–93. [DOI] [PMC free article] [PubMed] [Google Scholar] [Retracted]
- 58.Pugazhenthi S, Nesterova A, Sable C, Heidenreich KA, Boxer LM, Heasley LE, Reusch JE. Akt/protein kinase B up-regulates Bcl-2 expression through cAMP-response element-binding protein. J Biol Chem 2000; 275: 10761–6. [DOI] [PubMed] [Google Scholar]
- 59.Bratton MR, Duong BN, Elliott S, Weldon CB, Beckman BS, McLachlan JA, Burow ME. Regulation of ERalpha-mediated transcription of Bcl-2 by PI3K-AKT crosstalk: implications for breast cancer cell survival. Int J Oncol 2010; 37: 541–50. [DOI] [PMC free article] [PubMed] [Google Scholar]
- 60.Dan HC, Sun M, Kaneko S, Feldman RI, Nicosia SV, Wang HG, Tsang BK, Cheng JQ. Akt phosphorylation and stabilization of X-linked inhibitor of apoptosis protein (XIAP). J Biol Chem 2004; 279: 5405–12. [DOI] [PubMed] [Google Scholar]
- 61.Xu X, Hua Y, Nair S, Zhang Y, Ren J. Akt2 knockout preserves cardiac function in high-fat diet-induced obesity by rescuing cardiac autophagosome maturation. J Mol Cell Biol 2013; 5: 61–3. [DOI] [PMC free article] [PubMed] [Google Scholar]
- 62.Zhao J, Brault JJ, Schild A, Cao P, Sandri M, Schiaffino S, Lecker SH, Goldberg AL. FoxO3 coordinately activates protein degradation by the autophagic/lysosomal and proteasomal pathways in atrophying muscle cells. Cell Metab 2007; 6: 472–83. [DOI] [PubMed] [Google Scholar]
- 63.He C, Bassik MC, Moresi V, Sun K, Wei Y, Zou Z, An Z, Loh J, Fisher J, Sun Q, Korsmeyer S, Packer M, May HI, Hill JA, Virgin HW, Gilpin C, Xiao G, Bassel-Duby R, Scherer PE, Levine B. Exercise-induced BCL2-regulated autophagy is required for muscle glucose homeostasis. Nature 2012; 481: 511–5. [DOI] [PMC free article] [PubMed] [Google Scholar]
- 64.Scherz-Shouval R, Elazar Z. Regulation of autophagy by ROS: physiology and pathology. Trends Biochem Sci 2011; 36: 30–8. [DOI] [PubMed] [Google Scholar]
- 65.Bjorkoy G, Lamark T, Pankiv S, Overvatn A, Brech A, Johansen T. Monitoring autophagic degradation of p62/SQSTM1. Methods Enzymol 2009; 452: 181–97. [DOI] [PubMed] [Google Scholar]
- 66.Lee SJ, Pfluger PT, Kim JY, Nogueiras R, Duran A, Pages G, Pouyssegur J, Tschop MH, Diaz-Meco MT, Moscat J. A functional role for the p62-ERK1 axis in the control of energy homeostasis and adipogenesis. EMBO Rep 2010; 11: 226–232.. [DOI] [PMC free article] [PubMed] [Google Scholar]
- 67.Rodriguez A, Duran A, Selloum M, Champy MF, Diez-Guerra FJ, Flores JM, Serrano M, Auwerx J, Diaz-Meco MT, Moscat J. Mature-onset obesity and insulin resistance in mice deficient in the signaling adapter p62. Cell Metab 2006; 3: 211–22. [DOI] [PubMed] [Google Scholar]
- 68.Geetha T, Zheng C, Vishwaprakash N, Broderick TL, Babu JR. Sequestosome 1/p62, a scaffolding protein, is a newly identified partner of IRS-1 protein. J Biol Chem 2012; 287: 29672–8. [DOI] [PMC free article] [PubMed] [Google Scholar]
- 69.Chen C, Hu LX, Dong T, Wang GQ, Wang LH, Zhou XP, Jiang Y, Murao K, Lu SQ, Chen JW, Zhang GX. Apoptosis and autophagy contribute to gender difference in cardiac ischemia-reperfusion induced injury in rats. Life Sci 2013; 93: 265–70. [DOI] [PubMed] [Google Scholar]
- 70.Dent MR, Tappia PS, Dhalla NS. Gender differences in apoptotic signaling in heart failure due to volume overload. Apoptosis 2010; 15: 499–510. [DOI] [PubMed] [Google Scholar]
- 71.Olivan S, Calvo AC, Manzano R, Zaragoza P, Osta R. Sex differences in constitutive autophagy. Biomed Res Int 2014; 2014: 652817–652817. [DOI] [PMC free article] [PubMed] [Google Scholar]
- 72.Du L, Hickey RW, Bayir H, Watkins SC, Tyurin VA, Guo F, Kochanek PM, Jenkins LW, Ren J, Gibson G, Chu CT, Kagan VE, Clark RS. Starving neurons show sex difference in autophagy. J Biol Chem 2009; 284: 2383–96. [DOI] [PMC free article] [PubMed] [Google Scholar]


