Coronary blood flow varies to match oxygen delivery to myocardial oxygen demand. Integrating sympathetically mediated open-loop and metabolic adenine nucleotide-mediated feedback control in a model of coronary blood flow control shows how these pathways work together and illustrates the central role of feedback in the control of coronary blood flow.
Keywords: coronary blood flow, open-loop (feed-forward) control, feedback control, myogenic control, oxygen mass balance, autoregulation, cardiac pacing
Abstract
A control system model was developed to analyze data on in vivo coronary blood flow regulation and to probe how different mechanisms work together to control coronary flow from rest to exercise, and under a variety of experimental conditions, including cardiac pacing and with changes in coronary arterial pressure (autoregulation). In the model coronary flow is determined by the combined action of a feedback pathway signal that is determined by the level of plasma ATP in coronary venous blood, an adrenergic open-loop (feed-forward) signal that increases with exercise, and a contribution of pressure-mediated myogenic control. The model was identified based on data from exercise experiments where myocardial oxygen extraction, coronary flow, cardiac interstitial norepinephrine concentration, and arterial and coronary venous plasma ATP concentrations were measured during control and during adrenergic and purinergic receptor blockade conditions. The identified model was used to quantify the relative contributions of open-loop and feedback pathways and to illustrate the degree of redundancy in the control of coronary flow. The results indicate that the adrenergic open-loop control component is responsible for most of the increase in coronary blood flow that occurs during high levels of exercise. However, the adenine nucleotide-mediated metabolic feedback control component is essential. The model was evaluated by predicting coronary flow in cardiac pacing and autoregulation experiments with reasonable fits to the data. The analysis shows that a model in which coronary venous plasma adenine nucleotides are a signal in local metabolic feedback control of coronary flow is consistent with the available data.
NEW & NOTEWORTHY
Coronary blood flow varies to match oxygen delivery to myocardial oxygen demand. Integrating sympathetically mediated open-loop and metabolic adenine nucleotide-mediated feedback control in a model of coronary blood flow control shows how these pathways work together and illustrates the central role of feedback in the control of coronary blood flow.
over an approximately fourfold range of rate of oxygen consumption, the myocardium extracts ∼80% of the oxygen from the blood passing through the coronary circulation. Therefore, coronary blood flow and the rate of oxygen consumption are closely matched in vivo. Coronary blood flow is controlled through several partially redundant mechanisms (17, 19). These mechanisms include open-loop control (in which signals that elicit an increase in cardiac oxygen consumption have a parallel effect of eliciting an increase in blood flow), feedback control (in which a variable that increases with an increasing degree of oxygen supply/consumption mismatch elicits increases in flow), and myogenic control (in which a change in transmural pressure elicits a change in active tension in the vascular wall). Open-loop (or feed-forward) control is mediated primarily through vasodilation by stimulation of β1- and β2-adrenoceptors, and vasoconstriction by stimulation of α-adrenoceptors on coronary vascular smooth muscle cells (4, 13, 24, 27). Sympathetic activation also induces physiological increases in myocardial oxygen consumption via activation of myocardial β-adrenoceptors (12, 13, 27). The feedback pathway is postulated to take the form of a local oxygenation-dependent signal that elicits vasodilation in response to decreased oxygen supply and/or increased oxygen metabolism. The plasma concentration of adenine nucleotides in coronary venous blood, which are derived from red blood cells in response to desaturation of oxyhemoglobin, is postulated to be the primary feedback signal (15, 22) where ATP and its metabolites ADP and AMP activate purinergic receptors on coronary vascular endothelial cells to initiate a conducted signal that leads to upstream coronary vasodilation (21, 22) (see Fig. 1). The model analysis is based on the characterization of steady-state responses of different flow control pathways (open-loop and feedback) that captures the observed relationships between myocardial oxygen metabolism and coronary flow, under physiological conditions and pharmacological blockade of the control pathways.
Fig. 1.
Schematic diagram of the adenine nucleotide hypothesis of feedback control of coronary blood flow. Oxygen (O2) is released from hemoglobin (Hb) in coronary capillaries in response to myocardial oxygen consumption. Deoxyhemoglobin facilitates the release of ATP from red blood cells (RBC) that acts on endothelial purinergic P2Y1 receptors to initiate a retrograde conducted response via gap junctions connecting endothelial cells. The conducted signals dilate the upstream arteriole smooth muscle cells via gap junctions and the release of nitric oxide (NO). Nucleotidases (NTase) in the plasma and on the surface of endothelial cells break ATP down to ADP, which activates P2Y1 receptors. ADP also activates P2Y13 receptors on the surface of RBC to inhibit the further release of ATP from RBC. ADP is broken down to AMP, which activates P1 receptors to generate a retrograde conducted vasodilator response. AMP is degraded to adenosine (ADO) that is rapidly taken up by RBC and endothelial cells. [Reproduced from Gorman et al. (22).]
The purposes of the present study are 1) to analyze experimental data on coronary blood flow and myocardial oxygen consumption in exercise and see if a simple control model can fit the available in vivo data (2, 15, 22–24); 2) to use the developed model for quantifying the relative contributions of open-loop and feedback flow control pathways with exercise; and 3) to determine if the adenine nucleotide hypothesis (15) for metabolic feedback control of coronary flow is consistent with data from exercise, cardiac pacing, and autoregulation experiments (1, 39).
MATERIALS AND METHODS
Experimental Data for Coronary Blood Flow Control Model
Hemodynamic data used to characterize different flow control pathways were obtained from four previously published studies from the Feigl laboratory (15, 22–24). All control studies were done using conscious dogs under both resting conditions and treadmill exercise. Experiments with pharmacological interventions were conducted under similar exercise conditions in which α-adrenoceptors were blocked by phentolamine administration (23, 24), and α- and β-adrenoceptors were blocked by both phentolamine and propranolol administration (23, 24). Purinergic vasodilation was inhibited by blocking endothelial purinergic receptors (P1 and P2Y1) with 8-phenyltheophilline (8-PT) and MRS 2500, and l-nitroarginine (LNA) to block conducted vasodilator signaling from the capillary to the upstream arteriole (22).
The total data set used here for model identification includes measurements of coronary flow, myocardial oxygen consumption, coronary arterial and venous oxyhemoglobin saturations, hematocrit levels, and mean arterial pressure from 26 animals under various treatments and exercise levels. There were 20 scattered missing values of the 1,228 primary measurements. The average value of the relevant treatment and exercise subgroup was used to replace the missing values. Data from one dog were excluded from the published data because of an artifact. In this case measured coronary venous oxyhemoglobin saturation was normal (12.3%) immediately after placement of the coronary sinus catheter, but was 34.5% ten days later on the day of the experiment, indicating that it had slipped part way out and was sampling a mixture of coronary venous and right atrial blood. This was not recognized at the time the data were assembled for publication. One [ATP] measurement was 9.5 standard deviations above the subgroup mean and was replaced with the subgroup mean value. Arterial pressure was not measured in the control state in the Farias et al. (15) study and was estimated at the relevant control myocardial oxygen consumption from the other experiments. Arterial oxyhemoglobin saturations were calculated from blood pH and the partial pressures of oxygen and carbon dioxide using the Reeves et al. (31) formula for dog blood. Coronary venous oxyhemoglobin saturation was calculated as given in block 3 below.
Coronary Blood Flow Control Model
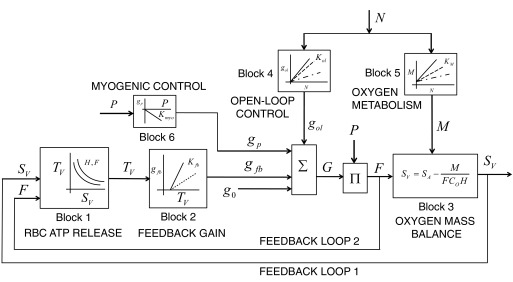
The overall architecture of the model is shown in Fig. 2. It has four main components.
Fig. 2.
Block diagram of the combined feed-forward, feedback, and myogenic control scheme for integrated control of coronary blood flow in vivo. The net vascular conductance (G) for coronary flow (F) is the summation of contributions to conductance from the open-loop pathways (gol), feedback pathways (gfb), myogenic pathway (gp) and basal conductance (g0). An input driving signal, assumed proportional to interstitial norepinephrine concentration, N, simultaneously affects the open-loop conductivity and myocardial oxygen metabolism (M), through blocks 4 and 5. The parameter Kol represents the open-loop gain, KM is the metabolic open-loop gain, Kfb is the metabolic feedback gain, and Kmyo is the myogenic gain. Through block 6, the myogenic contribution to conductance depends on the coronary arterial pressure P. Block 1 represents a model that predicts plasma ATP concentration, TV, in coronary venous blood as a function of hematocrit H, flow F, and venous oxygen saturation SV.
1) Open-loop control.
Open-loop control, also called “feed-forward” or “yoked (parallel)” control, where myocardial oxygen metabolism and adrenergic blood flow control are simultaneously modulated by sympathetic discharge to the myocardium and the coronary vessels (5, 17, 19, 23), is one component. This open-loop control is incorporated into blocks 4 and 5 of the model, as detailed below.
2) Feedback control.
Feedback control, where the rate ATP release from red blood cells increases with decreasing oxyhemoglobin saturation acts on vascular endothelial purinergic receptors to stimulate a conducted upstream vasodilation (15, 19, 22), is a second component. A schematic showing the adenine nucleotide hypothesis of negative feedback control is shown in figure 1 from Gorman et al. (22) (see Fig. 1). This metabolic control function is represented in model blocks 1 and 2 of Fig. 2.
3) Myogenic control.
Myogenic control, where the tendency for a resistance vessel to increase in diameter in response to increase in coronary transmural pressure is opposed by an increase in vascular smooth muscle tone (1, 16, 25), is a third component. This pressure-mediated control function is represented in model block 6 of Fig. 2.
4) Oxygen mass balance.
Oxygen mass balance, from the Fick equation, represented in block 3 of Fig. 2, where steady-state oxygen extraction rate and myocardial oxygen metabolism are equated, is a fourth component. This mass balance yields a nonlinear relationship between venous oxyhemoglobin saturation and myocardial oxygen metabolism.
Here, the integrated control of coronary blood flow is modeled as a combined effect of open-loop, feedback (adenine nucleotide-mediated), and myogenic control to coronary vascular conductance, controlling oxygen delivery to the myocardium. The model is used to analyze data on venous oxyhemoglobin saturation versus rate of oxygen consumption in the myocardium from rest to exercise (15, 22–24), under control and pharmacological blockade of α-adrenergic pathways by phentolamine, β-adrenergic pathways by phentolamine and propranolol, and feedback pathways by purinergic receptor blocking agents. A block diagram representation of the model showing various pathway functions, which includes no time-dependency and thus applies only to physiological steady states, is shown in Fig. 2.
Block 1: ATP Release and Transport
It is assumed that oxygen saturation in a capillary decreases linearly from the arterial to venous end:
| (1) |
where l ∈ (0,1) represents the position along the capillary with l = 0 at the arterial end and l = 1 at the venous end. The variables SA and SV represent the arterial (S = SA) and venous (S = SV) oxyhemoglobin saturation.
Plasma ATP transport is governed by release from red blood cells and advection in the blood. Assuming that the rate of ATP release from red blood cells declines exponentially with red blood cell oxygen saturation, the steady-state continuity equation for plasma ATP concentration T is
| (2) |
where JT is the rate of ATP release into plasma, which is assumed proportional to hematocrit, H. The variable F represents the blood flow; the constant Vc is the capillary volume density in the myocardium (set to 0.04 ml/g); J0 and S0 are adjustable parameters.
Equation 2 has solution
| (3) |
where TA is the arterial plasma ATP concentration, TA = T(0), and is an adjustable parameter.
Block 1 in the overall coronary flow control model outputs venous plasma ATP concentration TV based on the input flow and metabolic rate:
| (4) |
The model for block 1 invokes three adjustable parameters J0, S0, and TA to match observations (15) on coronary venous plasma [ATP] at different flows and venous oxyhemoglobin saturation. Equation 4 determines the relationship between plasma [ATP], and the other variables in the model.
Block 2: ATP-Dependent Feedback Pathways Conductance
The model assumes a simple linear dependence of the feedback-mediated contribution to overall conductivity and TV:
| (5) |
where Kfb is an adjustable parameter, the gain of the feedback pathway, and TA is arterial plasma [ATP].
Block 3: Oxygen Mass Balance
The relationship between coronary flow F, myocardial oxygen metabolism M, and venous and arterial oxygen saturations is obtained from mass conservation. Specifically, the myocardial oxygen consumption is equal to the flow multiplied by the arterial-venous oxygen content difference. In terms of oxyhemoglobin saturation,
| (6) |
where H is the hematocrit, Co is the oxygen-carrying capacity of red blood cells, and Co·H is the oxygen content of blood at 100% oxyhemoglobin saturation. For simplicity this equation ignores the secondary contribution of dissolved oxygen to total oxygen content in the blood. Coronary venous oxyhemoglobin saturations are calculated from Eq. 6:
Block 4: Sympathetic Open-Loop Control of Coronary Flow
The signal transmitted by the open-loop pathway is assumed to be proportional to the concentration of cardiac interstitial norepinephrine N:
| (7) |
where Kol is an adjustable parameter that represents the open-loop gain, which determines the open-loop contribution to overall conductivity. The variable N is varied from 0 to 15 nM as the input to the model.
Block 5: Effect of Sympathetic Inputs on Myocardial Oxygen Metabolism
The sympathetic input signal N simultaneously affects the myocardial oxygen metabolism M, which is expressed as:
| (8) |
where KM is an adjustable parameter that determines the relationship between M and N from resting to exercise conditions. This parameter KM is identified from experimental estimates of myocardial N measured as a function M in conscious exercising animals. The adjustable parameter M0 is the myocardial oxygen metabolism at zero N, identified from control experiments (24).
Block 6: Myogenic Control of Coronary Flow
Pressure-mediated myogenic control is modeled using simple linear relationship between arterial pressure P and myogenic contribution to conductance:
| (9) |
where Kmyo is an adjustable parameter, representing myogenic gain of the pressure-flow relationship. The parameter Kmyo determines the contribution of arterial pressure change to net vascular conductance.
Total Conductance
The net conductance G of coronary vasculature is defined as the summation of conductance of open-loop, feedback, myogenic, and basal conductance g0,
| (10) |
The contribution to flow of the open-loop and feedback pathways can be calculated as the conductance of these pathways (gol and gfb) times the mean arterial pressure P. The coronary flow is computed from the pressure P and total conductance G,
| (11) |
At given values of the inputs N and P, Eqs. 4–11 are solved as follows:
1) The variables gol, M, and gp are computed directly from Eqs. 7, 8, and 9.
2) The five remaining unknowns F, SV, TV, gfb, and G are determined numerically by satisfying Eqs. 4, 5, 6, 10, and 11. These equations include four fixed constants Vc, H, SA, and Co and a total of eight adjustable parameters J0, S0, TA, KM, M0, Kol, Kfb, and Kmyo, that are systematically identified by fitting model predictions to the data (15, 22–24) as detailed below.
Sensitivity Analysis
The sensitivity of identification of all adjustable model parameters is quantified by computing the parameter sensitivity indices, defined as the relative change in mean-squared difference in model error associated with a 10% change in parameter value. Specifically, we define the sensitivity index
where p is the estimated value of a given parameter and E(p) is minimum error associated with value p. This index represents the fractional change in error relative to a fractional change in parameter value. For example a value of 1 means that a 1% change in parameter value results in a 1% change in error function.
RESULTS
Identification of Block 1: ATP Release and Transport
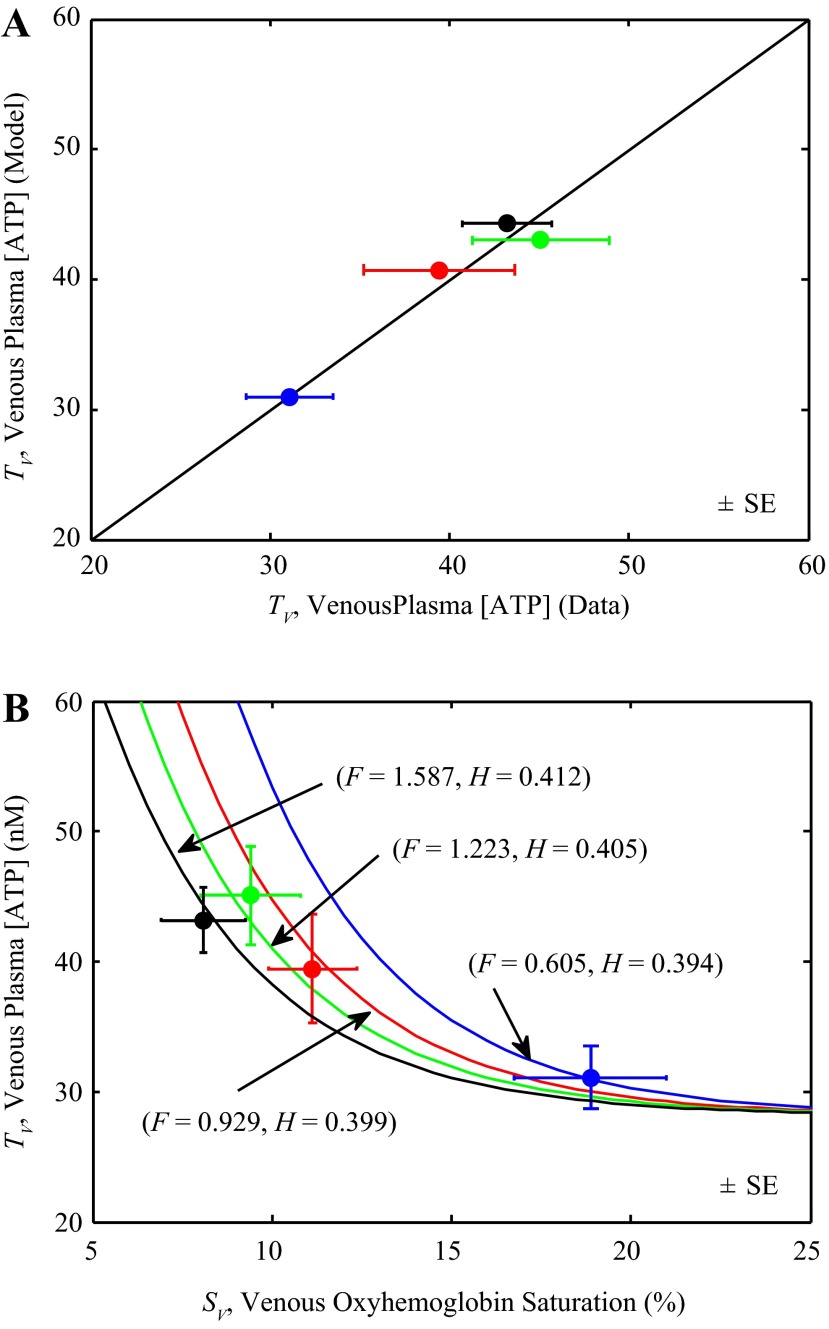
The simple model of ATP transport in blood, which is assumed to depend on flow, hematocrit, and oxyhemoglobin saturation, is identified by fitting Eq. 4 to data on venous plasma ATP at different flows, oxygen consumption rates, and hematocrit, shown in Fig. 3. Each data point represents the mean of data from 10 animals measured at one of four different experimental conditions (15): rest and three different exercise levels. Experimental data are plotted as solid circles and model predictions as solid lines. Since each data point is associated with distinct values of H and F as well as SV and TV, there is a distinct curve in the SV vs. TV plane associated with each data point, i.e., a contour of TV vs. SV for specific fixed values of H and F. The model predictions of TV with these distinct values of F and H are shown in different line/data colors. At a given value of hematocrit H and flow F, Eq. 4 predicts that TV decreases as SV increases, as illustrated in the Fig. 3. The model also predicts that for a given level of SV, TV decreases with F and increases with H. Thus as flow increases the model predicts that the relationship between TV and SV shifts to the left.
Fig. 3.
Identification of block 1. A: model-predicted coronary venous plasma [ATP], TV, is compared to experimental data (closed circles) of Farias et al. (15). B: coronary venous plasma [ATP] is plotted as a function coronary venous oxyhemoglobin saturation (%). Model simulations of Eq. 4 are compared to data of Farias et al. (15), measured from rest to exercise. Each data point represents mean of data from 10 animals measured at one of four different experimental conditions: rest and three different exercise levels. Since a distinct value of flow F (ml·min−1·g−1) and hematocrit H is associated with each data point, the model simulates a distinct curve in the TV vs. SV relationship for each pair of F and H.
Parameters for block 1 were estimated based on the model fits to the data illustrated in Fig. 3. The arterial plasma ATP concentration TA was estimated based on TV vs. SV data of Farias et al. (15) and was found to be close to the value reported by Farias et al. Estimated values of the parameters J0, S0 and TA for block 1 are reported in Table 1. The model predictions of TV are in good agreement with the data (Fig. 3A) and the model accurately describes the data on TV vs. SV at different flow and hematocrit levels (Fig. 3B).
Table 1.
Estimated model parameters, sensitivity indexes, and constants
| Name | Value (Sensitivity index) | Units | Dataset Used for Identification |
|---|---|---|---|
| Adjustable parameters | |||
| J0 | 283.388 (8.967) | μM/min | Fig. 3 |
| S0 | 0.0387 (127.72) | unitless | Fig. 3 |
| TA | 28.151 (44.276) | nM | Fig. 3 |
| KM | 22.767 (9.635) | μl O2·min−1μg−1·nM−1 | Fig. 4 |
| M0 | 33.535 (0.355) | μl O2·min−1·g−1 | Fig. 4 |
| Kmyo | 0 | ml·min−1·g−1·mmHg−1 | Figs. 6 and 7 |
| g0 | 0.63×10⁻³ (0.234) | ml·min−1·g−1·mmHg−1 | Fig. 5 |
| Kol | 0.9797×10⁻³ (6.157) | ml·min−1·g−1 mmHg−1·nM−1 | Figs. 6 and 7 |
| Kfb | 0.3507×10⁻³ (0.394) | ml·min−1·g−1 mmHg−1·nM−1 | Figs. 6 and 7 |
| Fixed parameters | |||
| Vc | 0.04 | ml/g | |
| SA | 0.955 | unitless | |
| Co | 476 | μl O2/ml | Reeves et al. (31) |
Identification of Block 5: Effect of Sympathetic Input on Oxygen Metabolism
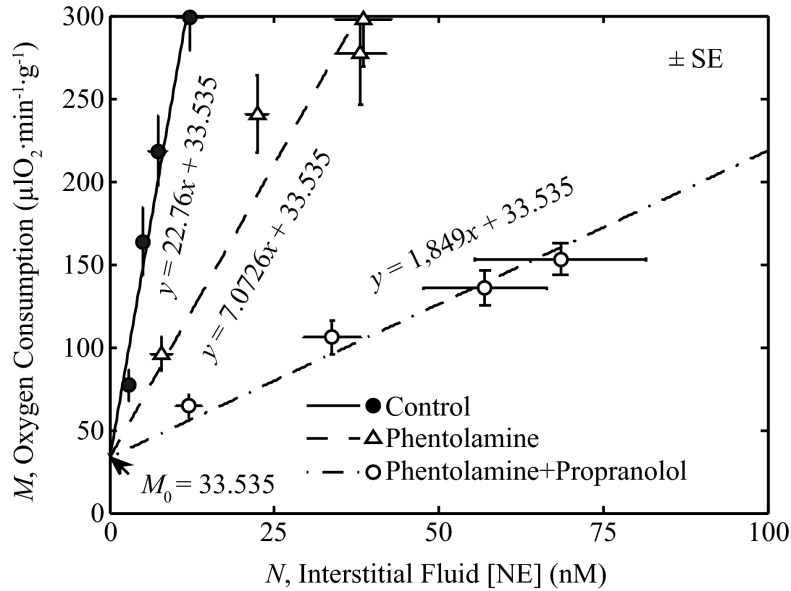
The effect of the sympathetic open-loop signal on myocardial oxygen metabolism (M) described using linear relationships between the interstitial norepinephrine concentration (N) is shown in Fig. 4. The parameter KM that relates M to N was estimated from the data of Gorman et al. (24) by least-squares fitting the straight line with slope KM and intercept M0 of Eq. 8 to the data. With the intercept of Eq. 8, M0 was chosen based on the control exercise data. Specifically, three different values of KM were estimated to represent the relationship between M and N under control conditions, after administration of phentolamine, and after administration of phentolamine + propranolol.
Fig. 4.
Identification of block 5. Equation 8 is fit to data of Gorman et al. (23, 24) relating interstitial fluid norepinephrine (NE) concentration, N to M. The estimated value of KM is 22.767 μl O2·min−1·g−1·nM−1 for control, 7.072 μl O2·min−1·g−1·nM−1 for experiments with phentolamine, and 1.849 μl O2·min−1·g−1·nM−1 for experiments with phentolamine + propranolol. The estimated value of the y-intercept, M0, is 33.535 μl O2·min−1·g−1.
Identification of Basal Conductance
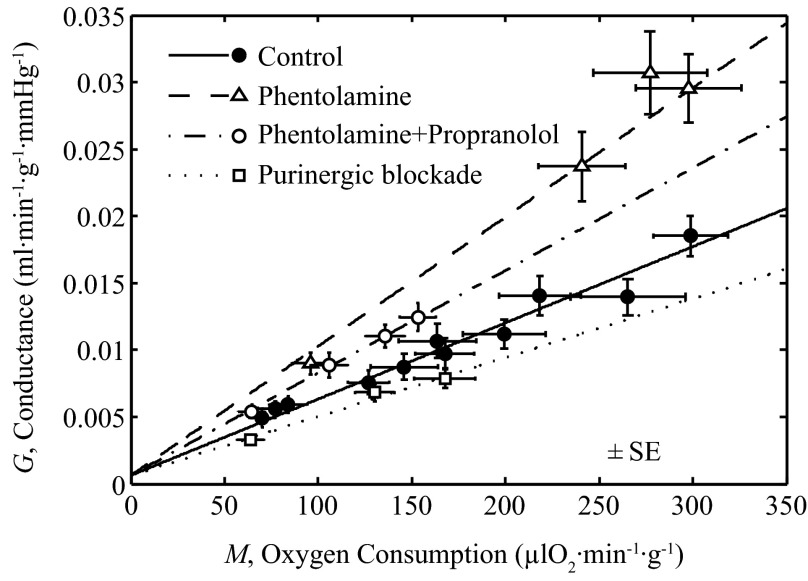
The parameter g0 in Eq. 10 is estimated by assuming that it represents the basal conductance at M = 0 (with no input from the open-loop and feedback pathways). Specifically, the total observed conductance (flow F divided by pressure P) as a function of M was fit with a linear relationship, as illustrated in Fig. 5. The four exercise data sets shown in the figure correspond to control conditions, and data obtained with phentolamine, with phentolamine and propranolol, and with purine receptor blockade (15, 22, 23). Each experimental condition is represented with a unique slope associated with that condition, but using a common intercept g0 for all data sets.
Fig. 5.
Identification of g0. Straight-line fits to data on G vs. M, measured under various exercise conditions (15, 22, 23). The y-intercept is a measure of g0 (g0 = 0.00063 ml·min−1·g−1·mmHg−1). Control data points are for animals with no pharmacological interventions. A common g0 is used to describe the data under various pharmacological blockades and control conditions.
Identification of Blocks 2, 3, 4, and 6: Open-Loop, Feedback, and Myogenic Gains
The three model parameters, Kol, Kfb, and Kmyo, are estimated by fitting the output of the integrated model of Fig. 2 to data plotted in Fig. 6, as detailed below.
Fig. 6.
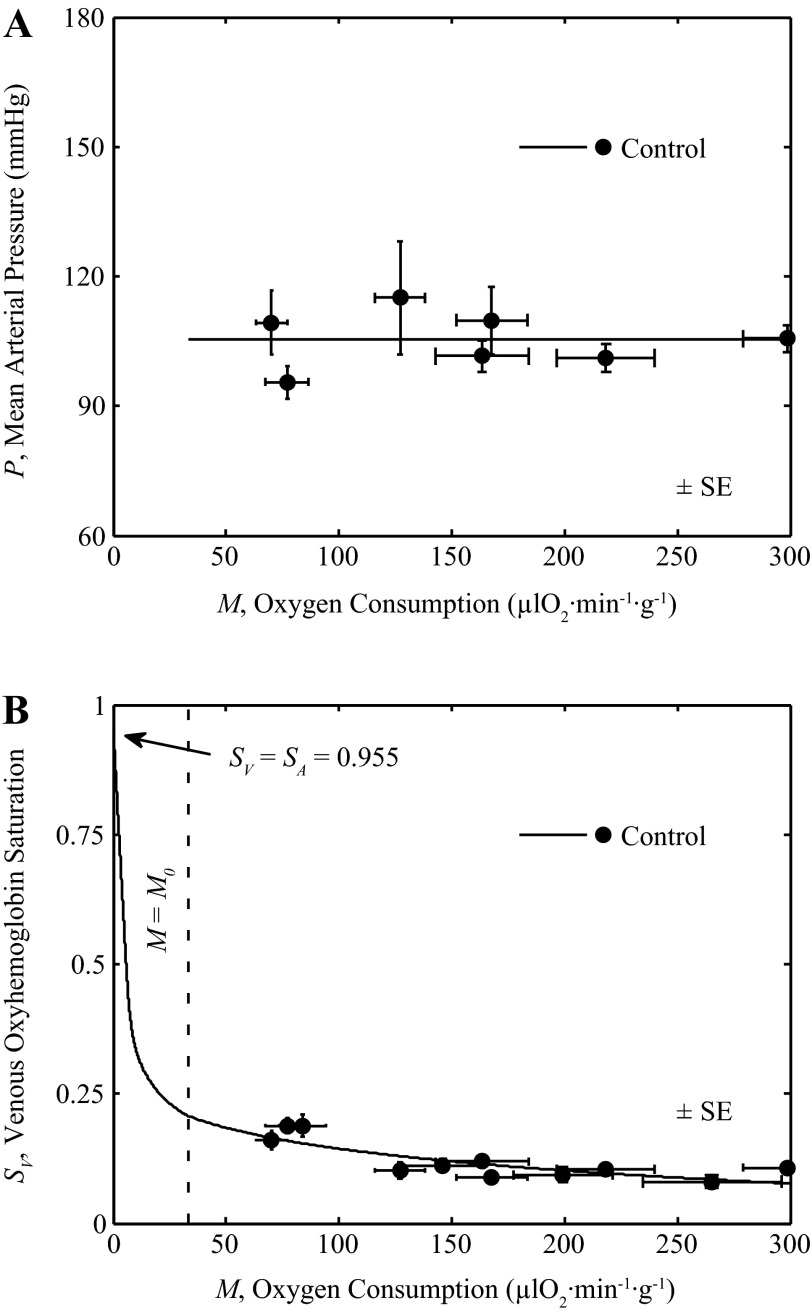
Integrated model behavior for control condition. Output of integrated model of Fig. 2 is compared to in vivo data on venous oxyhemoglobin saturation and myocardial oxygen consumption. A: mean arterial pressure as a function of M is plotted for control conditions, measured from rest to exercise (22, 23). A straight line fit is used to set P for the control model. B: the output of the integrated model is compared to the experimental data on SV vs. M, measured from rest to exercise, under control conditions (15, 22, 23).
Figure 6, A and B, plots data on P versus M and SV versus M obtained under control physiological conditions in awake animals during rest and exercise reported by Gorman et al. (22, 23) and Farias et al. (15). To match simulations to data (15, 22, 23) in Fig. 6B the full model was used, with pressure determined by a straight-line fit to the P versus M data (22, 23) in Fig. 6A: P = (0.0001 mmHg·μl O2−1·min1·g1)M + 105.41 mmHg. To represent these normal control conditions the model is driven by varying N over the range of 0 to 15 nM, to attain values of M from M0 to 300 μl O2−1·min1·g1. To illustrate SV vs. M for values of M less than M0, N is held at 0 and M varied from 0 to M0.
For all simulations illustrated in Fig. 6, an average observed value of H and SA over whole range of M was used based on measured values under control conditions (H = 0.3942 and SA = 0.955). Fitting the model for all control conditions reveals the value of the Kmyo is not identifiable from the available data, because there was very little change in arterial pressure as shown in Fig. 6A, and that data are matched with Kmyo set to zero. Thus the data in Fig. 6 are effectively fit with only two adjustable parameters: the gains Kol and Kfb. The result that the effective gain Kmyo may be set to zero does not imply that the model predicts the absence of myogenic tone in the coronary arterioles because in the absence of myogenic tone, an increase in pressure would be expected to result in an increase in vessel lumen diameter and the effective value of Kmyo would be negative.
Effects of α-Adrenoceptor, β-Adrenoceptor and Purinergic Receptor Blockade
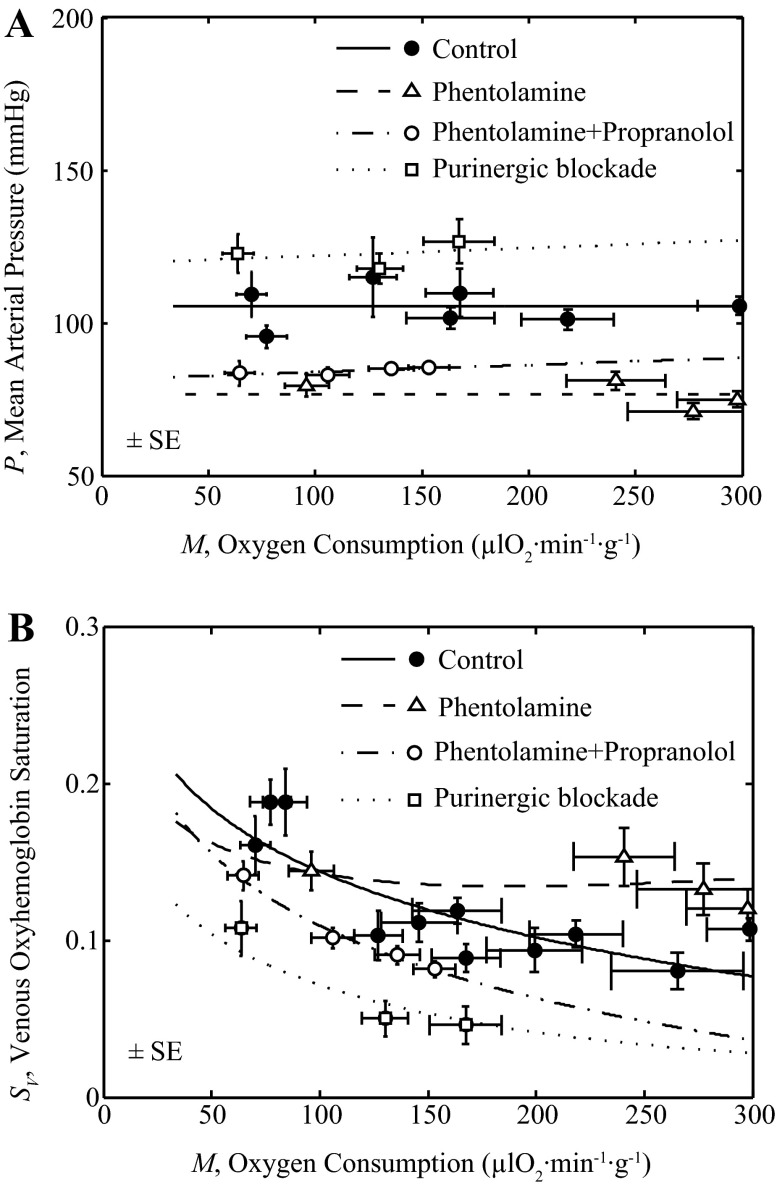
The model was used to simulate the effects of various pharmacological agents that were used in these studies (22–24), on open-loop and feedback pathway gains. These experiments are simulated using the full integrated model, supplying pressure as a function of oxygen metabolism (M) determined by fitting straight-line relationships to the data, as illustrated in Fig. 7A. For phentolamine, the relationship is P = (0.0001 mmHg·μl O2−1·min1·g1)M + 76.6 mmHg; for phentolamine + propranolol P was computed P = (0.0236 mmHg·μl O2−1·min1·g1)M + 81.489 mmHg; for purinergic receptor blockade, P was computed P = (0.0258 mmHg·μl O2−1·min1·g1)M + 119.33 mmHg. Figure 7A shows the data and model simulations of P vs. M under control, phentolamine, phentolamine + propranolol and purinergic block conditions.
Fig. 7.
Analysis of pharmacological blockade data. Fits to data from control, from phentolamine, from phentolamine + propranolol, and from purinergic block experiments are illustrated. Control data and model fits are identical to those of Fig. 6. Data are from Gorman et al. (22–24) and Farias et al. (15) under control, α-adrenoceptor blockade (phentolamine), and β-adrenoceptor blockade (phentolamine + propranolol) (23), and from Gorman et al. (22) under purine receptor blockade. The control model is adjusted by reducing Kol to 75% of its control value (see Table 1) to fit the phentolamine data and to 6.67% of its control value to fit the phentolamine + propranolol data. The feedback gain Kfb was set to 8.27% of its control value to fit purinergic block data. A shows the fits of P vs. M to the data obtained under these four conditions. B shows the fits of the model to Sv vs. M data, including error estimates (±SE) for SV and M measurements.
Model simulations were compared to data from Gorman et al. (23, 24) obtained using phentolamine to block α-adrenoceptors, and phentolamine plus propranolol to block β-adrenoceptors that mediate the effects of adrenergic stimulation on vessel conductivity and M to determine if the model can capture the observed relationship between venous oxygenation and myocardial oxygen uptake under these conditions. Similarly, the model simulation was compared to data from Gorman et al. (22) obtained with inhibitors to block the effects of the feedback pathway signal on vessel conductivity and M to determine if the model can capture the observed relationship between SV and M under this condition. Hematocrit (H) was fixed at 0.3942 for control, 0.3467 for phentolamine, 0.3537 for phentolamine plus propranolol and 0.3933 for purinergic blockade (average of reported values over whole range of M). Figure 7B plots the global fits of the full integrated control model to the data on SV vs. M under control, as well as the data obtained following administration of phentolamine, phentolamine + propranolol and purinergic blockade.
To match the data on phentolamine and phentolamine plus propranolol the value of Kol was reduced compared to control, indicating that these interventions reduced the effective open-loop gain in the system. Specifically, Kol was reduced to 75% of its control value to match the phentolamine case and to 6.67% of its control value to match the phentolamine plus propranolol case. To match the data obtained using purinergic blockade the feedback gain Kfb was reduced to 8.27% of its control value.
Validation of Predicted Venous ATP Levels
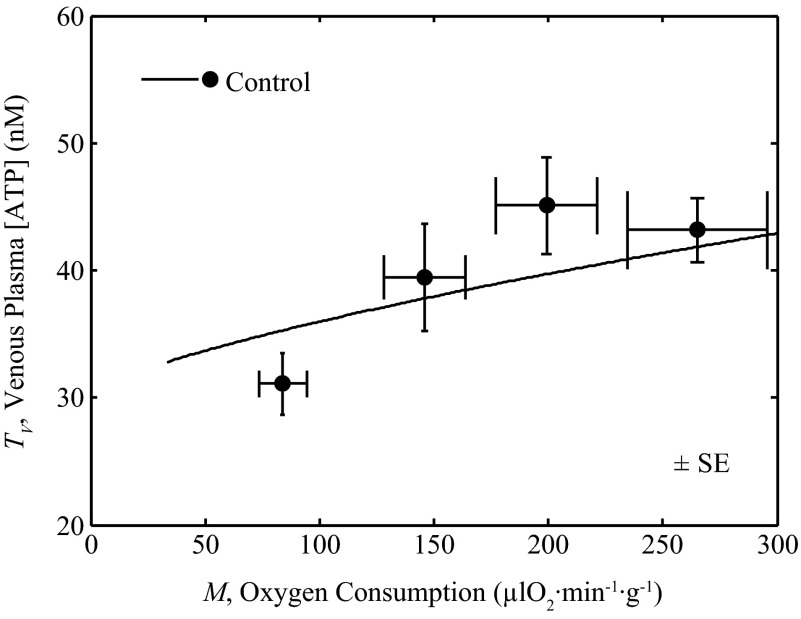
In estimating values of parameters associated with block 1, flow (F) and metabolic rate (M) were both fixed at experimentally estimated levels. To test the ability of the model to effectively represent the observed relationship between venous [ATP] and metabolic rate, predictions based on the integrated model (where M and F are computed as variables) are compared to measurements of venous ATP concentration (TV) as a function of M in Fig. 8. The model simulation shows reasonable agreement to the data of Farias et al. (15).
Fig. 8.
Validation of predicted venous ATP levels. Coronary venous plasma [ATP], TV, is plotted as a function of metabolic rate M. The line is the model prediction. Filled circles are data from Farias et al. (15), representing control exercise conditions.
Validation of Predicted Feedback Regulation in the Absence of Open-Loop Pathway with Cardiac Pacing
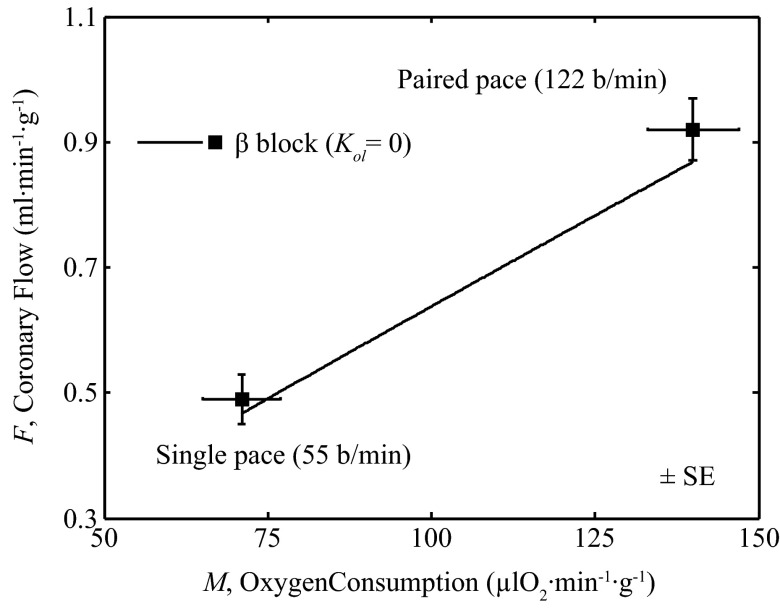
To validate the ability of the model to effectively represent the feedback pathway, a model simulation was compared to data from Yada et al. (39), in which hearts were paced in vivo under anesthetized conditions with β-adrenoceptor receptor blockade. Figure 9 shows measured flow (F) and metabolic rate (M) obtained during single cardiac pacing at 55 beats/min (lower M) and after 60 s of paired cardiac pacing at 122 beats/min. (higher M). To simulate this experiment the open-loop gain was set to zero (gol = 0). The oxygen metabolism (M) varied from 71 to 140 μl O2−1·min1·g1. Arterial pressure was varied according to P = (0.188 mmHg·μl O2−1·min1·g1)M + 90.623 mmHg, to match the observed pressures of 104 mmHg during single pacing and 117 mmHg during paired pacing. Thus, here, a special case of the model was simulated with no open-loop component and with P determined as an explicit function of M. The model prediction (solid line) is in reasonable agreement with the observations, providing independent validation of the function of the feedback pathway in the model.
Fig. 9.
Coronary flow during cardiac pacing with β-adrenoceptor receptor blockade. Model prediction (solid line) is compared to data (squares) on coronary flow (F) vs. myocardial oxygen consumption (M) during cardiac pacing with β-adrenoceptor receptor blockade (39). For this simulation, M was varied from 71 to 140 μl O2−1·min1·g1. Arterial pressure was varied according to P = (0.188 mmHg·μl O2−1·min1·g1)M + 90.623 mmHg, to match the observed pressures of 104 mmHg during single pacing and 117 mmHg during paired pacing. The open-loop signal was set to zero (Kol = 0).
Validation of Predicted Autoregulatory Function
Coronary resistance vessels constrict (lower hydraulic conductivity) in response to increases in arterial pressure and dilate (increase conductivity) in response to decreases in pressure (1, 29, 38). This phenomenon, termed autoregulation, contributes to the maintenance of a relatively constant flow over a range of arterial pressure. Two key physiological contributors to autoregulation are metabolic feedback and the myogenic response, both represented in the coronary control model. To test the ability of the model to capture coronary autoregulation, model predictions were compared to the data of Broten and Feigl (1), in which coronary arterial pressure was experimentally increased in anesthetized dogs under α- and β-adrenoceptor plus cholinergic blockade.
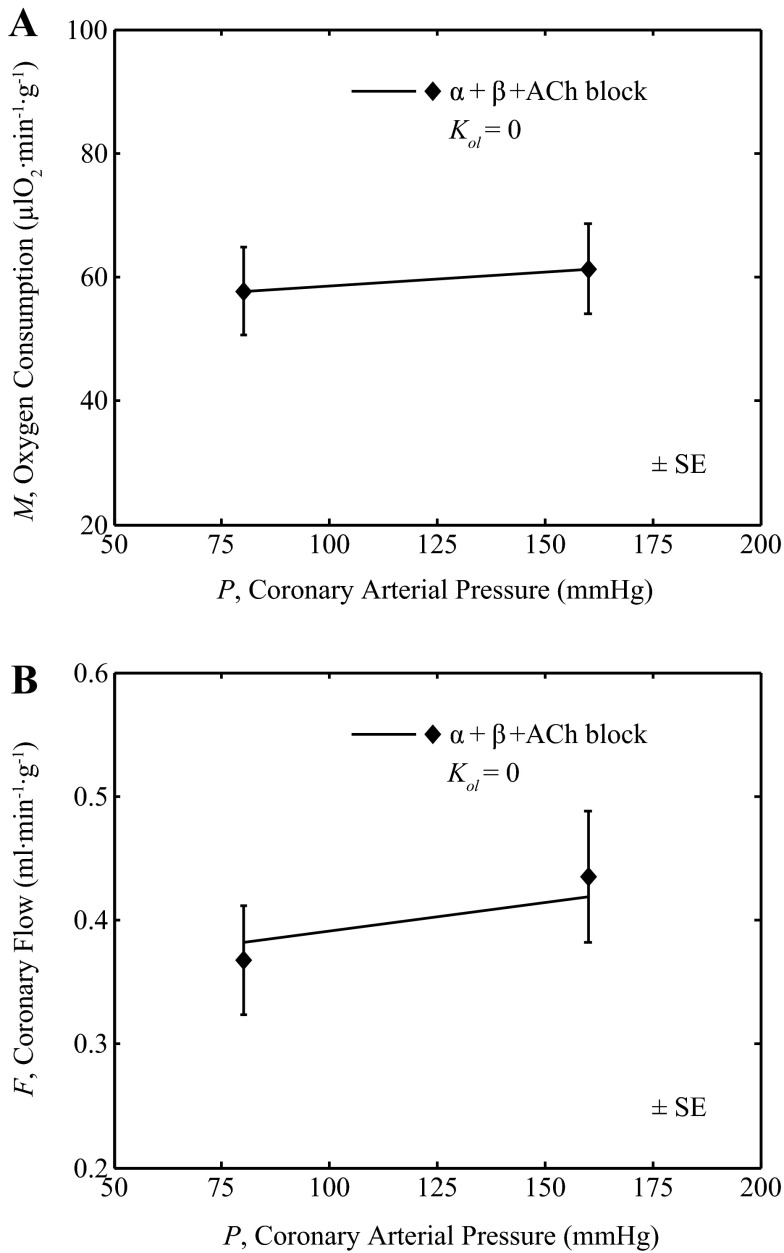
Data from Broten and Feigl (1) on oxygen consumption rate (M) and flow (F) in response to a doubling of coronary arterial pressure are plotted in Fig. 10. The experimental conditions are simulated by assuming that the open-loop signal is zero (gol = 0) while using all the other parameter values from Table 1 (including Kmyo = 0). The observed small increase in M with increasing coronary arterial pressure (P) (called the Gregg effect) is accounted for in the model by assuming a simple linear relationship: M = (0.045 μl O2·min−1·g−1·mmHg−1)P + 54.1 μl O2·min−1·g−1. Thus, here, a special case of the model was simulated with no open-loop stimulation and with M determined as an explicit function of P. The model-predicted flow is compared to data from Broten and Feigl (1) in Fig. 10B. The reasonable agreement between the model prediction and the data demonstrates the ability of the model to capture the phenomenon of autoregulation.
Fig. 10.
Effect of coronary arterial pressure on coronary flow. A: metabolic rate M was matched to the data observed by Broten and Feigl (1) where coronary arterial pressure was set at 80 mmHg and 160 mmHg, with a pump. B: the model prediction (solid line) of the coronary flow as a function of coronary arterial pressure (P) plotted and compared to data (closed diamonds) from Broten and Feigl (1), measured in anesthetized animals under combined α-adrenergic, β-adrenergic and cholinergic (ACh) blockade. For this simulation the open-loop gain was set to zero with all other parameter values from Table 1.
The results shown in Fig. 10 are in agreement with the studies from Spaan's laboratory (6, 8, 38). In the Spaan studies a step change in coronary artery pressure resulted in autoregulation of flow that was described by a mathematical model that represented a dependence on pressure and oxygen consumption rate. Interestingly, Vergroesen et al. (37) observed that the speed of coronary vascular regulation was slowed by cardiac denervation. The present simulation is based on steady-state measurements and provides no information on the speed of the response.
Integrated Control of Coronary Blood Flow
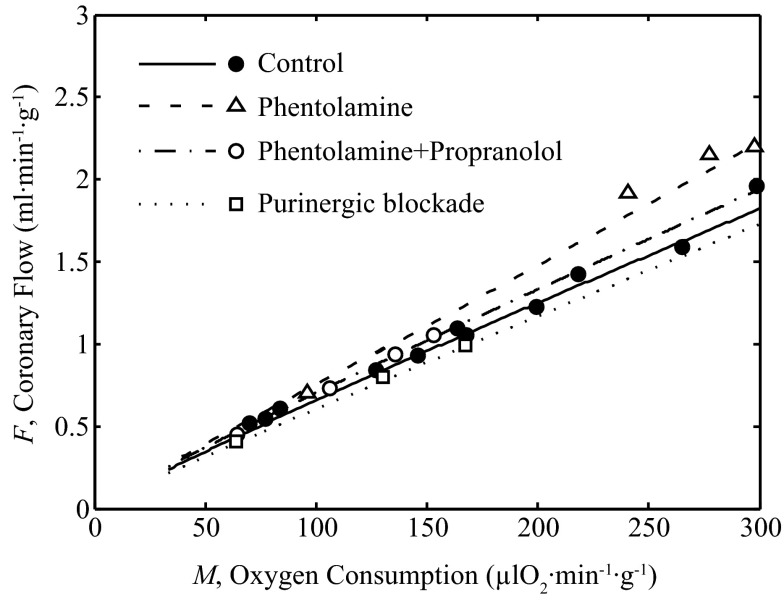
The model, which is able to effectively describe the relationship between coronary blood flow and myocardial oxygen consumption in vivo, can be used to probe the contributions of the various components of the model to overall flow control. The ability of the model to effectively represent the response in flow (F) to changes in exercise level is recapitulated in Fig. 11.
Fig. 11.
Coronary blood flow vs. oxygen consumption rate. Model fits are compared to exercise data on coronary flow F vs. M with and without partial blockade of α- and β-adrenoceptors, and purine receptors. These simulations and associated model parameter values are same as those in Fig. 7.
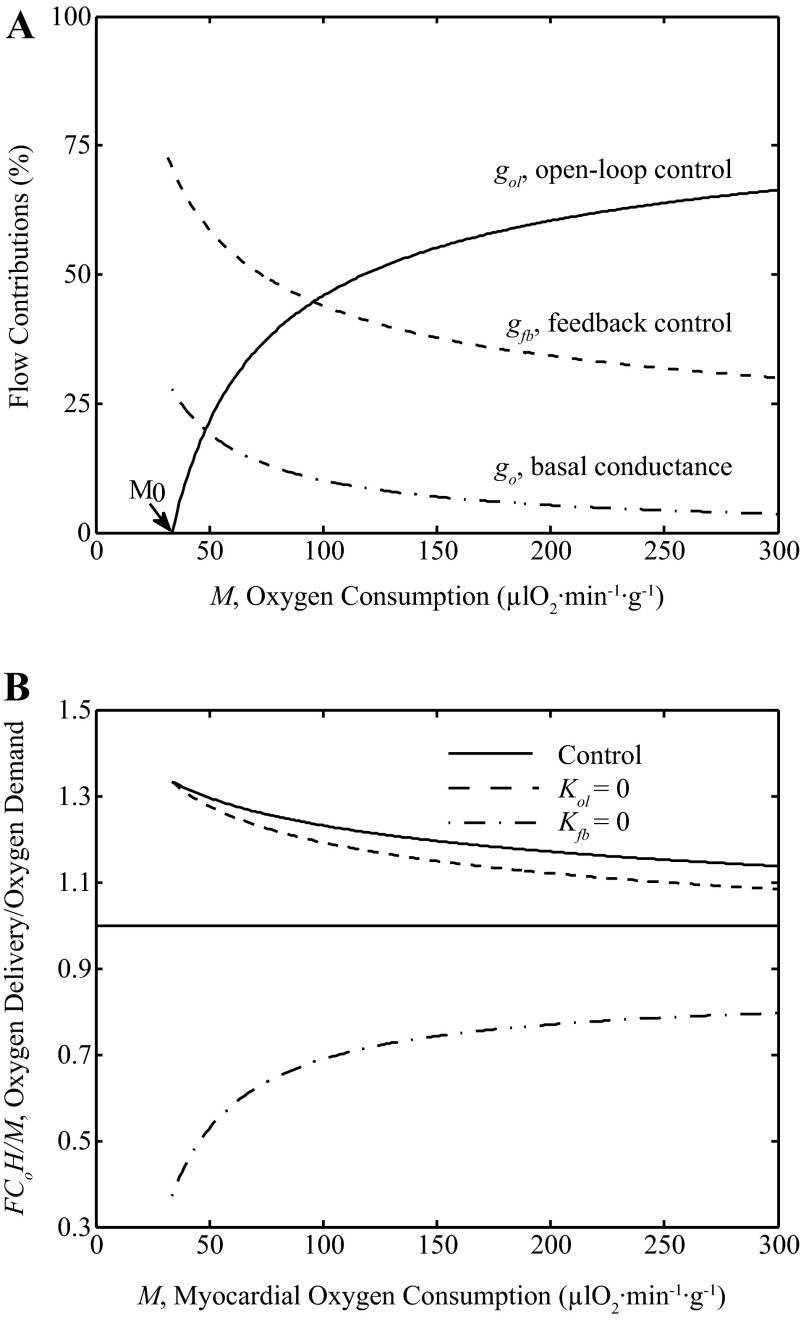
To illustrate the predicted relative contributions of open-loop and feedback control pathways to coronary flow F, Fig. 12A shows the relative contribution to flow of each pathway as functions of exercise myocardial oxygen metabolism (M). The model predicts that under physiological conditions the open-loop, feedback pathways and basal conductance have significant contributions to total conductivity G, with the relative contribution of the open-loop pathway increasing with increasing exercise and oxygen metabolism. Over the physiological range from baseline conditions (M ≈ 75 μl O2·min−1·g−1) to maximum exercise (M ≈ 250–300 μl O2·min−1·g−1) the variable gol, which is the open-loop component of conductivity, contributes 37–67% of the sum G = gol + gfb + gp + g0. The relative contribution from gfb is approximately 45-30% over the observed range of exercise levels. The relative contribution from basal conductance go reduces from 14 to 8% of the total conductance G as metabolism rate increases from resting to high levels.
Fig. 12.
Relative contributions to coronary flow. A: the relative contributions to total exercise conductivity G = gol + gfb + gp + g0 are plotted as function of oxygen utilization rate M. Model predictions show ∼37–67% contribution by the open-loop pathway conductance (gol), ∼30–45% contribution by the feedback pathway conductance (gfb) and ∼14-8% contribution by the basal conductance (g0), from rest to exercise. B: the ratio of oxygen delivery rate and demand rate (F·Co·H/M), is plotted as a function of M under physiological control (solid line), in the absence of feedback control (Kfb = 0: dotted line) and in the absence of open-loop control (Kol = 0: dashed line). For these simulations, the model uses the parameters from Table 1 with pressure P = 105.41 mmHg. A ratio of oxygen delivery divided by oxygen demand below one when feedback is simulated to be zero is not sustainable in steady state, and demonstrates that feedback control is essential.
Thus, the model predicts that under normal control physiological conditions the open-loop pathway represents a higher contribution to overall control of coronary flow than the feedback pathway when myocardial oxygen consumption is greater than ∼100 μl O2·min−1·g−1. This prediction is consistent with the relationship between venous ATP concentration and oxygen consumption rate plotted in Fig. 8. The relationship is steeper at lower oxygen consumption rates than at higher oxygen consumption rates, as the relative contribution from the open-loop pathway is predicted to increase with increasing oxygen consumption rate (as shown in Fig. 12).
However, this prediction should not be interpreted as yielding a relative ranking of the physiological importance of these pathways. More insight into the importance of these pathways is obtained by simulating how the model behaves when these pathways are independently removed from the system. Figure 12B illustrates the ability of feedforward and feedback pathways in matching the oxygen delivery and extraction in the myocardium, from rest to exercise under control conditions, while setting Kol = 0 and while setting Kfb = 0. Specifically, the ratio of oxygen delivery rate and oxygen utilization rate is computed and plotted as a function of M. When this ratio is greater than one, there is enough flow to meet the demand. When this ratio is less than one there would not be enough flow to meet the demand, which is not sustainable during steady-state conditions. The plot illustrates how the effects of removing the feedback pathway are much more severe than those of removing the open-loop pathway. When the open loop is set to zero, SV drops compared to the control case, eliciting a response in the feedback signal. In contrast, when feedback gain is set to zero, there is no compensatory mechanism in the model. The ratio of oxygen delivery to demand becomes less than one with Kfb = 0, indicating the demand outpaces delivery. (The reason why the delivery is able to meet oxygen demand with Kfb = 8.27% of the control level in Fig. 7 is that in addition to the simulated ATP levels increasing to overcome the block, the perfusion pressure increases during purinergic block. The model simulations in Fig. 12 are with individual gains set to zero with pressure set to the range observed under control conditions.) Although under physiological conditions the open-loop pathway contribution to conductivity is predicted to be greater than the feedback contribution, removing the feedback pathway has a more drastic effect on model behavior than removing the open-loop pathway. This is because when the open-loop pathway is removed, the feedback pathway responds to compensate for the perturbation. When the feedback pathway is removed there is, by definition, no mechanism for the open-loop pathway to sense and compensate for the associated disturbance.
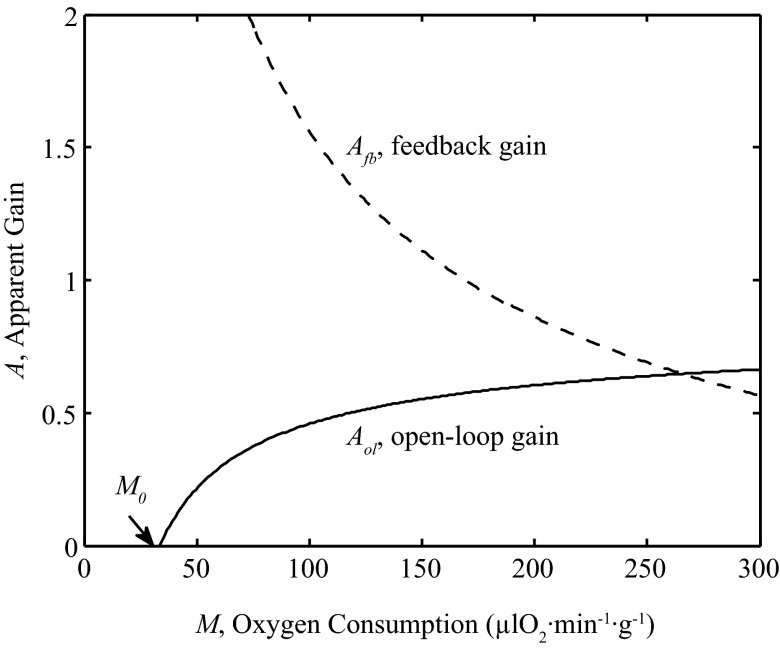
The parameter Kfb is a quantity with dimensions of conductivity per ATP concentration that represents the amount that conductivity G increases with increasing venous plasma [ATP], TV. Similarly the open-loop gain parameter Kol represents the amount that G increases with increasing interstitial norepinephrine concentration, N. In contrast, the unitless physiological gain of each pathway is defined as the relative change in conductivity that is elicited by a change in the signal to each pathway. Specifically, an apparent open-loop gain may be defined
| (12) |
and the apparent feedback gain as
| (13) |
The values of these apparent gains for the model simulated under control conditions are plotted as function of M in Fig. 13. Near baseline resting levels of M the apparent feedback gain is approximately 1.6 meaning that a 1% decrease in SV would result in a roughly 1.6% increase in flow. The ability of the feedback pathway to respond gradually diminishes as M is increased.
Fig. 13.
Contributions of open-loop and feedback gains. The apparent open-loop gain (Aol: solid line), defined by Eq. 12, and apparent feedback gain (Afb: dashed line), defined by Eq. 13, are plotted as functions of M under physiological control condition. For these simulations, the model uses the parameters from Table 1 with pressure given by P = (0.0001 mmHg·μl O2−1·min1·g1) M + 105.41 mmHg.
DISCUSSION
A mathematical model of coronary blood flow control was developed to analyze in vivo steady-state data on coronary flow and myocardial metabolism at rest and with exercise. Data from dogs at rest and graded levels of exercise and with and without specific pharmacological blockades (15, 22–24) were analyzed to estimate parameters of a control system model based on oxygen mass balance and descriptions of open-loop (feed-forward) and feedback pathways. The main findings of this study are 1) model simulations of coronary blood flow that incorporate feedback control via adenine nucleotides and adrenergic open-loop control are consistent with canine rest and exercise data; 2) both open-loop and feedback control are important during exercise, but feedback control is essential; and 3) the model employing only feedback control gives reasonable predictions for coronary blood flow data with cardiac pacing and autoregulation without changes in the parameter values obtained from the exercise studies.
A somewhat unexpected finding is that α-adrenoceptor blockade with phentolamine reduced myocardial oxygen consumption as represented in block 5 of the model and illustrated in Fig. 4. This effect has been observed earlier under resting conditions when an α-adrenergic antagonist was infused into the coronary artery under resting conditions (20). This observation is also consistent with other studies that report a positive inotropic effect of α-adrenoceptor stimulation (7, 30). These data are consistent with the interpretation that, during exercise, inhibition of metabolic rate by α-adrenoceptor blockade is overridden by large increases in norepinephrine concentration. A similar effect was found with the open-loop gain in block 4 (Fig. 2). Even though open-loop gain (Kol) is slightly reduced by phentolamine, the open-loop conductance (gol) at a given oxygen metabolism (M) was actually increased by phentolamine due to the much higher norepinephrine concentrations. Thus, phentolamine did produce feedforward open-loop coronary vasodilation as one would expect, as shown in Fig. 11.
The model results are consistent with the interpretation that high levels of myocardial oxygen consumption during exercise are achieved via myocardial adrenergic β-receptor activation, and there is a concomitant feed-forward β-adrenoceptor-mediated coronary vasodilation. For patients receiving β-adrenoceptor blocking agents, the implication is that β1-selective blocking agents acting on the pacemaker and myocardium will be preferable to drugs that also have β2 blocking effects that act on the coronary blood vessels.
The feedback component of the model is built on the assumption that its signal increases in response to an increase in the level of deoxyhemoglobin in coronary venous blood. Specifically, the metabolic feedback contribution to the conductance is assumed to increase with ATP, which is released by red blood cells in response to increasing hemoglobin deoxygenation. The present simulations are consistent with the data and support the hypothesis that adenine nucleotides derived from red blood cells are the primary metabolic signal stimulating coronary vasodilation. (15, 22–24). The adenine nucleotide hypothesis states that red blood cells release ATP in response to lowered oxyhemoglobin saturation. However, much of the resulting vasodilation may be due to ADP and/or AMP derived from ATP, rather than to ATP itself (21). The coronary venous ATP measurements are an index of the total adenine nucleotides in coronary venous plasma.
A more sophisticated theoretical model of blood flow regulation in other tissues (32) that accounts for microvascular heterogeneity suggests the involvement of additional vessel wall-derived signals in metabolic regulation of blood flow. However, the present model does not rule out the possible involvement of other feedback pathways in influencing vascular conductance during exercise. More detailed models have been developed to represent flow control in various tissues (3, 6, 26) and investigate the influences of sympathetic, myogenic, metabolic and shear-dependent regulatory processes on blood flow control. For example, both shear-dependent and metabolic responses were shown to be necessary for explaining autoregulation in skeletal muscle blood flow (3). Similarly, interaction between shear stress and pressure have been illustrated by a few published models of coronary vascular tree (6, 26).
Previous models of coronary flow regulation characterize flow responses to changes in myocardial metabolism by considering myocardial oxygen tension as an error signal controlling myocardial flow through feedback pathways (8, 11, 14, 36). The synergistic effects of oxygen and carbon dioxide partial pressures have also been analyzed using models that combine feed-forward and feedback flow control in response to cardiac pacing and catecholamine infusion (28). These models represent the balance between myocardial metabolism and flow under dynamic and steady-state conditions. Some of these modeling studies (8, 9, 28, 38) have provided insight into the response times of flow changes under various perturbations (e.g., change in heart rate and pressure). For example, the quantitative studies of Dankelman et al. (8, 9) suggest that the response time of coronary circulation to an increase in pressure and flow is similar to that observed due to changes in heart rate, which is in the order of a few seconds. The current model uses a similar theoretical framework to quantitatively describe the physiological steady-state responses of sympathetic open-loop flow control and a postulated adenine nucleotide-mediated feedback flow control pathway, but does not treat physiological transients. Nor does it account for the pulsatile nature of coronary blood flow and myocardium-coronary mechanical interactions (10, 18, 35).
The model employed here represents a simplification of the processes that govern myocardial blood flow in vivo. Many parallel pathways, only some of which are explicitly represented by this model, are involved in coronary blood flow regulation (12, 19, 33, 34). In particular, the linear superposition of Eq. 10 can only crudely represent the numerous pathways that influence blood flow. The linear superposition ignores the possibility of saturation and cross-talk interactions between pathways that ultimately converge on the common endpoint of vascular smooth muscle tone. Moreover, the ability of the model to match data on coronary blood flow response to changes in myocardial oxygen demand does not imply that additional/alternative mechanisms not represented in the model cannot make significant contributions to vascular conductivity. For example, there is evidence that hydrogen peroxide generated in the myocardium acts as a feed-forward (open-loop) coronary vasodilator when myocardial oxygen metabolism is augmented (33, 34). Potential contributions of hydrogen peroxide to coronary flow control would be subsumed in the adrenergic open-loop arm of the present model. Furthermore, the present model may oversimply the feedback component of flow control by subsuming any additional or alternative feedback mechanisms in the postulated adenine nucleotide-mediated pathway.
In conclusion, a simple model, that combines adenine nucleotide (ATP, ADP, AMP)-mediated feedback control with adrenergic open-loop control, provides an understanding of how coronary flow matches myocardial oxygen metabolism. In capturing the observed relationship between oxygen extraction and blood flow in the myocardium, and the effects of pharmacological inhibition of adrenergic and purinergic pathways, the model provides a quantitative representation of the physiology of the coronary circulation during exercise. While both open-loop and feedback mechanisms contribute to the physiological control of coronary flow, the system is more sensitive to a disruption of the feedback pathway than an equivalent disruption of the open-loop pathway, illustrating the critical role of metabolic feedback control. In capturing the metabolic pathway as mediated by oxygenation-dependent ATP release from red blood cells, the model demonstrates the ability of the adenine nucleotide hypothesis to predict and explain the relevant data from cardiac pacing and autoregulation experiments.
GRANTS
This study was supported by National Institutes of Health Grant U01-HL-118738 (D. A. Beard).
DISCLOSURES
No conflicts of interest, financial or otherwise, are declared by the author(s).
AUTHOR CONTRIBUTIONS
R.K.P., E.O.F., G.L.B., and D.A.B. conception and design of research; R.K.P. and D.A.B. performed experiments; R.K.P., E.O.F., M.W.G., G.L.B., and D.A.B. analyzed data; R.K.P., E.O.F., G.L.B., and D.A.B. interpreted results of experiments; R.K.P. prepared figures; R.K.P., E.O.F., M.W.G., and D.A.B. drafted manuscript; R.K.P., E.O.F., G.L.B., and D.A.B. edited and revised manuscript; R.K.P., E.O.F., M.W.G., G.L.B., and D.A.B. approved final version of manuscript.
Glossary Model Variables and Fixed Parameters
- N
Interstitial fluid norepinephrine (NE) concentration, nM
- SA
Arterial oxyhemoglobin saturation, unitless
- SV
Coronary venous oxyhemoglobin saturation, unitless
- F
Coronary flow, ml·min−1·g−1
- gol
Conductance of open-loop flow control pathway, ml·min−1·g−1·mmHg−1
- gfb
Conductance of feedback flow control pathway, ml·min−1·g−1·mmHg−1
- gp
Conductance of myogenic flow control pathway, ml·min−1·g−1·mmHg−1
- G
Total conductance, ml·min−1·g−1·mmHg−1
- M
Myocardial oxygen consumption rate, μl O2·min−1·g−1
- P
Mean arterial pressure, mmHg
- Co
Oxygen content of blood when oxyhemoglobin is fully saturated and hematocrit is 100 %, neglecting dissolved oxygen, μl O2/ml
- H
Hematocrit, %
- Vc
Capillary volume density, ml/g
- TV
Concentration of coronary venous plasma ATP, nM
Adjustable Model Parameters
- KM
A constant relating myocardial oxygen metabolism to interstitial norepinephrine concentration, μl O2·min−1·g−1·nM−1
- M0
Myocardial oxygen consumption rate (when ISF[NE] = 0), μl O2·min−1·g−1
- J0
ATP release rate in coronary vascular bed, μM/min
- S0
ATP release parameter of the model, unitless
- TA
Concentration of arterial plasma ATP, nM
- Kol
Gain of α- and β-adrenergic open-loop pathway, ml·min−1·g−1·mmHg−1·nM−1
- Kfb
Gain of ATP-mediated feedback pathway, ml·min−1·g−1·mmHg−1·nM−1
- Kmyo
Gain of myogenic control pathway, ml·min−1·g−1·mmHg−1
- g0
Basal conductance of coronary vasculature (at M = 0), ml·min−1·g−1·mmHg−1
REFERENCES
- 1.Broten TP, Feigl EO. Role of myocardial oxygen and carbon dioxide in coronary autoregulation. Am J Physiol Heart Circ Physiol 262: H1231–H1237, 1992. [DOI] [PubMed] [Google Scholar]
- 2.Broten TP, Romson JL, Fullerton DA, Van Winkle DM, Feigl EO. Synergistic action of myocardial oxygen and carbon dioxide in controlling coronary blood flow. Circ Res 68: 531–542, 1991. [DOI] [PubMed] [Google Scholar]
- 3.Carlson BE, Arciero JC, Secomb TW. Theoretical model of blood flow autoregulation: roles of myogenic, shear-dependent, and metabolic responses. Am J Physiol Heart Circ Physiol 295: H1572–H1579, 2008. [DOI] [PMC free article] [PubMed] [Google Scholar]
- 4.Chilian WM. Adrenergic vasomotion in the coronary microcirculation. Basic Res Cardiol 85, Suppl 1: 111–120, 1990. [DOI] [PubMed] [Google Scholar]
- 5.Chilian WM, Layne SM, Eastham CL, Marcus ML. Heterogeneous microvascular coronary alpha-adrenergic vasoconstriction. Circ Res 64: 376–388, 1989. [DOI] [PubMed] [Google Scholar]
- 6.Cornelissen AJ, Dankelman J, VanBavel E, Spaan JA. Balance between myogenic, flow-dependent, and metabolic flow control in coronary arterial tree: a model study. Am J Physiol Heart Circ Physiol 282: H2224–H2237, 2002. [DOI] [PubMed] [Google Scholar]
- 7.Cowley PM, Wang G, Chang AN, Makwana O, Swigart PM, Lovett DH, Stull JT, Simpson PC, Baker AJ. The alpha1A-adrenergic receptor subtype mediates increased contraction of failing right ventricular myocardium. Am J Physiol Heart Circ Physiol 309: H888–H896, 2015. [DOI] [PMC free article] [PubMed] [Google Scholar]
- 8.Dankelman J, Spaan JA, Stassen HG, Vergroesen I. Dynamics of coronary adjustment to a change in heart rate in the anaesthetized goat. J Physiol 408: 295–312, 1989. [DOI] [PMC free article] [PubMed] [Google Scholar]
- 9.Dankelman J, Spaan JA, Van der Ploeg CP, Vergroesen I. Dynamic response of the coronary circulation to a rapid change in its perfusion in the anaesthetized goat. J Physiol 419: 703–715, 1989. [DOI] [PMC free article] [PubMed] [Google Scholar]
- 10.Downey JM, Kirk ES. Inhibition of coronary blood flow by a vascular waterfall mechanism. Circ Res 36: 753–760, 1975. [DOI] [PubMed] [Google Scholar]
- 11.Drake-Holland AJ, Laird JD, Noble MI, Spaan JA, Vergroesen I. Oxygen and coronary vascular resistance during autoregulation and metabolic vasodilation in the dog. J Physiol 348: 285–299, 1984. [DOI] [PMC free article] [PubMed] [Google Scholar]
- 12.Duncker DJ, Bache RJ. Regulation of coronary blood flow during exercise. Physiol Rev 88: 1009–1086, 2008. [DOI] [PubMed] [Google Scholar]
- 13.Duncker DJ, Stubenitsky R, Verdouw PD. Autonomic control of vasomotion in the porcine coronary circulation during treadmill exercise: evidence for feed-forward beta-adrenergic control. Circ Res 82: 1312–1322, 1998. [DOI] [PubMed] [Google Scholar]
- 14.Duvelleroy MA, Mehmel H, Laver MB. Hemoglobin-oxygen equilibrium and coronary blood flow: an analog model. J Appl Physiol 35: 480–484, 1973. [DOI] [PubMed] [Google Scholar]
- 15.Farias M 3rd, Gorman MW, Savage MV, Feigl EO. Plasma ATP during exercise: possible role in regulation of coronary blood flow. Am J Physiol Heart Circ Physiol 288: H1586–H1590, 2005. [DOI] [PubMed] [Google Scholar]
- 16.Feigl EO. Coronary autoregulation. J Hypertens Suppl 7: S55–S58; discussion S59, 1989. [PubMed] [Google Scholar]
- 17.Feigl EO. Coronary physiology. Physiol Rev 63: 1–205, 1983. [DOI] [PubMed] [Google Scholar]
- 18.Fokkema DS, VanTeeffelen JW, Dekker S, Vergroesen I, Reitsma JB, Spaan JA. Diastolic time fraction as a determinant of subendocardial perfusion. Am J Physiol Heart Circ Physiol 288: H2450–H2456, 2005. [DOI] [PubMed] [Google Scholar]
- 19.Gorman MW, Feigl EO. Control of coronary blood flow during exercise. Exerc Sport Sci Rev 40: 37–42, 2012. [DOI] [PubMed] [Google Scholar]
- 20.Gorman MW, He MX, Sparks HV. Adenosine formation during hypoxia in isolated hearts: effect of adrenergic blockade. J Mol Cell Cardiol 26: 1613–1623, 1994. [DOI] [PubMed] [Google Scholar]
- 21.Gorman MW, Ogimoto K, Savage MV, Jacobson KA, Feigl EO. Nucleotide coronary vasodilation in guinea pig hearts. Am J Physiol Heart Circ Physiol 285: H1040–H1047, 2003. [DOI] [PMC free article] [PubMed] [Google Scholar]
- 22.Gorman MW, Rooke GA, Savage MV, Jayasekara MP, Jacobson KA, Feigl EO. Adenine nucleotide control of coronary blood flow during exercise. Am J Physiol Heart Circ Physiol 299: H1981–H1989, 2010. [DOI] [PMC free article] [PubMed] [Google Scholar]
- 23.Gorman MW, Tune JD, Richmond KN, Feigl EO. Feedforward sympathetic coronary vasodilation in exercising dogs. J Appl Physiol 89: 1892–1902, 2000. [DOI] [PubMed] [Google Scholar]
- 24.Gorman MW, Tune JD, Richmond KN, Feigl EO. Quantitative analysis of feedforward sympathetic coronary vasodilation in exercising dogs. J Appl Physiol 89: 1903–1911, 2000. [DOI] [PubMed] [Google Scholar]
- 25.Kuo L, Arko F, Chilian WM, Davis MJ. Coronary venular responses to flow and pressure. Circ Res 72: 607–615, 1993. [DOI] [PubMed] [Google Scholar]
- 26.Liao JC, Kuo L. Interaction between adenosine and flow-induced dilation in coronary microvascular network. Am J Physiol Heart Circ Physiol 272: H1571–H1581, 1997. [DOI] [PubMed] [Google Scholar]
- 27.Miyashiro JK, Feigl EO. Feedforward control of coronary blood flow via coronary beta-receptor stimulation. Circ Res 73: 252–263, 1993. [DOI] [PubMed] [Google Scholar]
- 28.Miyashiro JK, Feigl EO. A model of combined feedforward and feedback control of coronary blood flow. Am J Physiol Heart Circ Physiol 268: H895–H908, 1995. [DOI] [PubMed] [Google Scholar]
- 29.Mosher P, Ross J Jr, McFate PA, Shaw RF. Control of coronary blood flow by an autoregulatory mechanism. Circ Res 14: 250–259, 1964. [DOI] [PubMed] [Google Scholar]
- 30.Otani H, Otani H, Das DK. Alpha 1-adrenoceptor-mediated phosphoinositide breakdown and inotropic response in rat left ventricular papillary muscles. Circ Res 62: 8–17, 1988. [DOI] [PubMed] [Google Scholar]
- 31.Reeves RB, Park JS, Lapennas GN, Olszowka AJ. Oxygen affinity and Bohr coefficients of dog blood. J Appl Physiol 53: 87–95, 1982. [DOI] [PubMed] [Google Scholar]
- 32.Roy TK, Pries AR, Secomb TW. Theoretical comparison of wall-derived and erythrocyte-derived mechanisms for metabolic flow regulation in heterogeneous microvascular networks. Am J Physiol Heart Circ Physiol 302: H1945–H1952, 2012. [DOI] [PMC free article] [PubMed] [Google Scholar]
- 33.Saitoh S, Kiyooka T, Rocic P, Rogers PA, Zhang C, Swafford A, Dick GM, Viswanathan C, Park Y, Chilian WM. Redox-dependent coronary metabolic dilation. Am J Physiol Heart Circ Physiol 293: H3720–H3725, 2007. [DOI] [PubMed] [Google Scholar]
- 34.Saitoh S, Zhang C, Tune JD, Potter B, Kiyooka T, Rogers PA, Knudson JD, Dick GM, Swafford A, Chilian WM. Hydrogen peroxide: a feed-forward dilator that couples myocardial metabolism to coronary blood flow. Arterioscler Thromb Vasc Biol 26: 2614–2621, 2006. [DOI] [PubMed] [Google Scholar]
- 35.Spaan JA. Mechanical determinants of myocardial perfusion. Basic Res Cardiol 90: 89–102, 1995. [DOI] [PubMed] [Google Scholar]
- 36.Spaan JA, Dankelman J. Theoretical analysis of coronary blood flow and tissue oxygen pressure-control. Adv Exp Med Biol 346: 189–195, 1993. [DOI] [PubMed] [Google Scholar]
- 37.Vergroesen I, Merkus D, van Teeffelen JW, Dankelman J, Spaan JA, van Wezel HB, Noble MI, Drake-Holland AJ. Chronic cardiac denervation affects the speed of coronary vascular regulation. Cardiovasc Res 44: 615–622, 1999. [DOI] [PubMed] [Google Scholar]
- 38.Vergroesen I, Noble MI, Wieringa PA, Spaan JA. Quantification of O2 consumption and arterial pressure as independent determinants of coronary flow. Am J Physiol Heart Circ Physiol 252: H545–H553, 1987. [DOI] [PubMed] [Google Scholar]
- 39.Yada T, Richmond KN, Van Bibber R, Kroll K, Feigl EO. Role of adenosine in local metabolic coronary vasodilation. Am J Physiol Heart Circ Physiol 276: H1425–H1433, 1999. [DOI] [PubMed] [Google Scholar]


