

Abstract
We introduce a novel manifold and companion software for dipstick urinalysis that eliminate many of the aspects that are traditionally plagued by user error: precise sample delivery, accurate readout timing, and controlled lighting conditions. The proposed all-acrylic slipping manifold is reusable, reliable, and low in cost. A simple timing mechanism ensures results are read out at the appropriate time. Results are obtained by capturing videos using a mobile phone and by analyzing them using custom-designed software. We show that the results obtained with the proposed device are as accurate and consistent as a properly executed dip-and-wipe method, the industry gold-standard, suggesting the potential for this strategy to enable confident urinalysis testing in home environments.
A reusable manifold and companion software for dipstick urinalysis that eliminate many aspects that are plagued by user error.
Graphical abstract

1 Introduction
Dipsticks for urinalysis are a convenient diagnostic tool: they are non-invasive, extremely portable, and very cheap to manufacture. Unfortunately, the accuracy of the results is highly dependent on 1) proper sample preparation, 2) correct interpretation of a gradient color scale, and 3) precise readout timing. Proper sample preparation includes carefully wiping the edge of the dipstick immediately after immersing it in urine to ensure application of the correct volume on each pad (Fig. 1a) and to prevent the cross-contamination between adjacent pads (Fig. 1b) that is common in the standard dip-and-wipe method1,2. Interpretation of a gradient color scale often requires the user to differentiate between various shades of the same color, a difficult task for many people that can be exacerbated in certain lighting conditions (Fig. 1c). Additionally, the tests are inherently unreadable to users who are color-blind. Lastly, each pad of the dipstick must be read at a specific time to ensure accuracy, as the results vary over time (Fig. 1d). Several of the pads have the same readout time, requiring the user to interpret several color results simultaneously. Furthermore, many of the other readout times are close together (within 10–30 s), so the user must be able to quickly determine the results to maintain precise readout times.
Fig. 1.

Aspects of dipstick urinalysis that are prone to user error. a) Dipsticks with various volumes deposited onto each pad; using the incorrect volume to wet the dipstick pads can lead to erroneous results. b) A properly and improperly wiped dipstick. The improperly wiped dipstick shows signs of cross contamination as evidenced by the non-uniform coloring of the boxed pads compared to the properly wiped dipstick. c) Dipsticks imaged under various lighting conditions. d) A single dipstick pad tracked over time and the corresponding row from the reference chart.
The stringent requirements of dipstick urinalysis thus makes the accuracy of at-home tests suspect. The problem, however, is not the test itself: dipstick urinalysis is a procedure commonly used in primary care settings that can simply and effectively screen for various diseases and conditions. Unfortunately, due to high user error, many clinicians will only utilize quantitative dipstick results obtained by a trained technician, which typically requires sending the urine samples to a large, off-site testing facility. Such lab results may require a one- to three-day wait-time, even though the tests themselves can be run in a matter of minutes. A device that could be used at home and be trusted to produce accurate results would greatly reduce the burden on both the clinics and the general population: clinics would be able to dedicate their time and resources to higher risk patients (the frequency of negative test results is a significant burden on the healthcare system3), and patients would be able to perform the tests in the comfort of their own homes, thus eliminating travel time and the need to schedule multiple appointments. Furthermore, tests could be run more often and results could be more easily tracked over time. Enabling high-fidelity, at-home urinalysis would be particularly useful because the first urinary discharge of the day is the ideal sample for certain tests (e.g., pH and nitrite testing for urinary tract infections)4–6. Moreover, robust and portable urinalysis tests would be extremely useful in low-resource settings that lack access to large testing facilities.
The use of mobile computing devices (e.g., cellular phones) has recently emerged as a novel strategy to overcome many of the hurdles that plague both existing dipstick tests (e.g., Piddle7, Uchek8, and Colorimetrix9) and other strip-based tests10,11. The accompanying software applications aim to standardize the color interpretation and timing of the dipstick results by guiding the user through the correct process and then capturing an image or video of the dipstick to perform automated color readings. Unfortunately, this strategy is still highly prone to user error, as the apps can only suggest the proper procedure but not actually control it. Scanadu Urine12, like many microfluidic-based urinalysis tests13,14, takes an altogether different approach and fabricates a proprietary platform to replace currently available dipsticks. However, broad and rapid adoption of these approaches may be hindered by the novelty of the testing platform and chemistry. Additionally, the Scanadu platform is still susceptible to cross-contamination and timing errors.
In this paper, we present a device and strategy for urinalysis that enables control over all aspects of the dipstick testing procedure. Importantly, unlike other microfluidic-based urinalysis systems, the newly developed device integrates with commercial, off-the-shelf dipsticks; the use of a well established chemistry platform makes it immediately suitable for at-home and low-resource settings. To facilitate proper sample preparation, we developed a microfluidic manifold capable of accurately depositing microliter volumes to each individual pad on the urinalysis dipstick. The isolation of the delivery mechanism prevents cross-contamination between adjacent pads. During operation, the manifold, including the dipstick, is housed in an opaque box to eliminate effects from changing lighting conditions. Finally, we developed offline software that utilizes a video captured by a mobile computing device to interpret the resulting colors of the dipstick pads and ensure accurate timing of the readout.
2 Experimental design
2.1 Choice of materials
For all urinalysis testing, we used Mission Urinalysis Reagent Strips (Acon) with pads for 10 analytes. Standard urine samples (Bio-Rad) were used for all testing; the urine samples are provided in two levels (level 1 and level 2), with information provided by the manufacturer regarding the ranges of analytes present in each sample. We chose to use these samples because they are readily available and are routinely used for calibrating automated dipstick readers used in clinics. In general, the analyte levels are lower in the level 1 sample compared to level 2. It should be noted that the ranges reported by the manufacturer encompass several possible candidate solutions; that is, the exact amount of analyte is not specified by the manufacturer, but rather a range of possible analyte concentrations is given that could be mapped to one of several possible pads (i.e., candidate solutions). We utilized a mobile phone (iPhone 4S) to capture all videos to mimic conditions likely available to many at-home users. Videos were analyzed with Matlab software v R2013a (Mathworks), but could be integrated into a phone app in the future. We lasercut acrylic (Universal Laser System VLS 4.60 laser cutter) for all components of the device to reduce the cost of manufacturing.
2.2 Choice of deposit volume
To determine the optimal volume for accurate measurements, we deposited various volumes − 5, 10, 15, and 20 μL – onto each dipstick pad using a micropipette, and the results were compared to the standard dip-and-wipe method. We used level 2 standard urine for all tests and analyzed all dipsticks using a color-matching technique described in Section 2.4. We validated the results by ensuring they were within the ranges provided by the manufacturer and by performing independent analyses by eye.
Median values and standard deviations over seven trials for each analyte and tested volume are given in Table 1. Median values that differ from the medians obtained by the standard dip-and-wipe method are denoted by ‡, and the number of test pads whose median value differs from the standard is given in the rightmost column. The data indicate that the volume sampled can impact the dipstick results; in particular, for the brand of dipstick tested, 15 and 20 μL result in only a single analyte pad whose value differs from the standard dip-and-wipe method. We chose 15 μL as the optimal volume, as overflow of the pads was often seen with 20 μL, leaving the dipstick susceptible to cross-contamination. It should be noted that while 15 μL is the optimal volume based on the closest match with the dip-and-wipe method for the brand of dipstick tested, different brands may have different optimal volumes based on the size of their test pads.
Table 2.
Results of urinalysis performed with the complete device and analyzed with the developed software. Results are presented for two standard levels of urine (L1: level 1, L2: level 2). The median values and standard deviations over 15 trials are reported.
| Analyte | differences from dip-and-wipe | |||||||||
|---|---|---|---|---|---|---|---|---|---|---|
| LEU | NIT | URO | PRO | pH | BLO | SG | KET | GLU | ||
|
|
||||||||||
| dip-and-wipe: L1 | 2 ± 0.46 | 1 ± 0 | 1 ± 0 | 1 ± 0 | 2 ± 0.49 | 1 ± 0.35 | 5 ± 0.41 | 1 ± 0 | 1 ± 0 | – |
| full device: L1 | 2 ± 0.35 | 1 ± 0 | 1 ± 0 | 1 ± 0.41 | 2 ± 0 | 1 ± 0.5 | 6‡ ± 0.59 | 1 ± 0 | 1 ± 0 | 1 |
| dip-and-wipe: L2 | 4 ± 0 | 2 ± 0 | 3 ± 0 | 3 ± 0 | 5 ± 0.49 | 5 ± 0.46 | 3 ± 0 | 5 ± 0.64 | 3 ± 0 | – |
| full device: L2 | 4 ± 0.49 | 2 ± 0 | 3 ± 0 | 3 ± 0.52 | 5 ± 0.49 | 5 ± 0.49 | 3 ± 0.56 | 5 ± 0.65 | 3 ± 0.56 | 0 |
A indicates values that differ from the dip-and-wipe method. The total number of analyte results that differ from the dip-and-wipe method are reported in the far right column.
LEU: leukocytes, NIT: nitrite, URO: urobilinogen, PRO: protein, BLO: blood, SG: specific gravity, KET: ketones, GLU: glucose.
When analyzing the Mission Urinalysis strips, the bilirubin (BIL) pad provided consistently erroneous results. We noted by eye that the observed pad colors (for various levels of BIL) and the colors in the reference chart did not match well. This observation was confirmed when we analyzed various urine samples using the color-matching technique described in section 2.4. In fact, the BIL results always had significantly higher standard deviations than all the other pads, even when using the standard dip-and-wipe method (standard deviation = 1.07). Due to this inconsistency in results, we do not report the results of the BIL pads in Table 1 or in subsequent results. This observation did not impact our choice of volume.
Table 1.
Median values and standard deviations for all analytes using various deposited volumes.
| Analyte | differences from dip-and-wipe | |||||||||
|---|---|---|---|---|---|---|---|---|---|---|
| LEU | NIT | URO | PRO | pH | BLO | SG | KET | GLU | ||
|
|
||||||||||
| dip-and-wipe | 4 ± 0 | 2 ± 0 | 4 ± 0.53 | 2 ± 0.53 | 4 ± 0 | 5 ± 0 | 3 ± 0.53 | 4 ± 0.49 | 3 ± 0.58 | – |
| 5 μL | 3‡ ± 0 | 2 ± 0 | 3‡ ± 0 | 3‡ ± 0.49 | 3‡ ± 0 | 3‡ ± 0 | 2‡ ± 0.53 | 4 ± 0.38 | 1‡ ± 0 | 7 |
| 10 μL | 3‡ ± 0.38 | 2 ± 0 | 4 ± 0 | 2 ± 0 | 3‡ ± 0.38 | 4‡ ± 0 | 1‡ ± 0.49 | 4 ± 0.49 | 2‡ ± 0.58 | 5 |
| 15 μL | 4 ± 0 | 2 ± 0 | 4 ± 0.49 | 2 ± 0 | 4 ± 0.38 | 5 ± 0 | ‡2 ± 0.38 | 4 ± 0.49 | 3 ± 0.49 | 1 |
| 20 μL | 4 ± 0 | 2 ± 0 | 4 ± 0.82 | 2 ± 0.53 | 4 ± 0.53 | 5 ± 0 | ‡2 ± 0.49 | 4 ± 0.49 | 3 ± 0 | 1 |
A indicates median values that differ from the median obtained with the dip-and-wipe method, the industry standard. The total number of analyte pads whose medians differ from the dip-and-wipe method are reported in the far right column. Note results are cumulative for all dipsticks used.
LEU: leukocytes, NIT: nitrite, URO: urobilinogen, PRO: protein, BLO: blood, SG: specific gravity, KET: ketones, GLU: glucose.
2.3 Device design and working principle
We designed an all-inclusive urinalysis device consisting of the following components: 1) a manifold that is capable of delivering specific volumes of the sample to each individual pad of the dipstick; 2) an acrylic box to house the manifold and shield it from external lighting; 3) a timing mechanism that interfaces with the manifold to identify the exact time at which a urine sample is deposited onto the dipstick pads; 4) software to analyze videos of the urinalysis procedure (timing mechanism and color change of dipstick pads) captured by a mobile computing device. Each component is discussed in more detail in the following sections.
Dipstick manifold for volume control
The manifold was inspired by the SlipChip, a device designed to transfer nanoliter volumes across a surface to designated areas15. The original SlipChip is a two-layer device designed to perform multiplexed reactions without pumps or valves (e.g., recombinase polymerase amplification16, polymerase chain reaction17, and immunoassays18); fabrication is fairly involved and it uses glass plates. The proposed manifold has several differences from SlipChip: 1) we use a four-layer (vs. two-layer) design; 2) it is fabricated using an all-acrylic framework (vs. glass); 3) it is optimized to transfer microliter (vs. nanoliter) volumes; 4) it integrates with a commercial dipstick. While our manifold works similarly to the SlipChip in that it is capable of transferring precise volumes across a surface using a slipping process, the differences in its design give it several advantages for the proposed application. First, the four-layer design allows for easy integration with off-the-shelf dipsticks and simpler sample loading. Second, the choice of acrylic as a base material makes it more robust, cheaper, safer, and easier to produce. For instance, to create the layers (described in the next paragraph) out of acrylic cost approximately $0.85, whereas a similar design in glass would cost approximately $15. Note that these costs can be reduced if the devices are produced in bulk, and costs for our device of ~$0.5 are conceivable. The high cost of a glass implementation is due to the inability to use standard glass slides, which are too small to hold the dipsticks. Additionally, acrylic can be fabricated using a laser cutter rather than a more costly lithography process. In contrast with photolithography suites, laser cutters are becoming ubiquitous due to their relatively low cost, speed, and ease of use. The lower cost and simpler fabrication make the proposed manifold more appropriate for primary care applications. Moreover, laser cutting enabled us to fabricate wells of arbitrary shape and provides versatility for use with multiple dipstick brands. Glass can also easily break if dropped on the ground and represents a potential safety hazard. Third, the capability to handle microliters is necessary to handle the volumes needed for dipstick analysis. Fourth, the integration with existing dipsticks allows it to take advantage of chemistries that have been well established and used for more than 50 years.
Fig. 2a shows a drafting schematic of the manifold. Its purpose is to accept a sample from a user and deliver precise volumes to each individual dipstick pad. Fig. 2b shows a drafting schematic of the chassis. Its purpose is to secure all the pieces of the manifold and provide alignment with the acrylic housing. Only layers 1 and 2 of the manifold were permanently bonded together, while all the layers in the chassis were permanently bonded together. Layers 1, 2, and 3 of the manifold and chassis were made of clear acrylic that was laser-cut to the desired shape, while layer 4 was fabricated out of black opaque acrylic. The choice of opaque acrylic for the bottom layer was intended to eliminate stray light coming from below the device. Note that layer 4 is common to both the manifold and chassis. During operation, the dipstick is placed beneath layer 4 and the pads are inserted into the cutout square holes, the size and number of which were chosen to match the analyte pads of the specific dipstick brand utilized.
Fig. 2.

Drafting schematics of a) manifold and b) chassis for volume-controlled sample delivery. The figure is not drawn to scale: the layers are drawn thicker for ease of viewing. Each layer was was 1.59-mm thick, and layer 4 was 160 mm × 50 mm.
A working schematic of the manifold is shown in Fig. 3. Fig. 3a provides a front view of the loading process, and Fig. 3b provides a right view of the slipping process. The overall process is as follows: i) the dipstick is placed beneath layer 4 and the pads are inserted into the cutout square holes; ii) the user loads the urine sample into the inlet hole of layer 1 using a plastic eye dropper (note that there is no need to measure the volume accurately, as distribution of the required volume is managed by the device); iii) the sample proceeds through the microfluidic channel in layer 2 while simultaneously filling the wells in layer 3 (excess urine exits through the outlet hole); iv) after all wells in layer 3 have been filled, layer 3 is slipped across layer 4; v) at the completion of the slipping process, the volumes held in layer 3 are transferred to the individual dipstick pads held in place by layer 4. The volume transferred by the device is dictated by the dimensions of the wells in layer 3. Therefore, should a different volume be required (e.g., for a different brand of dipstick), the volume transferred could be easily adjusted by altering the dimensions of the holes in layer 3. The use of square wells allowed the fluid to contact the entire pad and results in a more homogeneous color change.
Fig. 3.

Working schematic of the manifold. a) Front view of the loading process: user loads a urine sample, which then proceeds through the channel and fills wells in layer 3. b) Right view of the slipping process where the sample held in layer 3 is transferred to dipstick pads held in layer 4. The figure is not drawn to scale: the layers are drawn thicker for ease of viewing.
We bonded layers 1 and 2 using an acrylic sealer to ensure a water-tight seal. To minimize sample loss during the slipping process, we coated the bottom of layer 2 and the top of layer 4 with Neverwet (Rust-Oleum), a hydrophobic coating. The Neverwet ensures that the water tension is not broken while slipping layer 3 and that the full volume in the wells is transferred. Each acrylic layer was 1.59-mm thick, and layer 4 was 160 mm × 50 mm. To avoid imaging through potentially cloudy and/or scratched acrylic caused by repeated usage and to ensure complete release of the water tension, a rectangular viewing window was cut out of layer 2 above the dipstick holes (visible in the top view of Fig. 2a). To make the device reusable (i.e., capable of testing multiple dipsticks), after running a urinalysis test, the layers of the manifold/chassis were wiped with a 10% bleach solution and then de-ionized water. This process sanitized the slides and prevented sample contamination. The acrylic housing (discussed in the next section) never comes into contact with the urine sample and therefore does not need to be sanitized in between runs.
Acrylic housing for lighting control
We housed the portion of the manifold that holds the dipstick inside a black opaque box. The box eliminates variations in the lighting conditions, thus eliminating the need to capture a calibration chart with each image or use a complex algorithm that is robust to various lighting conditions9,19,20; only a single calibration event is needed for the entire lifetime of the device. The placement of the acrylic housing over the manifold is shown in Fig. 4a. Notably, the microfluidic channel extends beyond the box for easy sample loading. Each side of the box was individually laser-cut and then assembled via interlocking cutouts, as shown in Fig. 4b. Interlocking cutouts allow the box to be easily disassembled and reassembled; therefore, the box can be packaged in individual pieces, which allows for easier storage and/or shipping.
Fig. 4.

a) Positioning of the acrylic housing over the mainfold. Notably, the microfluidic channel used to receive the sample is placed outside the box for easier filling. The figure is not drawn to scale: the layers are drawn thicker for ease of viewing. b) Schematic of the box design showing the interlocking cutouts used to assemble the box (figure is to scale).
Geometric cut-outs for timing control
To enable precise timing of when the urine contacts the dipstick pads after slipping, we affixed portions of stickers of well-defined geometric shape to the tops of both layers 2 and 3 as shown in Fig. 5. Incomplete half-circle stickers were placed at the end of layer 2; their complements were placed at the end of layer 3. Completed half-circles are formed at the completion of the slipping process (i.e., when the sample volumes are deposited on the dipstick pads). The analysis software is programmed to identify images of complete half-circles (i.e., completed timing stickers), and uses this cue to start the timer for reading the results.
Fig. 5.
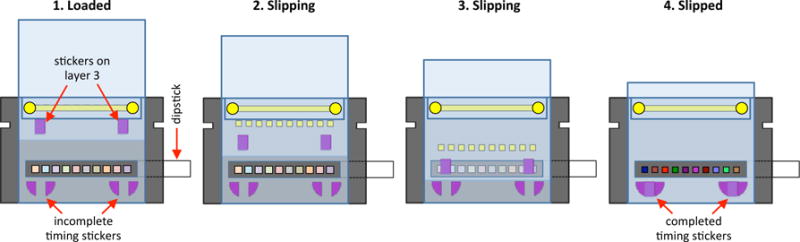
Progression of timing stickers affixed to manifold during the slipping process. Initially the timing stickers are separated, but upon completion of volume transfer the stickers form complete half-circles.
End user operation
When running a urinalysis dipstick test, the end user performs the following steps: 1) Place the dipstick underneath layer 4 and push the pads through the holes. 2) Place the acrylic housing over the manifold/chassis. 3) Place the mobile computing device over the hole on top of the box and turn on video recording. 4) Fill the microfluidic channel with the urine sample using an eye dropper. 5) Slide layer 3 (layer 3 will become flush with the acrylic box when sliding is complete so the user doesn’t have to gauge how far to slide). 6) After waiting two minutes (or more), transfer the resulting video to a personal computer. 7) Input the video into the software. While the end user is still responsible for a number of steps, they are all performed either prior to the urine being deposited onto the dipstick or after the test is complete, which eliminates the user error typically associated with dipstick results. Note that steps 6 and 7 would be eliminated if the software were integrated into a mobile application as opposed to an offline system. With a mobile application, the user would simply need to press a “start” button during step 3 and the software would automatically display the results on the screen at the conclusion of the test.
2.4 Software design
We developed software to analyze videos of urinalysis dipstick tests performed with the complete urinalysis device (manifold, chassis, and acrylic housing). The software accomplishes two main tasks: 1) it keeps track of the time when the sample is deposited on the dipstick and the appropriate readout times of all analytes; 2) it analyzes the colors of the dipstick pads and compares them to the reference chart provided by the manufacturer. Since these tasks are done automatically, the user error associated with color differentiation and accurate timing is eliminated.
The overall process of the software is as follows. First, the software determines the time at which the urine sample is deposited onto the dipstick pads (i.e., the starting time) by identifying the first frame where a completed timing sticker exists. Next, for each analyte, the software ascertains the frame corresponding to the readout time provided by the manufacturer. The software then locates the corresponding dipstick pad. For each dipstick pad, comparisons are made between the color of that pad and the color of each corresponding candidate solution on the reference chart. Each color is represented as a three-element vector in the RGB color space. We find these vectors by averaging several pixels of the pad or candidate solution. The angle between vectors is used as a metric of similarity; the smaller the angle, the more similar the colors21. This metric is robust to changes in the intensity of illumination, as it is independent of the vector magnitudes. We report the index of the candidate solution with the smallest angle (i.e., whose color is most similar to the candidate pad).
The algorithm implemented by the software is composed of two parts: initialization and analysis. The initialization is performed only once to characterize the device / dipstick pair; whereas, the analysis is performed for each dipstick assay. The initialization results are utilized by the analysis steps, which are performed on each dipstick assay. The analysis part of the algorithm is completely automated: it accepts a video clip as an input and reports the results by displaying the abbreviation for each dipstick pad (e.g., LEU, GLU) along with the index and actual value of the solution (e.g., 1 (100 mg/dL), 2 (250 mg/dL)) for the corresponding pad. The steps of the algorithm are summarized in Algorithm 1 and Fig. 6; a detailed description of each step follows.
Fig. 6.
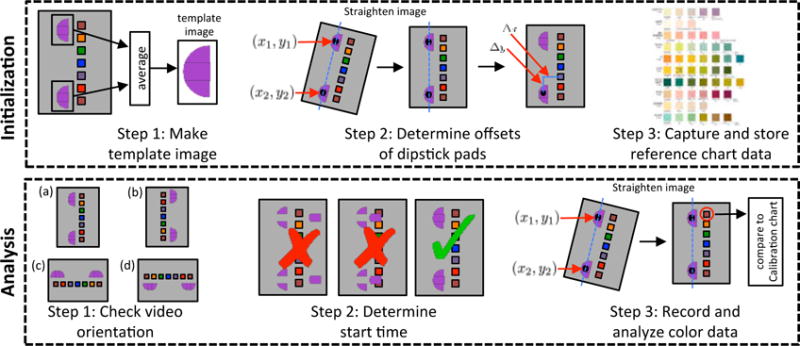
Steps of the algorithm that analyzes dipstick urinalysis videos. The initialization steps are performed only a single time while the analysis steps are performed for each video analyzed.
|
|
| Algorithm 1: Steps for analyzing urinalysis dipstick video |
|
|
| Initialization |
| Step 1: Create template image |
| Step 2: Measure relative offsets between dipstick pads and timing sticker |
| (a) straighten image |
| (b) determine offsets |
| Step 3: Capture and store reference chart data |
| Analysis |
| Step 1: Correct aspect ratio of video |
| if aspect ratio <= 1 |
| then rotate image by 90° |
| end |
| Step 2: Identify start time and correct video orientation |
| for each frame |
| Calculate normalized cross-correlation (NCC) |
| if maximum of NCC >= threshold (0.85) |
| start timer |
| correct orientation |
| continue |
| end |
| end |
| Step 3: Record and analyze the results |
| for each dipstick pad |
| (a) identify frame for readout time |
| (b) straighten image |
| (c) locate dipstick pad and record color |
| (d) compare measured color to reference chart end |
| end |
|
|
Initialization
Step 1: Create template image
To analyze whether a completed timing sticker is present in a given frame, we utilized the normalized cross-correlation function22. Normalized cross-correlation (NCC) is a standard approach to searching for a known signal in a set of data. It accepts as its input two images: a template image (the known signal) and a search image (the set of data). It returns an image of the same size as the search image where the value of each pixel quantifies how well the template image matched the local region in the search image. The output values range between 1 (a perfect match) and −1 (a perfect anti-match). For this application, the template image is an image of a completed timing sticker, and the search images are frames from the urinalysis video. We created the template image by cropping two completed timing stickers from an image of the manifold and averaging them. Notably, in an image with completed timing stickers, the location of the maximum of the NCC in the upper half of the image corresponds to the location of the top timing sticker. Similarly, the location of the maximum of the NCC in the lower half of the image corresponds to the location of the bottom timing sticker.
Step 2: Measure relative offsets between dipstick pads and timing sticker
We chose a frame with completed timing stickers to determine the position of the dipstick pads relative to the timing stickers. The image was initially straightened to correct for small rotations between the camera and the dipstick caused by inconsistencies in their alignment. To straighten the image, we found the locations of the maximum of the NCC in the upper and lower halves of the frame: points (x1,y1) and (x2,y2), respectively. That is, we located both timing stickers. The frame was then rotated about (x2,y2) so that (x1,y1) was positioned directly above (x2,y2).
The pixel offset between the timing sticker in the lower half of the image, located at (x2,y2), and the center of each dipstick pad was measured and recorded. A special case was made for the glucose (GLU) pad, whose hydrophobicity often leads to nonuniform wetting of the pad. This apparent hydrophobicity is evidenced by the urine consistently forming a bead on the pad (e.g., the far left pad in Fig. 1a). This phenomenon results in the sample remaining on the edge of the pad closest to the microfluidic channel when liquid is transferred to the GLU pad during sample delivery. To account for this abnormal distribution, the detection point for the GLU pad was moved closer to the edge of the pad and inward.
Step 3: Capture and store reference chart data
We captured an image of the manufacturer’s reference chart with the mobile computing device in bright, white-light conditions. From this image, we calculated and stored the RGB vectors for all candidates. The proper readout times, as listed on the reference chart, were manually recorded and stored.
Analysis
Step 1: Correct aspect ratio of the video
The mobile computing device can capture videos in four possible orientations (as shown in Fig. 6). For consistency within all algorithm steps, all images (i.e., frames from the video) were required to be of the same orientation. Therefore, if the aspect ratio of the images was less than one, all frames of the video were rotated by 90°. This step forces all the video frames into one of two orientations, denoted (a) or (b).
Step 2: Identify start time and correct video orientation
The start time (i.e., when the sample volumes are deposited onto the dipstick pads) was assumed to be the first frame that contained completed timing stickers. For each frame, we calculated the maximum of the NCC between the frame and the template image. Additionally, we calculated the maximum of the NCC between the frame and the template image after rotation by 180°. The times-tamp for the first frame where the maximum of the NCC exceeds a threshold of 0.85 was considered the starting time. The orientation was confirmed based on whether the maximum of the NCC that exceeded the threshold corresponded to that of the original template image (video orientation a), or its 180°-rotated counterpart (video orientation b).
Step 3: Record and analyze the results
For each dipstick pad (analyte):
Using the frame rate of the camera, the predetermined readout times, and the starting time determined in step 2, we identified the frame that corresponded to the correct readout time.
We straightened the image to correct for small rotations, as was done in initialization step 2.
Using the pixel offsets determined in initialization step 2, we identified the location of the dipstick pad. A 3×3 grid centered at this point was averaged to compute the RGB vector for this analyte.
We used the previously described color-matching technique to compare the analyte RGB vector to all candidate RGB vectors from the reference chart. The index of the best match was reported.
3 Results and discussion
3.1 Demonstration of volume control
To validate the consistency of the volume transferred by the manifold, we loaded a urine sample, slipped layer 3, and measured the volume transferred by each well using a calibrated pipette. The wells in layer 3 were laser-cut with dimensions of 3.07 mm × 3.07 mm × 1.59 mm to transfer the optimal volume of 15 μL. The mean volumes transferred by each well (over seven trials) are presented in Fig. 7: well 1 is closest to the inlet while well 10 is closest to the outlet. The mean volume transferred by each well was within 0.5 μL of the designed value of 15 μL, and all standard deviations were below 0.5 μL. Well 1 differs the most from the designed value; we believe this discrepancy could be caused by a slight retraction of the sample as the eyedropper is removed after loading.
Fig. 7.

Well number vs. average volume transferred. Well 1 is closest to the inlet while well 10 is closest to the outlet. The mean volume transferred by all wells is within 0.5 μL of the predicted volume of 15 μL. The errors bars represent ±standard deviation.
3.2 Demonstration of timing control
The readout timing for each dipstick pad was based on the manufacturer’s directions (i.e., the readout times provided by the manufacturer). We validated the operation of the proposed timing stickers in two ways. First, we confirmed visually that the maximum of the NCC (section 2.4) crosses a threshold of 0.85 at the same moment that the urine sample is deposited onto the dipstick pads; a representative progression of the maximum of the NCC over time is presented in Fig. 8a, where the red line indicates the threshold value. Secondly, we tracked the results of each dipstick pad, inside the full device, as a function of time using level 2 standard urine (Fig. 8b). Median results over 15 trials are shown. Time is represented as an offset from the readout time provided by the manufacturer and was measured using the timing mechanism and software. All results were compared to the standard dip-and-wipe results read at the recommended time, which are indicated by horizontal red lines for each analyte. Notably, all pads match the dip-and-wipe result at a time offset of zero (indicated by vertical dashed line), where they cross the red line. These results indicate that the timing stickers produce accurate readout times. These data also demonstrate the effects of incorrect timing for each analyte: that is, reading the results at the incorrect time often leads to erroneous results. Recall that the BIL pad does not well match the reference chart, resulting in consistently problematic results and, therefore, the results of the pad were excluded.
Fig. 8.

a) Maximum of NCC vs time. Maximum of the NCC crosses the threshold (red line) at the same moment that the urine is deposited onto the dipstick pads, as confirmed by eye. b) Offset from the dip-and-wipe value at the correct readout time vs. time for each analyte pad. Median values over 15 trials are reported. Correct readout times for each analyte are given in parentheses. Notably, all pads match the standard dip-and-wipe at the correct readout time (i.e., time 0), as evidenced by crossing the red lines.
3.3 Operation of completed prototype
An external view of the final fabricated prototype is shown in Fig. 9a. Fig. 9b shows frames captured by the mobile computing device during the urinalysis process. In the first frame, the urine sample is being loaded into the microfluidic channel, which is not visible in the video because it lies outside the box. In the second frame, the urine sample has been fully loaded and layer 3 is being slipped, as evidenced by the newly positioned timing stickers. In the third frame the wells are being slipped over the dipstick pads, and the urine sample is easily seen on the right side of the bottom pad, demonstrated in the zoomed-in inset. The fourth frame was taken after layer 3 had been completely slipped over the dipstick, and the sample has been deposited onto the pads. At this point, the timing stickers are aligned. The last frame was taken 90 seconds after the fourth frame, and color changes in the dipstick pads can be easily observed. Hence, the prototype functions as expected, delivering a specific volume of urine to each individual dipstick pad while simultaneously completing timing stickers. A full video of the urinalysis process is provided as Supplementary Material. It should be noted that the rightmost pad in the video is the glucose pad, which is hydrophobic. This hydrophobicity leads to nonuniform wetting of the pad, which is clearly visible in the video. Recall that this was accounted for by moving the detection point for the glucose pad closer to the edge (initialization step 2 in the algorithm).
Fig. 9.

a) External view of the final prototype. The microfluidic channel of the sample delivery mechanism extends beyond the acrylic box for easier filling. b) Various frames from the video of the urinalysis process. In the first frame the timing stickers are completely separated and the urine is being filled into the microfluidic channel. In the fourth frame the sample is deposited onto the dipstick pads and the timing stickers are completed. In the final frame the color change of the pads is evident.
3.4 Demonstration of full device
Finally, we tested the utility of the full urinalysis device (including the developed software) with both level 1 and level 2 standard urines; the results are presented in Table 2 (median values over 15 trials). Results of a dip-and-wipe test are reported for comparison. There is only a single error in the L1 results (for specific gravity) and no errors in the L2 results. We calculated p-values for each analyte using a two-sided Fisher’s exact test to evaluate the similarity between the dip-and-wipe results and the results obtained using our urinalysis device. The p-values for all analytes were above 0.7, which shows that there is not a statistically significant difference between the two sets of data. The error in the reported specific gravity for L1 most likely results from the similar coloring of candidate solutions 5, 6, and 7 in the reference chart associated with the amount of analyte added by the manufacturer (the exact amount was not specified). The angles between candidate solutions 5, 6, and 7 are 1.4° and 1.3°, respectively, which suggests that their separation in color space is too small to distinguish reliably. As a point of comparison, the angles between candidate solutions 1, 2, 3, 4, and 5 are 10.9°, 12.9°, 5.9°, and 4.9°, respectively. Overall, the manifold, coupled with the software, produces results that are accurate and consistent, similar to a properly performed dip-and-wipe method.
The results presented in Table 2 were all obtained using a single device (a single box and manifold/chassis). In between sample runs the slides were sanitized with a 10% bleach solution as described previously. While the manifold and chassis are reusable, their lifetime is limited by the hydrophobic coating: friction caused by slipping the layers eventually causes the coating to delaminate, which can be seen towards the end of the Supplementary video in the bottom left. We were able to run approximately 15 tests before noticeable delaminating occurred (typically at the edges of the manifold), and we were able to run approximately 30 tests before the delaminating led to leakage. It should be noted that when the coating delaminates, the slides are not damaged; the remaining coating can be removed and a new coating can be applied.
4 Conclusion
The all-acrylic, micro-volume urinalysis device introduced in this paper controls the many aspects of dipstick urinalysis that are prone to user error (volume control, timing control, lighting control, and color differentiation), thus making it suitable for a home environment or a low-resource area. With the user error removed, the results are more reliable and could potentially encourage the medical community to accept dipstick results reported by patients. Because the device is compatible with off-the-shelf dipsticks, it could be adopted by the medical community quickly. The device only requires a one-time calibration event, making the process even simpler for the patient. Currently the entire algorithm is performed on a personal computer and is therefore not yet fully amenable to low-resource settings. Future directions for the project include designing a cell phone application to interface with the device.
The current device has been optimized for a specific brand of dipstick, and the holder was made to fit a specific brand of mobile phone. Different dipsticks may have a different number of pads and may have different spacing between pads. Therefore, the number and spacing of holes in layer 4 would need to be slightly modified for each brand. Additionally, the pads of different dipstick brands can vary; hence, the optimal volume for accuracy may deviate from the proposed value here and would need to be experimentally determined. The dimensions of the holes in layer 3 would need to be altered to transfer this optimal volume. Altering the design of holes in layers 3 and 4 would be simple given the fast and low-cost nature of laser-cutting acrylic. Finally, the mobile phone holder can be easily adapted to fit a range of phone options. Given the simple interlocking form of the box, only the top would need to be redesigned as this part merely aligns the camera with the dipstick.
Supplementary Material
Acknowledgments
The authors would like to thank Kristen L. Lurie and Monica Bendernagel for their early efforts in the project, and we would like to thank Seth Mack-Smith for testing the system. GTS is supported by an NSFGRFP fellowship. ND is supported by the National Institute of Health’s Grant Number T32EB009653 “Predoctoral Training in Biomedical Imaging at Stanford University”, the National Institute of Health’s Grant Number NIH T32 HL007846, The Rose Hills Foundation Graduate Engineering Fellowship, the Electrical Engineering Department New Projects Graduate Fellowship, and The Oswald G. Villard Jr. Engineering Fellowship. SAK is supported by NSFGRFP and SGF fellowships.
Footnotes
Electronic Supplementary Information (ESI) available: [details of any supplementary information available should be included here]. See DOI: 10.1039/b000000x/
References
- 1.Lindh W, Pooler M, Tamparo C, Dahl B, Morris J. Delmar’s comprehensive medical assisting: administrative and clinical competencies, Cengage Learning. 2013 [Google Scholar]
- 2.http://www.rapidtest.com/pdf/URS%201-11(%2006-11-2013).pdf.
- 3.Patel H, Livsey S, Swann R, Bukhari S. Journal of clinical pathology. 2005;58:951–954. doi: 10.1136/jcp.2004.025429. [DOI] [PMC free article] [PubMed] [Google Scholar]
- 4.Devillé WL, Yzermans JC, Van Duijn NP, Bezemer PD, Van Der Windt DA, Bouter LM. BMC urology. 2004;4:4. doi: 10.1186/1471-2490-4-4. [DOI] [PMC free article] [PubMed] [Google Scholar]
- 5.Mahadevan SV, Garmel GM. An introduction to clinical emergency medicine. Cambridge university press; 2012. [Google Scholar]
- 6.Abirami K, Tiwari S. Indian Academy of Clinical Medicine. 2001;2:39–50. [Google Scholar]
- 7.http://www.linehq.com/showcase/piddle.
- 8.http://www.biosense.in/uchek.html.
- 9.Yetisen AK, Martinez-Hurtado J, Garcia-Melendrez A, da Cruz Vasconcellos F, Lowe CR. Sensors and Actuators B: Chemical. 2014;196:156–160. [Google Scholar]
- 10.Cooper DC, Callahan B, Callahan P, Burnett L. Nature Precedings. 2012 [Google Scholar]
- 11.Mudanyali O, Dimitrov S, Sikora U, Padmanabhan S, Navruz I, Ozcan A. Lab on a Chip. 2012;12:2678–2686. doi: 10.1039/c2lc40235a. [DOI] [PMC free article] [PubMed] [Google Scholar]
- 12.https://www.scanadu.com/products/urine.
- 13.Martinez AW, Phillips ST, Carrilho E, Thomas SW, III, Sindi H, Whitesides GM. Analytical chemistry. 2008;80:3699–3707. doi: 10.1021/ac800112r. [DOI] [PMC free article] [PubMed] [Google Scholar]
- 14.Martinez AW, Phillips ST, Whitesides GM. Proceedings of the National Academy of Sciences. 2008;105:19606–19611. doi: 10.1073/pnas.0810903105. [DOI] [PMC free article] [PubMed] [Google Scholar]
- 15.Du W, Li L, Nichols KP, Ismagilov RF. Lab on a Chip. 2009;9:2286–2292. doi: 10.1039/b908978k. [DOI] [PMC free article] [PubMed] [Google Scholar]
- 16.Shen F, Davydova EK, Du W, Kreutz JE, Piepenburg O, Ismagilov RF. Analytical chemistry. 2011;83:3533–3540. doi: 10.1021/ac200247e. [DOI] [PMC free article] [PubMed] [Google Scholar]
- 17.Shen F, Du W, Davydova EK, Karymov MA, Pandey J, Ismagilov RF. Analytical chemistry. 2010;82:4606–4612. doi: 10.1021/ac1007249. [DOI] [PMC free article] [PubMed] [Google Scholar]
- 18.Liu W, Chen D, Du W, Nichols KP, Ismagilov RF. Analytical chemistry. 2010;82:3276–3282. doi: 10.1021/ac100044c. [DOI] [PMC free article] [PubMed] [Google Scholar]
- 19.Hong JI, Chang BY. Lab on a Chip. 2014;14:1725–1732. doi: 10.1039/c3lc51451j. [DOI] [PubMed] [Google Scholar]
- 20.Shen L, Hagen JA, Papautsky I. Lab on a Chip. 2012;12:4240–4243. doi: 10.1039/c2lc40741h. [DOI] [PubMed] [Google Scholar]
- 21.Lukac R, Plataniotis KN. Color image processing: methods and applications. CRC press; 2006. p. 82. [Google Scholar]
- 22.Lewis J. Vision interface. 1995:120–123. [Google Scholar]
Associated Data
This section collects any data citations, data availability statements, or supplementary materials included in this article.