

Abstract
Background
GlycA is a novel serum marker of systemic inflammation. There is no information on GlycA in pediatric populations, how it differs by gender or its association with body mass index (BMI) or fitness. LP-IR is a serum measure of insulin resistance which is related to changes in BMI group in adolescents, but its relationship with fitness is unknown. The current study examined the independent associations between fitness and BMI with GlycA and LP-IR among US adolescents.
Methods
Participants were 1664 US adolescents from the HEALTHY study with complete 6th and 8th grade BMI, fitness and blood data. GlycA and LP-IR were measured by NMR spectroscopy. Three BMI groups and three fitness groups were created. Linear mixed models examined associations between GlycA, LP-IR, fitness and BMI.
Results
LP-IR decreased between 6th and 8th grade. GlycA increased among girls but decreased among boys. At 8th grade, median GlycA values were 27 (7.6%) μmol/L higher (381 versus 354) for girls than boys. Median GlycA 6th grade values were 9% higher in obese girls than healthy weight girls. Overall there was strong evidence (p<0.001) that GlycA was higher in higher BMI groups. Fitness was negatively associated with GlycA (r = −0.37 and −0.35) and LP-IR (r = −0.34 and − 0.18) at the 6th and 8th grade assessments. As BMI category increased and fitness category decreased, GlycA and LP-IR levels increased. Lowest GlycA was found in the low BMI/high fitness group.
Conclusions
GlycA was associated with BMI and fitness among in US adolescents. These findings suggest that there are independent effects for BMI and fitness group with both GlycA and LP-IR. Future studies should validate the role of GlycA and LP-IR to evaluate the effects of interventions to modify obesity and fitness in order to improve systemic inflammation and insulin resistance.
INTRODUCTION
Obesity and low levels of cardio-respiratory fitness (fitness) are associated with the development of cardiovascular disease (CVD) and type 2 diabetes mellitus (T2DM)1–3. The physiological mechanisms that contribute to these well established associations are dyslipidemia, insulin resistance and inflammation all of which are associated with obesity and low fitness4–7. A number of studies have demonstrated the adverse effects of increased body fat and low fitness in childhood on future health, with childhood obesity being strongly associated with its persistence into adulthood and fitness tracking through childhood into the adulthood8–10. A number of adult studies have suggested that there are independent associations between fitness and body mass index in relation to the risk of cardiovascular disease, type 2 diabetes and all-cause mortality1, 2. C-reactive protein (CRP), a marker of systemic inflammation and predictor of cardiovascular risk, has been shown to be closely associated with obesity among children and adults11. Thus, there is a need to examine how various relevant metabolic markers, such as dyslipidemia, insulin resistance and inflammation are associated with body mass and fitness among children. A key issue is whether there are associations between markers of dyslipidemia, insulin resistance and inflammation with body mass and fitness in pediatric populations. If associations exists these markers could be considered potential targets for the reduction of future cardiovascular disease risk.
GlycA, a novel composite measure of systemic inflammation, and the lipoprotein insulin resistance index (LP-IR) are promising new clinical biomarkers measured by nuclear magnetic resonance (NMR) spectroscopy12, 13. Both are obtained efficiently and inexpensively from the same NMR LipoProfile test spectra acquired on automated clinical NMR analyzers to quantify lipoprotein particles for use in CVD risk management14. Several recent reports have appeared relating these new markers to CVD and T2DM risk in adults15, 16, but no comparable data are available in children and adolescents.
Clinical interest in GlycA stems partly from its composite nature, reflecting the integrated concentrations and glycosylation states of several of the most abundant acute-phase proteins in serum, and its much lower intra-individual biological variability compared to CRP and other markers of inflammation12. As a result, GlycA may provide a more stable measure of low-grade systemic inflammation that responds more consistently to diverse inflammatory stimuli than individual acute-phase reactants such as CRP. In several adult studies, GlycA and CRP were found to have independent associations with incident CVD of comparable strength, with some evidence of complementarity suggesting a possible adjunctive clinical use17–20. Similar observations were made relating GlycA to prediction of future T2DM in the Women’s Health Study and Dutch PREVEND study15, 16.
The insulin resistance biomarker, LP-IR, reflects the lipoprotein derangements of insulin resistance and is derived by combining 6 NMR measures of very-low-density lipoprotein (VLDL), low-density lipoprotein (LDL) and high-density lipoprotein (HDL) particle size and subclass concentration13. Each of these subclass and size parameters has been shown individually to be associated with incident T2DM in the Women’s Health Study21, and the composite LP-IR score exhibited robust diabetes prediction in a large multi-ethnic cohort of men and women22.
We previously obtained NMR LipoProfile spectra from a substantial subset of 6th and 8th grade participants in the ethnically diverse HEALTHY trial, initially to characterize the differences between NMR-measured lipoprotein particle numbers and traditional lipid measures in a large pediatric population23. In a subsequent report, changes in relative weight group from 6th to 8th grade were related to lipoprotein particle changes associated with risk of CVD and T2DM, as well as alterations in insulin resistance assessed by LP-IR and insulin and glucose measurements24. In this paper, we take advantage of the ability, with newly available software, to extract GlycA values from the same NMR LipoProfile dataset to address the absence of information in youth regarding relations of body weight and fitness with GlycA and LP-IR. The aims of this study in an ethnically diverse sample of children were to: a) report on levels of GlycA and the change in GlycA as children move from 6th to 8th grade; b) examine whether BMI group is associated with GlycA in these children; c) determine if fitness was associated with GlycA, LP-IR and traditional lipid panel variables; and d) examine whether fitness and BMI are independently related to GlycA and/or LP-IR.
METHODS
The analyses reported in this paper used information from stored blood from the HEALTHY Study, a National Institute of Diabetes and Digestive and Kidney Diseases (NIDDK) cluster randomized controlled trial that aimed to reduce the prevalence of risk factors for type 2 diabetes mellitus among middle school children (6th – 8th grade)25, 26. Details of the study design and results have been reported in a number of publications25, 26. Briefly, the study was conducted in 42 middle schools across the US. In order to participate in the study, schools had to have at least 50% of students eligible for free or reduced-price lunch or belonging to an ethnic minority group at increased risk of type 2 diabetes. The intervention had several components including changes to the physical education and cafeteria programs as well as health education and a school wide social marketing campaign25, 27–32. The study was approved by the Institutional Review Boards at each field center and written parental consent and childhood assent was obtained from all participants33. The sample for this study is limited to the 1664 participants who provided parental consent/child assent for ancillary analyses of stored blood, and for whom complete data were available.
Procedures
All measures were assessed at baseline (beginning of 6th grade) and follow-up (end of 8th grade). Pubertal status was self-reported using the Pubertal Development Scale34 and converted to pubertal stage groups consistent with the five pubertal stages outlined by Tanner35. Household education were determined from parental report and gender and race/ethnicity was self-reported. Height and body mass were measured without shoes using the Prospective Enterprises PE-AIM-101 stadiometer and the SECA Corporation Alpha 882 electronic scale. Body Mass Index (kg/m2) was calculated and converted to an age and gender specific BMI percentile using CDC 2000 criteria36. For descriptive purposes participants with a BMI <85th percentile were classified as healthy weight; while BMI ≥85th percentile but <95th percentile were classified as overweight and those with BMI ≥95th percentile were classified as obese.
Cardiorespiratory fitness was assessed using the 20-meter shuttle test (20-MST)37, 38 during a Physical Education class. The test required students to run back and forth between two lines set 20 meters apart. The running pace was determined by audio signals emitted from a pre-recorded CD. The test started at 8.5 km/hr and increased by 0.5 km/hr with each subsequent level. The test was completed when the participant was not able to complete the distance at the stipulated pace on two laps.
Fasting blood samples were collected from all participants. Standard lipid profiles including HDL-C were measured by CDC-standardized direct assay at the University of Washington39. LDL-C was calculated using the Friedewald equation40. Insulin was measured by a two-site immuno-enzymometric assay41. Fasting insulin (performed using a Tosoh 1800 auto-analyzer) and glucose (performed on a Roche P module auto-analyzer by the hexokinase method) were used to calculate the homeostatic model assessment of insulin resistance (HOMA-IR) according to the formula: Glucose*Insulin/[μU/L] 22.542. Lipoprotein particle profiles were measured by NMR spectroscopy with the LipoProfile-3 algorithm at LipoScience, Inc (Raleigh, NC) on frozen EDTA plasma specimens and LP-IR and GlycA were derived using previously published procedures12, 13
Statistical analysis
Overall, 2367 participants in HEALTHY had samples analyzed by LipoScience. Of these, 703 were excluded from the present analysis, most due to imprecise classification of their race or the lack of either a 6th or 8th grade fitness test. Descriptive statistics, including means, standard deviations, and percentages were calculated for those included and excluded from the analysis. Differences between those included and excluded were tested using a generalized linear mixed model which took into account the sources of variability within and between schools. A similar approach was undertaken for baseline characteristics of the analysis sample to examine gender differences.
Measures in 6th grade, 8th grade and change between 6th and 8th grade are summarized using mean and 95% confidence interval for normally distributed measures (number of laps) and medians and interquartile range (IQR) for parameters not fitting a normal distribution (lipid measures, insulin resistance measures and GlycA) by gender. Median and IQR are also presented for GlycA based on BMI category for normal weight (BMI < 85th percentile), overweight (BMI 85th to 94th percentile) and obese (BMI ≥ 95th percentile) and percentiles were calculated by gender and grade for GlycA.
Generalized linear mixed models were constructed to examine the association between GlycA and BMI category for 6th grade and 8th grade (adjusting for GlycA in 6th grade), separately for girls and boys taking into account the sources of variability within and between schools. These models were adjusted for race/ethnicity, highest household education, intervention group with the 6th grade models also adjusted for 6th grade Tanner stage and the 8th grade models adjusted for 8th grade Tanner stage and 6th grade GlycA value. Spearman correlations between GlycA and lipid measures, insulin resistance, BMI percentile, and fitness (number of laps) were calculated for 6th grade and 8th grade with both genders combined since there were no appreciable differences between the genders. The analysis of the 8th grade data, which is adjusted for 6th grade values, allows us to account for the longitudinal nature of the data.
Level of fitness was classified into quartiles by grade and gender and then further classified as low, medium or high fitness levels. Low fitness level was defined to be those grouped into the first quartile: 6th grade girls 0–11 laps, 6th grade boys 0–12 laps, 8th grade girls 1–12 laps, 8th grade boys 1–17 laps. Medium fitness level was defined to be those grouped into the second or third quartile: 6th grade girls 12–23 laps, 6th grade boys 13–30 laps, 8th grade girls 13–26 laps, 8th grade boys 18–44 laps. Finally, high fitness was defined as those grouped into the fourth quartile: 6th grade girls 24–57 laps, 6th grade boys 31–75 laps, 8th grade girls 27–79 laps, 8th grade boys 45–103 laps. Adjusted means and standard errors were then computed for GlycA, LP-IR, LDL-P and non-HDL-C within BMI classification (normal, overweight, obese) and fitness level. Levels of GlycA, LP-IR, LDL-P and non-HDL-C were then categorized within the three BMI and three fitness groups to create nine subgroups and these groups were tabulated by gender at both 6th and 8th grade. To further facilitate understanding, the GlycA and LP-IR values in these subgroups were then presented graphically.
All p-values reported within this paper represent findings associated with secondary outcomes from a large cluster randomized controlled trial and these hypotheses were not pre-specified in the trial design. As such, p-values are provided to help facilitate the interpretation of the data only. SAS 9.3 statistical software (SAS Institute, Cary, NC) was used for analyses.
RESULTS
Descriptive statistics for 6th grade participants are presented overall and by gender in Table 1. The data in Table 1 present strong evidence that boys recorded a higher number of shuttle run laps than the girls (23.1 versus 18.5, p<0.001) and some evidence that boys had a higher BMI percentile (75.4 versus 72.4, p = 0.0264) than the girls.
Table 1.
Baseline Characteristics
| Gender | |||||||
|---|---|---|---|---|---|---|---|
|
OVERALL Mean (SD) or N and % |
Female (N=897) Mean (SD) or N and % |
Male (N=767) Mean (SD) or N and % |
p-value**
|
||||
| Age (years) | 11.28 | (0.55) | 11.22 | (0.50) | 11.35 | (0.60) | <.0001 |
| Number of Laps | 20.63 | (11.60) | 18.53 | (9.33) | 23.09 | (13.38) | <.0001 |
| BMI Percentile | 73.75 | (27.48) | 72.37 | (27.35) | 75.35 | (27.57) | 0.0264 |
| BMI Category | 0.0019 | ||||||
| < 85th Percentile | 818 | 49.2% | 471 | 52.5% | 347 | 45.2% | |
| 85th – 94th Percentile | 331 | 19.9% | 184 | 20.5% | 147 | 19.2% | |
| ≥ 95th Percentile | 515 | 30.9% | 242 | 27.0% | 273 | 35.6% | |
| Race/Ethnicity | 0.3107 | ||||||
| Hispanic | 1044 | 62.7% | 573 | 63.9% | 471 | 61.4% | |
| Black | 276 | 16.6% | 151 | 16.8% | 125 | 16.3% | |
| White | 344 | 20.7% | 173 | 19.3% | 171 | 22.3% | |
| Positive Reported 1st Degree Family History of Diabetes | 215 | 12.9% | 115 | 12.8% | 100 | 13.0% | 0.9214 |
| Highest Household Education | 0.8817 | ||||||
| ≤ HS Graduate | 837 | 50.3% | 473 | 52.7% | 364 | 47.5% | |
| ≥ Some college | 827 | 49.7% | 424 | 47.3% | 403 | 52.5% | |
| 6th Grade Pubertal Status | * | ||||||
| Tanner Stage 1 | 168 | 10.1% | 49 | 5.5% | 119 | 15.5% | |
| Tanner Stage 2 | 436 | 26.2% | 120 | 13.4% | 316 | 41.2% | |
| Tanner Stage 3 | 669 | 40.2% | 379 | 42.3% | 290 | 37.8% | |
| Tanner Stage 4 | 357 | 21.5% | 315 | 35.1% | 42 | 5.5% | |
| Tanner Stage 5 | 34 | 2.0% | 34 | 3.8% | 0 | 0 | |
Test does not converge due to zero cells.
p-values obtained from generalized linear mixed models taking account of sources of variability within and between schools.
Supplemental Table A provides descriptive information on the participants included and excluded from the analyses. These data provide some evidence (p = 0.0043) that there was a difference in the ethnicity of the included versus excluded participants with higher proportions of Hispanic (62.7% vs. 40.4%) and White participants (20.7% vs. 12.2%) in the included sample.
Table 2 provides descriptive information (means and 95% CI or median and inter-quartile range) for fitness, lipids, insulin resistance and GlycA variables at 6th and 8th grade along with the temporal changes (8th – 6th grade value) stratified by gender. The table shows that among both girls and boys non-HDL-C, LDL-C and LP-IR decreased between 6th and 8th grade while HOMA-IR increased. GlycA increased by 16 μmol/L (3.8% based on medians) among girls but decreased by 6 μmol/L (3.1% based on medians) among the boys. At 8th grade the median GlycA values were 27 (7.6%) μmol/L higher (381 versus 354) for girls than boys. Supplementary Table B provides percentiles of GlycA by grade and gender.
Table 2.
6th Grade, 8th Grade and Change (8th–6th) in Fitness, Lipids, Insulin Resistance and GlycA by Gender
| Female | Male | |||||||||||
|---|---|---|---|---|---|---|---|---|---|---|---|---|
| 6th Grade | 8th Grade | Difference (8th – 6th) | 6th Grade | 8th Grade | Difference (8th – 6th) | |||||||
| Fitness (# of laps) | 18.5 | (17.9, 19.2) | 21.2 | (20.4, 21.9) | 2.7 | (2.0, 3.3) | 23.1 | (22.1, 24.0) | 33.9 | (32.6, 35.3) | 10.8 | (9.7, 12.0) |
| Non-HDL-C (mg/dL) | 102 | (86, 120) | 95 | (81, 110) | −7 | (−18, 4) | 105 | (88, 124) | 93 | (79, 111) | −11 | (−23, 1) |
| LDL-C (mg/dL) | 83 | (71, 99) | 79 | (67, 93) | −4 | (−15, 5) | 88 | (73, 104) | 77 | (64, 93) | −10 | (−21, −0) |
| HDL-C (mg/dL) | 51 | (44, 59) | 53 | (45, 62) | 2 | (−3, 7) | 51 | (44, 60) | 48 | (41, 56) | −3 | (−8, 2) |
| HOMA-IR | 2.62 | (1.76, 4.19) | 3.35 | (2.34, 4.77) | 0.61 | (−0.42, 1.74) | 2.11 | (1.36, 3.36) | 3.03 | (1.94, 4.62) | 0.84 | (−0.12, 2.12) |
| LP-IR | 32 | (20, 49) | 28 | (16, 42) | −5 | (−15, 5) | 38 | (22, 58) | 36 | (22, 54) | −1 | (−13, 9) |
| GlycA(μmol/L) | 374 | (334, 421) | 397 | (361, 442) | 24 | (−16, 58) | 379 | (333, 425) | 365 | (322, 418) | −10 | (−49, 32) |
Non-HDL-C, LDL-C, HDL-C, HOMA-IR, LP-IR and GlycA are presented as medians and (25th percentile, 75th percentile) while fitness is presented as mean and 95% confidence interval.
Supplementary Table C provides the medians and inter-quartile ranges for GlycA by BMI group stratified by gender and grade level. The median GlycA value for 6th grade obese girls was 417 μmol/L compared to 351 for healthy weight girls, and as such, GlycA levels are 19% higher in obese girls than healthy weight girls. The data in the table provide strong evidence (p<0.001) that in all sub-groups GlycA is higher in higher BMI groups. Supplementary Table D provides Spearman correlations between all of the variables. The number of shuttle run laps is negatively associated with GlycA (r = −0.37 and r = −0.35) and LP-IR (r = −0.34 and r = −0.18) for the 6th and 8th grade associations respectively.
Figure 1 provides a graphical presentation of levels of adjusted GlycA by BMI and fitness categories stratified by gender and 6th or 8th grade. The figure demonstrates that across all four sub-groups there is evidence that as BMI category increases and fitness category decreases levels of GlycA increase. Furthermore, in all four sub-groups the lowest levels of GlycA are in the low BMI/high fitness group with the highest levels in the high BMI/low fitness group. Comparable patterns are also evident for LP-IR levels, which are graphically presented in Figure 2. The data used to create Figures 1 and 2 are available in Supplementary Table E.
Figure 1.
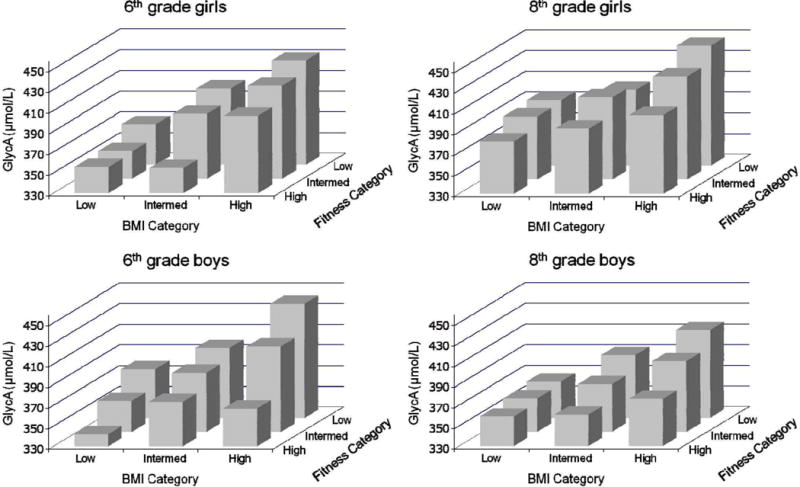
Inflammation (GlycA) in Obesity and Fitness Subgroups
Figure 2.
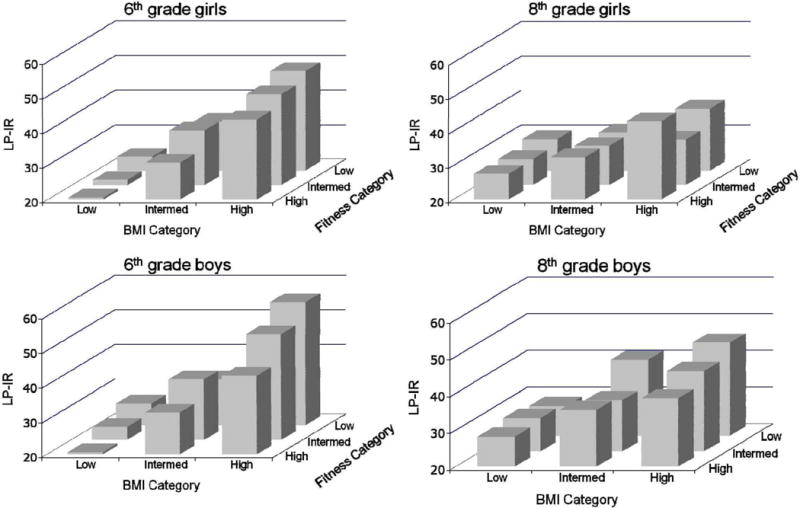
Insulin Resistance (LP-IR) in Obesity and Fitness Subgroups
DISCUSSION
This study is the first to provide descriptive information on levels of GlycA, a new NMR-derived marker of systemic inflammation, in adolescents. The data presented in this study have shown, in an ethnically diverse sample of adolescents, that GlycA is associated with BMI group with levels of GlycA higher across BMI groups among both boys and girls in the 6th and 8th grades. These data also show that GlycA is inversely correlated with shuttle run laps, a surrogate measure of cardiorespiratory fitness at both 6th and 8th grade. Furthermore, when levels of GlycA were analyzed by the three BMI and three fitness groups there is evidence of a relationship between fitness, BMI group and GlycA with the highest levels of GlycA among obese children in the lowest fitness category. The relationship between fitness, BMI and GlycA was similar for both boys and girls at 6th and 8th grade. A key finding of this study is therefore that GlycA, a new measure of systemic inflammation, is associated with both body mass and fitness in a pediatric population. As such, further examination of GlycA in pediatric populations is warranted to identify associations with future disease risk and the response to changes in fitness and body mass among children.
There was evidence that LP-IR was negatively correlated with the number of shuttle laps run at both 6th and 8th grade. We have previously reported that LP-IR is associated with BMI group and change in BMI group among boys and girls in the same sample24. Thus, in this paper we have extended these findings by showing that there are independent effects of fitness and BMI group on LP-IR with the lowest levels of LP-IR among the low BMI/high fitness group and the highest levels among the high BMI/low fitness group. These patterns were comparable among boys and girls at 6th and 8th grade. These finding therefore suggest that facilitating increased fitness and lower BMI is likely to be important for achieving lower levels of LP-IR among adolescents, which may reduce overall CVD risk.
The association reported in this paper between fitness, BMI and GlycA is broadly consistent with previous research, which has shown that fitness is associated with CRP, another measure of systemic inflammation, after accounting for body mass. For example, in a cross-sectional analysis, the fitness levels of young adults were inversely associated with CRP and this association was maintained even after adjustment for body mass index43. Similarly, among adults with type 2 diabetes a change in fitness over 12-months was associated with change in CRP and this association was independent of BMI change44. In adolescents, fitness and fatness (assessed via skinfolds) have been were independently associated with systemic inflammation, as measured by CRP45. There is some evidence that GlycA may be a better marker of shorter-term CVD risk (events occurring within ~6 years) than longer-term risk which may mean that GlycA can serve as an early marker of adult disease risk but it is not currently clear if this is the case for adolescents17. However, GlycA has a lower level of intra-individual variability than CRP which might make it attractive as a CVD risk marker across time. As CRP was not available in the HEALTHY study, it is not possible to directly compare the associations between CRP and GlycA, fitness and BMI group in this dataset. As such, we are unable to state that one biomarker may be preferable to another, but such an assessment in a future study is warranted. Moreover, it would be useful to assess whether intervention studies that target increased fitness and reduced body mass might yield improvements in GlycA.
Higher levels of cardio-respiratory fitness have been associated with a reduced risk of developing cardiovascular disease and type 2 diabetes among adults1, 2. For example, recent analysies of the CARDIA study have shown that fitness in young adulthood was associated with all-cause mortality approximately 27 years later with each additional minute of exercise test duration associated with a 15% lower hazard of death3. Interestingly the study showed that CRP was much higher in the low fitness group, thereby highlighting the important link between fitness and inflammation. The current study extends this work to show how fitness and obesity are independently associated with GlycA, a novel measure of systemic inflammation in a pediatric population.
GlycA levels were 7% higher for girls than boys at 8th grade but were comparable between the genders in 6th grade. This finding is broadly consistent with the adult literature in which CRP levels are higher among women than men46, 47 despite the lack of a difference in absolute or relative risk of cardiovascular events when compared to men48. We presume that this gender difference may represent a hormonal influence upon GlycA, which is independent of its role as a CVD risk marker. The emergence of higher levels of GlycA in 8th grade girls, therefore, might be expected with the progression of puberty, generally occurs between 6th and 8th grade in girls. For example, in this study the proportion of girls classified as Tanner Stage 4 or 5 at 6th grade was 23.5% but by 8th grade this had increased to 94.2%. As previous research has shown that the advancement of puberty is associated with changes in insulin sensitivity49 it may also be the case that pubertal hormones exert more direct effects on systemic inflammation, and this influence may persist beyond puberty. Further research into hormonal influences on these markers of inflammation is therefore warranted.
Strengths/limitations
The major strength of this study is the provision of a detailed analysis of GlycA and LP-IR in a large, ethnically diverse sample of young people progressing from 6th to 8th grade. No comparable data exist and as such these data make a unique contribution to the field. However, the study has several limitations to be considered. Firstly, a field based measure of fitness (shuttle run laps) was used in the analyses. Although this measure has been shown to be closely correlated with directly measured oxygen uptake it is less precise than laboratory based methods50–52. Secondly, we used a self-report measure for assignment of pubertal status. Although this measure has been validated, it is not generally considered to be as reliable as clinician assessment of Tanner staging34. Thirdly, the analyses in this paper have focused on GlycA, a new measure of systemic inflammation, but as CRP is not available in this dataset it is not possible to assess how associations may compare to the more widely used marker of systematic inflammation. Fourth, it is important to recognize that the analyses reported in this paper were conducted on a sub-set of participants who provided consent for ancillary analyses and complete data for all variables were available. In particular, the observed difference in the ethnicity of the included versus the excluded participants is a potential weakness. Fifth, it is important to note that consistent with other studies1, 2 that have examined the association between fitness, body mass and health outcomes we have only assessed and analyzed cardio-vascular fitness and have no data to comment on broader aspects of fitness such as strength. Finally, this is a post hoc analysis of secondary endpoints and our analyses have not been corrected for the multiple comparisons being made, and should therefore be regarded as exploratory.
CONCLUSIONS
GlycA, a new measure of systemic inflammation, was associated with BMI and fitness among an ethnically diverse sample of adolescents in the US. Analyses also provided evidence of independent effects for BMI and fitness groups when related to both GlycA and LP-IR, a multivariate insulin resistance score. These findings suggest that reducing body mass and increasing fitness may reduce both systemic inflammation (GlycA) and insulin resistance (LP-IR). Further examination of how body mass, fitness and changes in both of these health indicators is associated with GlycA in pediatric populations is therefore warranted.
Supplementary Material
Acknowledgments
This work was completed with funding from the National Institute of Diabetes and Digestive and Kidney Diseases (NIDDK)/NIH grant numbers U01-DK61230, U01-DK61249, U01-DK61231, and U01-DK61223, with additional support from the American Diabetes Association. We wish to thank the administration, faculty, staff, students, and their families at the middle schools and school districts that participated in the HEALTHY study. Please see Appendix 1 for a full list of study group members and affiliations. HEALTHY intervention materials are available for download at http://www.healthystudy.org/.
Footnotes
Conflict of interest: JDO is an employee of LabCorp, a commercial supplier of NMR-based diagnostic testing. JBB has been a consultant to LipoScience and Quest Diagnostics under a service agreement with his employer. This provides no direct financial benefit to him.
References
- 1.Lee CD, Blair SN, Jackson AS. Cardiorespiratory fitness, body composition, and all-cause and cardiovascular disease mortality in men. Am J Clin Nutr. 1999;69:373–380. doi: 10.1093/ajcn/69.3.373. [DOI] [PubMed] [Google Scholar]
- 2.Sui X, Hooker SP, Lee IM, Church TS, Colabianchi N, Lee CD, et al. A Prospective Study of Cardiorespiratory Fitness and Risk of Type 2 Diabetes in Women. Diabetes Care. 2007:550–5. doi: 10.2337/dc07-1870. [DOI] [PMC free article] [PubMed] [Google Scholar]
- 3.Shah RV, Murthy VL, Colangelo LA, Reis J, Venkatesh BA, Sharma R, et al. Association of Fitness in Young Adulthood With Survival and Cardiovascular Risk: The Coronary Artery Risk Development in Young Adults (CARDIA) Study. JAMA internal medicine. 2016;176(1):87–95. doi: 10.1001/jamainternmed.2015.6309. [DOI] [PMC free article] [PubMed] [Google Scholar]
- 4.Klop B, Elte JW, Cabezas MC. Dyslipidemia in obesity: mechanisms and potential targets. Nutrients. 2013;5(4):1218–40. doi: 10.3390/nu5041218. [DOI] [PMC free article] [PubMed] [Google Scholar]
- 5.Lavie CJ, Arena R, Swift DL, Johannsen NM, Sui X, Lee DC, et al. Exercise and the cardiovascular system: clinical science and cardiovascular outcomes. Circ Res. 2015;117(2):207–19. doi: 10.1161/CIRCRESAHA.117.305205. [DOI] [PMC free article] [PubMed] [Google Scholar]
- 6.Vasconcellos F, Seabra A, Katzmarzyk PT, Kraemer-Aguiar LG, Bouskela E, Farinatti P. Physical activity in overweight and obese adolescents: systematic review of the effects on physical fitness components and cardiovascular risk factors. Sports Med. 2014;44(8):1139–52. doi: 10.1007/s40279-014-0193-7. [DOI] [PubMed] [Google Scholar]
- 7.Tam CS, Clement K, Baur LA, Tordjman J. Obesity and low-grade inflammation: a paediatric perspective. Obes Rev. 2010;11(2):118–26. doi: 10.1111/j.1467-789X.2009.00674.x. [DOI] [PubMed] [Google Scholar]
- 8.Whitaker RC, Wright JA, Pepe MS, Seidel KD. Predicting obesity in young adulthood from childhood and parental obesity. N Engl J Med. 1997;337:869–873. doi: 10.1056/NEJM199709253371301. [DOI] [PubMed] [Google Scholar]
- 9.Twisk JWR, Kemper HCG, Mechelen WV. Tracking of activity and fitness and the relationsship with cardiovascualr disease risk factors. Medicine & Science in Sports & Exercise. 2000;32(8):1455–1461. doi: 10.1097/00005768-200008000-00014. [DOI] [PubMed] [Google Scholar]
- 10.McMurray RG, Harrell JS, Bangdiwala SI, Hu J. Tracking of physical activity and aerobic power from childhood through adolescence. Med Sci Sports Exerc. 2003;35(11):1914–22. doi: 10.1249/01.MSS.0000093612.59984.0E. [DOI] [PubMed] [Google Scholar]
- 11.Choi J, Joseph L, Pilote L. Obesity and C-reactive protein in various populations: a systematic review and meta-analysis. Obes Rev. 2013;14(3):232–44. doi: 10.1111/obr.12003. [DOI] [PubMed] [Google Scholar]
- 12.Otvos JD, Shalaurova I, Wolak-Dinsmore J, Connelly MA, Mackey RH, Stein JH, et al. GlycA: A novel nuclear magnetic resonance biomarker of systemic inflamation. Clinical Chem. 2015;61(5):714–723. doi: 10.1373/clinchem.2014.232918. [DOI] [PubMed] [Google Scholar]
- 13.Shalaurova I, Connelly MA, Garvey WT, Otvos JD. Lipoprotein insulin resitstance index: a lipoprotein particle-derived measure of insulin resistance. Metabolic Syndrome and Related Disorders. 2014;2014(12):422–429. doi: 10.1089/met.2014.0050. [DOI] [PMC free article] [PubMed] [Google Scholar]
- 14.Jeyarajah EJ, Cromwell WC, Otvos JD. Lipoprotein particle analysis by nuclear magnetic resonance spectroscopy. Clin Lab Med. 2006;26(4):847–70. doi: 10.1016/j.cll.2006.07.006. [DOI] [PubMed] [Google Scholar]
- 15.Akinkuolie AO, Pradhan AD, Ridker PM, Mora S. Novel protein glycan derived biomarker is associated with incident diabetes. Circulation. 2013;2013(A18807) [Google Scholar]
- 16.Connelly MA, Gruppen EG, Wolak-Dinsmore J, Matyus SP, Riphagen IJ, Shalaurova I, et al. GlycA, a marker of acute phase glycoproteins, and the risk of incident type 2 diabetes mellitus: PREVEND study. Clin Chim Acta. 2016;452:10–7. doi: 10.1016/j.cca.2015.11.001. [DOI] [PubMed] [Google Scholar]
- 17.Akinkuolie AO, Buring JE, Ridker PM, Mora S. A novel protein glycan biomarker and future cardiovascular disease events. J Amer Heart Assoc. 2014;3(5):e001221. doi: 10.1161/JAHA.114.001221. [DOI] [PMC free article] [PubMed] [Google Scholar]
- 18.Akinkuolie AO, Glynn RJ, Ridker PM, Mora S. Protein glycan side-chains, rosuvatatin theraphy, and incident vascular events: an analysis from the JUPITER trial. Circulation. 2014;130:A2509. [Google Scholar]
- 19.Duprez D, Neuhaus J, Otvos J, Neaton JD, Lundgren JD. GlycA, a novel marker of inflammataion, predicts cardiovascualr events in HIC-positive patients: results of SMART study. Circulation. 2014;130(A2509) [Google Scholar]
- 20.Gruppen EG, Riphagen IJ, Connelly MA, Otvos JD, Bakker SJ, Dullaart RP. GlycA, a Pro-Inflammatory Glycoprotein Biomarker, and Incident Cardiovascular Disease: Relationship with C-Reactive Protein and Renal Function. PLoS One. 2015;10(9):e0139057. doi: 10.1371/journal.pone.0139057. [DOI] [PMC free article] [PubMed] [Google Scholar]
- 21.Mora S, Otvos JD, Rosenson RS, Pradhan A, Buring JE, Ridker PM. Lipoprotein particle size and concentration by nuclear magnetic resonance and incident type 2 diabetes in women. Diabetes. 2010;59(5):1153–60. doi: 10.2337/db09-1114. [DOI] [PMC free article] [PubMed] [Google Scholar]
- 22.Mackey RH, Mora S, Bertoni AG, Wassel CL, Carnethon MR, Sibley CT, et al. Lipoprotein particles and incident type 2 diabetes in the multi-ethnic study of atherosclerosis. Diabetes Care. 2015;38(4):628–36. doi: 10.2337/dc14-0645. [DOI] [PMC free article] [PubMed] [Google Scholar]
- 23.Mietus-Snyder M, Drews KL, Otvos JD, Willi SM, Foster GD, Jago R, et al. Low-Density Lipoprotein Cholesterol versus Particle Number in Middle School Children. J Pediatr. 2013 doi: 10.1016/j.jpeds.2013.01.012. [DOI] [PMC free article] [PubMed] [Google Scholar]
- 24.Jago R, Drews KL, Otvos JD, Foster GD, Marcus MD, Buse JB, et al. Effect of relative weight group change on nuclear magnetic resonance spectroscopy derived lipoprotein particle size and concentrations among adolescents. J Pediatr. 2014;164(5):1091–1098 e3. doi: 10.1016/j.jpeds.2013.12.029. [DOI] [PMC free article] [PubMed] [Google Scholar]
- 25.Buse J, Hirst K. The HEALTHY study: introduction. Int J Obes (Lond) 2009;33(Suppl 4):S1–2. doi: 10.1038/ijo.2009.110. [DOI] [PubMed] [Google Scholar]
- 26.The Healthy Study Group. A School-Based Intervention for Diabetes Risk Reduction. N Engl J Med. 2010;363(5):445–53. doi: 10.1056/NEJMoa1001933. [DOI] [PMC free article] [PubMed] [Google Scholar]
- 27.DeBar LL, Schneider M, Ford EG, Hernandez AE, Showell B, Drews KL, et al. Social marketing-based communications to integrate and support the HEALTHY study intervention. Int J Obes (Lond) 2009;33(Suppl 4):S52–9. doi: 10.1038/ijo.2009.117. [DOI] [PMC free article] [PubMed] [Google Scholar]
- 28.Gillis B, Mobley C, Stadler DD, Hartstein J, Virus A, Volpe SL, et al. Rationale, design and methods of the HEALTHY study nutrition intervention component. Int J Obes (Lond) 2009;33(Suppl 4):S29–36. doi: 10.1038/ijo.2009.114. [DOI] [PMC free article] [PubMed] [Google Scholar]
- 29.Jago R, McMurray RG, Drews KL, Moe EL, Murray T, Pham TH, et al. HEALTHY Intervention: Fitness, Physical Activity, and Metabolic Syndrome Results. Med Sci Sports Exerc. 2011;43(8):1513–22. doi: 10.1249/MSS.0b013e31820c9797. [DOI] [PMC free article] [PubMed] [Google Scholar]
- 30.Venditti EM, Elliot DL, Faith MS, Firrell LS, Giles CM, Goldberg L, et al. Rationale, design and methods of the HEALTHY study behavior intervention component. Int J Obes (Lond) 2009;33(Suppl 4):S44–51. doi: 10.1038/ijo.2009.116. [DOI] [PMC free article] [PubMed] [Google Scholar]
- 31.Foster GD, Linder B, Baranowski T, Cooper DM, Goldberg L, Harrell JS, et al. A school-based intervention for diabetes risk reduction. N Engl J Med. 2010;363(5):443–53. doi: 10.1056/NEJMoa1001933. [DOI] [PMC free article] [PubMed] [Google Scholar]
- 32.McMurray RG, Bassin S, Jago R, Bruecker S, Moe EL, Murray T, et al. Rationale, design and methods of the HEALTHY study physical education intervention component. Int J Obes (Lond) 2009;33(Suppl 4):S37–43. doi: 10.1038/ijo.2009.115. [DOI] [PMC free article] [PubMed] [Google Scholar]
- 33.Jago R, Bailey R. Ethics and paediatric exercise science: Issues and making a submission to a local ethics and research committee. Journal of Sport Sciences. 2001;19(7):527–535. doi: 10.1080/026404101750238980. [DOI] [PubMed] [Google Scholar]
- 34.Petersen AC, Crockett L, Richards M, Boxer A. A self-report measure of pubertal status: reliability, validity, and initial norms. Youth Adol. 1988;17:117–133. doi: 10.1007/BF01537962. [DOI] [PubMed] [Google Scholar]
- 35.Tanner JM. Growth at adolescence. Blackwell; Oxford: 1962. [Google Scholar]
- 36.Centers for Disease Control National Center for Health Statistics. CDC growth charts for the United States. Atlanta Centers for Disease Control, 2009 2000 [Google Scholar]
- 37.Leger LA, Lambert J. A maximal multistage 20-m shuttle run test to predict VO2 max. Eur J Appl Physiol Occup Physiol. 1982;49(1):1–12. doi: 10.1007/BF00428958. [DOI] [PubMed] [Google Scholar]
- 38.Leger LA, Mercier D, Gadoury C, Lambert J. The multistage 20 metre shuttle run test for aerobic fitness. Journal of sports sciences. 1988;6(2):93–101. doi: 10.1080/02640418808729800. [DOI] [PubMed] [Google Scholar]
- 39.Willi SM, Hirst K, Jago R, Buse J, Kaufman F, El Ghormli L, et al. Cardiovascular risk factors in multi-ethnic middle school students: the HEALTHY primary prevention trial. Pediatric obesity. 2012;7(3):230–9. doi: 10.1111/j.2047-6310.2011.00042.x. [DOI] [PMC free article] [PubMed] [Google Scholar]
- 40.Fridewald WT, Levy RI, Fredrickson DS. Estimation of the concentration of low-density lipoprotein cholesterol in plasma, without use of the preparative ultracentrifuge. Clinical Chem. 1972;18:499–502. [PubMed] [Google Scholar]
- 41.Marcovina S, Bowsher RR, Miller WG, Staten M, Myers G, Caudill SP, et al. Standardization of insulin immunoassays: report of the American Diabetes Association Workgroup. Clinical Chem. 2007;53(4):711–6. doi: 10.1373/clinchem.2006.082214. [DOI] [PubMed] [Google Scholar]
- 42.Matthews DR, Hosker JP, Rudenski AS, Naylor BA, Treacher DF, Turner RC. Homeostasis model assessment: insulin resistance and beta-cell function from fasting plasma glucose and insulin concentrations in man. Diabetologia. 1985;28(7):412–9. doi: 10.1007/BF00280883. [DOI] [PubMed] [Google Scholar]
- 43.Williams MJ, Milne BJ, Hancox RJ, Poulton R. C-reactive protein and cardiorespiratory fitness in young adults. Eur J Cardiovasc Prev Rehabil. 2005;12(3):216–20. doi: 10.1097/01.hjr.0000166453.15722.7b. [DOI] [PubMed] [Google Scholar]
- 44.Balducci S, Zanuso S, Cardelli P, Salvi L, Mazzitelli G, Bazuro A, et al. Changes in physical fitness predict improvements in modifiable cardiovascular risk factors independently of body weight loss in subjects with type 2 diabetes participating in the Italian Diabetes and Exercise Study (IDES) Diabetes Care. 2012;35(6):1347–54. doi: 10.2337/dc11-1859. [DOI] [PMC free article] [PubMed] [Google Scholar]
- 45.Martinez-Gomez D, Eisenmann JC, Warnberg J, Gomez-Martinez S, Veses A, Veiga OL, et al. Associations of physical activity, cardiorespiratory fitness and fatness with low-grade inflammation in adolescents: the AFINOS Study. Int J Obes (Lond) 2010;34(10):1501–7. doi: 10.1038/ijo.2010.114. [DOI] [PubMed] [Google Scholar]
- 46.Lakoski SG, Cushman M, Criqui M, Rundek T, Blumenthal RS, D’Agostino RB, Jr, et al. Gender and C-reactive protein: data from the Multiethnic Study of Atherosclerosis (MESA) cohort. Amer Heart J. 2006;152(3):593–8. doi: 10.1016/j.ahj.2006.02.015. [DOI] [PubMed] [Google Scholar]
- 47.Ford ES, Giles WH, Mokdad AH, Myers GL. Distribution and correlates of C-reactive protein concentrations among adult US women. Clinical Chem. 2004;50(3):574–81. doi: 10.1373/clinchem.2003.027359. [DOI] [PubMed] [Google Scholar]
- 48.Cushman M, Arnold AM, Psaty BM, Manolio TA, Kuller LH, Burke GL, et al. C-reactive protein and the 10-year incidence of coronary heart disease in older men and women: the cardiovascular health study. Circulation. 2005;112(1):25–31. doi: 10.1161/CIRCULATIONAHA.104.504159. [DOI] [PubMed] [Google Scholar]
- 49.Moran A, Jacobs DR, Jr, Steinberger J, Hong CP, Prineas R, Luepker R, et al. Insulin resistance during puberty: results from clamp studies in 357 children. Diabetes. 1999;48(10):2039–44. doi: 10.2337/diabetes.48.10.2039. [DOI] [PubMed] [Google Scholar]
- 50.Liu NY, Plowman SA, Looney MA. The reliability and validity of the 20-meter shuttle test in American students 12 to 15 years old. Res Q Exerc Sport. 1992;63(4):360–5. doi: 10.1080/02701367.1992.10608757. [DOI] [PubMed] [Google Scholar]
- 51.van Mechelen W, Hlobil H, Kemper HCG. Validation of two running tests as estimates of maximal aerobic power in children. Eur J Appl Physiol Occup Physiol. 1986;55(5):503–506. doi: 10.1007/BF00421645. [DOI] [PubMed] [Google Scholar]
- 52.Boreham CA, Paliczka VJ, Nichols AK. A comparison of the PWC170 and 20-MST tests of aerobic fitness in adolescent schoolchildren. J Sports Med Phys Fitness. 1990;30(1):19–23. [PubMed] [Google Scholar]
Associated Data
This section collects any data citations, data availability statements, or supplementary materials included in this article.