Abstract
Glutamine synthetase (GS) catalyzes the recycling of NH4+ with glutamate to form glutamine. GS is highly expressed in the renal proximal tubule (PT), suggesting ammonia recycling via GS could decrease net ammoniagenesis and thereby limit ammonia available for net acid excretion. The purpose of the present study was to determine the role of PT GS in ammonia metabolism under basal conditions and during metabolic acidosis. We generated mice with PT-specific GS deletion (PT-GS-KO) using Cre-loxP techniques. Under basal conditions, PT-GS-KO increased urinary ammonia excretion significantly. Increased ammonia excretion occurred despite decreased expression of key proteins involved in renal ammonia generation. After the induction of metabolic acidosis, the ability to increase ammonia excretion was impaired significantly by PT-GS-KO. The blunted increase in ammonia excretion occurred despite greater expression of multiple components of ammonia generation, including SN1 (Slc38a3), phosphate-dependent glutaminase, phosphoenolpyruvate carboxykinase, and Na+-coupled electrogenic bicarbonate cotransporter. We conclude that 1) GS-mediated ammonia recycling in the PT contributes to both basal and acidosis-stimulated ammonia metabolism and 2) adaptive changes in other proteins involved in ammonia metabolism occur in response to PT-GS-KO and cause an underestimation of the role of PT GS expression.
Keywords: acid-base, ammonia, glutamine synthetase, proximal tubule
a major function of the kidney is to maintain acid-base homeostasis under basal conditions and in response to a variety of physiologic disturbances (29). In the kidney, ammonia1 metabolism is a central component of basal net acid excretion, and changes in ammonia metabolism and urinary excretion are the primary components of the renal response to metabolic acidosis (62, 64, 66). Accordingly, understanding the molecular mechanisms of renal ammonia metabolism is central to understanding mammalian physiology and pathophysiology.
Renal ammonia metabolism involves integrated functions of intrarenal ammoniagenesis and epithelial cell-specific NH3 and NH4+ transport. Ammoniagenesis involves cellular glutamine uptake and metabolism through an enzymatic process involving phosphate-dependent glutaminase (PDG), glutamate dehydrogenase, and phosphoenolpyruvate carboxykinase (PEPCK) (7, 59, 60, 63, 65, 66). Ammonia produced in the kidney undergoes regulated transport of both NH3 and NH4+ by a variety of specific proteins, including Na+/H+ exchanger (NHE)3, Na+-K+-Cl− cotransporter (NKCC)2, NHE4, Na+-K+-ATPase, and Rh glycoproteins B and C (Rhbg and Rhcg, respectively) (10, 25, 28, 63, 66, 67). This integrated interaction of intrarenal ammonia production and transport facilitates highly regulated renal ammonia metabolism and excretion.
However, not all ammonia produced by renal epithelial cells is excreted. The enzyme glutamine synthetase (GS) uses intracellular NH4+ and glutamate to form glutamine in a reaction that simultaneously generates H+ (46, 55). Thus, GS has the opposite role of ammoniagenic enzymes in renal ammonia metabolism and may have an important role in renal ammonia homeostasis. Moreover, GS expression is altered in multiple physiological conditions where ammonia excretion is altered, including metabolic acidosis, hypokalemia, and dietary protein restriction (6, 31, 33, 36, 58, 71). In each of these conditions, GS expression varies inversely with ammonia excretion. Thus, GS-mediated ammonia recycling likely contributes to renal ammonia generation and urinary excretion.
The purpose of the present study was to determine whether GS has a role in basal ammonia metabolism and in the response to metabolic acidosis by examining the effects of its deletion on ammonia metabolism. Because GS is expressed in multiple cell types in the kidney (58) and because expression in different cell types is differentially regulated (58), we specifically examined a model of proximal tubule (PT)-specific GS deletion (PT-GS-KO). We hypothesized that if PT GS contributes to basal ammonia metabolism, then its deletion should increase urinary ammonia excretion. If changes in GS expression contribute to the response to acidosis, then its deletion should compromise the ability to increase net ammonia generation and ammonia excretion.
To test this hypothesis, we generated mice with PT-GS-KO using Cre-loxP techniques. We then determined the effect of PT-GS-KO on basal ammonia excretion. Because PT-GS-KO increased ammonia excretion, we determined if this could be explained by mechanisms independent of GS, such as alterations in urinary pH or in the expression of proteins involved in renal ammonia metabolism. Finally, we acid-loaded mice and determined the effect of PT-GS-KO on the renal responses to metabolic acidosis. Because PT-GS-KO blunted the increase in ammonia excretion, we determined whether this could be explained by impaired urine acidification or by decreased expression of proteins involved in PT ammonia generation.
METHODS
Animals.
We used mice with loxP sites flanking exons 1 and 7 of the GS gene (GSfl/fl) that have been previously described (20, 21). We induced PT-GS-KO by breeding with mice expressing Cre recombinase under control of the PEPCK-Cre promoter (PEPCK-Cre) (47). This PEPCK promoter is a modified promoter that decreases hepatocyte PEPCK expression by ∼60% and increases renal expression by ∼10-fold (45, 47). Control mice were GSfl/fl but PEPCK-Cre negative littermates. We genotyped all mice using DNA extracted from tail-clip samples, as previously described (20, 21, 27, 31, 34, 47). All mice used in these experiments were adult male mice averaging ∼7 mo of age. Age-matched littermates were used in all experiments. All animal experiments were approved by the University of Florida and the North Florida/South Georgia Veterans Health System Institutional Animal Care and Use Committee. Animal breeding was performed in the University of Florida College of Medicine Cancer and Genetics Transgenic Animal Core Facility by trained personnel. All mice were on the C57/Bl6 background strain.
Antibodies.
Affinity-purified antibodies to SN1 have been previously characterized (4). Dr. Norman Curthoys (Colorado State University) graciously provided rabbit polyclonal antibody raised against the COOH-terminal 14 amino acids of human PDG (KENQTVHKNLDGLL), which has been previously characterized (24). Antibodies to PEPCK were obtained from Cayman Chemical (no. 10004943, Ann Arbor, MI), antibodies to GS were obtained from Abcam (ab73593, Cambridge, MA), antibodies to NHE3 were obtained from StressMarq Biosciences (SPC-400D, Victoria, BC, Canada), and antibodies to Na+-coupled bicarbonate cotransporter (NBCe1; Slc4a4) were obtained from Proteintech (no. 11885-1-AP, Chicago, IL). We confirmed specificity of the NBCe1 antibody using both immunoblot analysis and immunohistochemistry of kidneys from wild-type and NBCe1 knockout mice (data not shown).
Acid loading.
An acid diet was prepared as we have previously described (2, 31, 34, 36, 49, 50). Briefly, we added 0.4 M HCl to powdered standard rodent chow at a ratio of 1 ml/g chow. The control diet was identical except that we substituted deionized water for HCl. Adult male animals at >5 mo of age were placed into metabolic cages (Tecniplast Diuresis Metabolic Cage, Fisher Scientific).
Metabolic cage experiments.
Animals were allowed to acclimate for 2 days while receiving the control diet and then were allocated to either the HCl diet or control diet. Daily food intake was measured. Urine was collected under mineral oil, and daily urine volume and pH were recorded. Urine samples were stored at −20°C until analyzed further. Body weight was measured daily.
Electrolyte measurements.
Urine ammonia was measured using a modification of a commercially available kit (A7553, Pointe Scientific, Canton, MI) as previously described (31). Urine pH was measured using a micro-pH electrode (ROSS semi-micro pH, Orion 8115BN, Thermo Scientific). Plasma bicarbonate was measured as total CO2 using a commercially available kit (C750-120, Pointe Scientific) as previously described (33) and a blood gas analyzer (RAPIDLab 348 analyzer, Siemens). Plasma Na+ and K+ were measured using a flame photometer (Instrumentation Laboratory, Lexington, MA). Urinary titratable acid was measured using methods we have previously described (31).
Tissue preparation for immunolocalization.
Mice were anesthetized with inhalant isoflurane. The kidneys were preserved by in vivo cardiac perfusion with PBS (pH 7.4) followed by periodate-lysine-2% paraformaldehyde (PLP), cut transversely into several 2- to 3-mm-thick slices, and then immersed for 48 h at 4°C in the same fixative. Skeletal muscle, midjejunum, midtransverse colon, and white and brown adipose tissues were collected after in vivo perfusion with PBS and preserved by immersion in PLP for 48 h at 4°C. Tissue samples from each animal were embedded in polyester wax made using polyethylene glycol 400 distearate (Polysciences, Warrington, PA) with 10% 1-hexadecanol, and 3-μm-thick sections were cut and mounted on gelatin-coated glass slides.
Immunohistochemistry.
Immunolocalization was accomplished using standard immunoperoxidase procedures. Briefly, sections were dewaxed in ethanol, rehydrated, and then rinsed in PBS. Endogenous peroxidase activity was quenched by incubating sections in 3% H2O2 in distilled water for 45 min. Sections were blocked for 15 min with Serum-Free Protein Block (Dako Cytomation) and then incubated at 4°C overnight with primary antibody diluted in Dako antibody diluent. Sections were washed in PBS, incubated for 30 min with polymer-linked, peroxidase-conjugated goat anti-rabbit IgG (MACH2, Biocare Medical, Concord, CA), again washed with PBS, and then exposed to diaminobenzidine (DAB) for 5 min. Sections were washed in distilled water, dehydrated with xylene, mounted, and observed by light microscopy. Comparisons of labeling were made only between samples preserved and processed at the same time and sections from the same immunohistochemistry experiment. Sections were examined on a Nikon E600 microscope equipped with DIC optics and photographed using a DMX1200F digital camera and ACT-1 software (Nikon). Color correction was performed using Adobe Photoshop software (Adobe Systems, San Jose, CA).
Double-immunolabeling procedures.
Double immunolabeling was accomplished using sequential immunoperoxidase procedures previously described in detail (32, 33, 36). Briefly, tissue sections were labeled with the first primary antibody using Vector SG (Vector Laboratories, Burlingame, CA) as the chromogen to produce a blue label, as described above. After the Vector SG reaction, sections were washed in PBS and then blocked using 3% H2O2 in methanol. The above procedure was repeated with the substitution of a second primary antibody and the substitution of DAB for Vector SG. This brown label was easily distinguishable from the blue label produced by the Vector SG. Sections were then washed with glass distilled water, dehydrated with xylene, mounted with Permount, and observed by light microscopy.
Protein preparation.
Animals were anesthetized with inhalant isoflurane, and tissues were rinsed by in vivo cardiac perfusion with PBS (pH 7.4). The right renal vasculature was clamped, the right kidney was rapidly removed, and the cortex, outer stripe of the outer medulla, and inner stripe of the outer medulla were isolated rapidly under a dissection microscope. Samples of the midjejunum and midtransverse colon were removed, the lumen was rinsed with PBS, and samples of skeletal muscle (gastrocnemius) and white and brown adipose tissues were collected. All samples were snap frozen in liquid nitrogen and stored frozen at −70°C until used. Tissues were homogenized in T-PER Tissue Protein Extraction Reagent (Pierce Biotechnology) using microtube pestles (USA Scientific, Ocala, FL), and protein was extracted according to the manufacturer's recommended procedures. An aliquot was obtained for protein determination using a BCA assay, and the remainder was stored frozen at −70°C until used.
Immunoblotting procedures.
Five to ten micrograms of renal protein were electrophoresed on 10% PAGE ReadyGel (Bio-Rad, Hercules, CA). Gels were then transferred electrophoretically to nitrocellulose membranes. We confirmed that protein loading and transfer efficiency did not differ significantly between samples using Ponceau S staining, as we have previously described (1, 2, 16, 33, 35, 36). Membranes were then blocked with 5 g/dl nonfat dry milk in Blotto buffer (50 mM Tris, 150 mM NaCl, 5 mM Na2EDTA, and 0.05% Tween 20; pH 7.6) and incubated at 4°C overnight with primary antibody diluted in nonfat dry milk. After being washed, membranes were exposed to secondary antibody, goat anti-rabbit IgG (Millipore, Billerica, MA) conjugated to horseradish peroxidase, at a dilution of 1:5,000. Sites of antibody-antigen reaction were visualized using enhanced chemiluminescence (SuperSignal West Pico Substrate, Pierce) and a Kodak Image Station 440CF digital imaging system. Band density was quantified using Kodak 1D (version 5.0) software (Kodak Scientific Imaging, New Haven, CT). Band density was normalized such that mean density in the same region (cortex or outer stripe of the outer medulla or inner stripe of the outer medulla) in control tissues was 100. The absence of saturation was confirmed by examining pixel intensity distribution in all immunoblots.
Quantitative immunohistochemistry.
We performed quantitative immunohistochemistry using previously reported techniques (58). Briefly, high-resolution digital micrographs were taken of randomly selected fields using a Nikon E600 microscope equipped with a DXM1200F digital camera and ACT-1 software (Nikon USA). Images to be compared were collected during the same photomicroscopy session under identical imaging conditions and using no image enhancement techniques. Using National Institutes of Health ImageJ (version 1.34j) software and a Bamboo CTH-460 pen tablet (Wacom, Vancouver, WA), individual collecting duct cells expressing GS immunolabel were then identified and carefully outlined. Pixel intensity and the number of pixels within the outlined area were then analyzed using custom-written macros executed in Microsoft Excel 2010. Background intensity was subtracted from individual pixel intensity to determine GS-specific intensity. We then integrated GS-specific pixel intensity within the cell profile area to determine total cell-specific immunolabel. Cell area was determined from the number of pixels within the outlined region. The interindividual measurement variability of both immunolabel intensity and cell area using this technique is <5% (58). In all measurements, the individual performing the microscopy and quantifying the results was blinded as to the treatment group of each animal. Data from all cells from a given tubule segment were averaged for each animal; pooled data from each animal were used for statistical analysis.
Quantification of proximal tubule cells with GS deletion.
We determined the percentage of PT cells with GS deletion in specific PT subsegments of PT-GS-KO mice using double immunolabeling of tissue sections for GS and the PT cell-specific marker NBCe1. High-resolution (36 megapixel) images were obtained using DIC optics and a ×40 objective and examined under contrast-enhanced conditions to enable identification of the nucleus. Each nucleus was used as a marker of a single cell. Proximal convoluted tubules were identified as tubules in the cortical labyrinth that had abundant basolateral NBCe1-positive plasma membranes. Proximal straight tubules in both the cortex and outer stripe of the outer medulla were identified as NBCe1-positive tubules; in the cortex, proximal straight tubules were located in the medullary ray, whereas in the outer stripe of the outer medulla, proximal straight tubules were located deep to proximal convoluted tubules at the corticomedullary junction. Photomicrographs were collected of at least five randomly selected fields for each PT subtype, and all tubule profiles meeting the identification criteria that were entirely visible in the micrograph were examined. The proportion of PT cells with GS deletion was determined from the number of PT cells not expressing GS immunolabel versus the total number of cells. The proportion was determined in each tubule profile, and the values were averaged to represent the proportion of cells with GS deletion in each PT subtype for each animal; the average values for each animal were used for statistical comparisons of the proportion of cells with GS deletion by PT subtype.
Statistics.
Results are presented as means ± SE; n refers to the numbers of animal studied. Statistical analyses were performed using Student's t-test. P values of <0.05 were taken as statistically significant.
RESULTS
GS expression in PT-GS-KO mice.
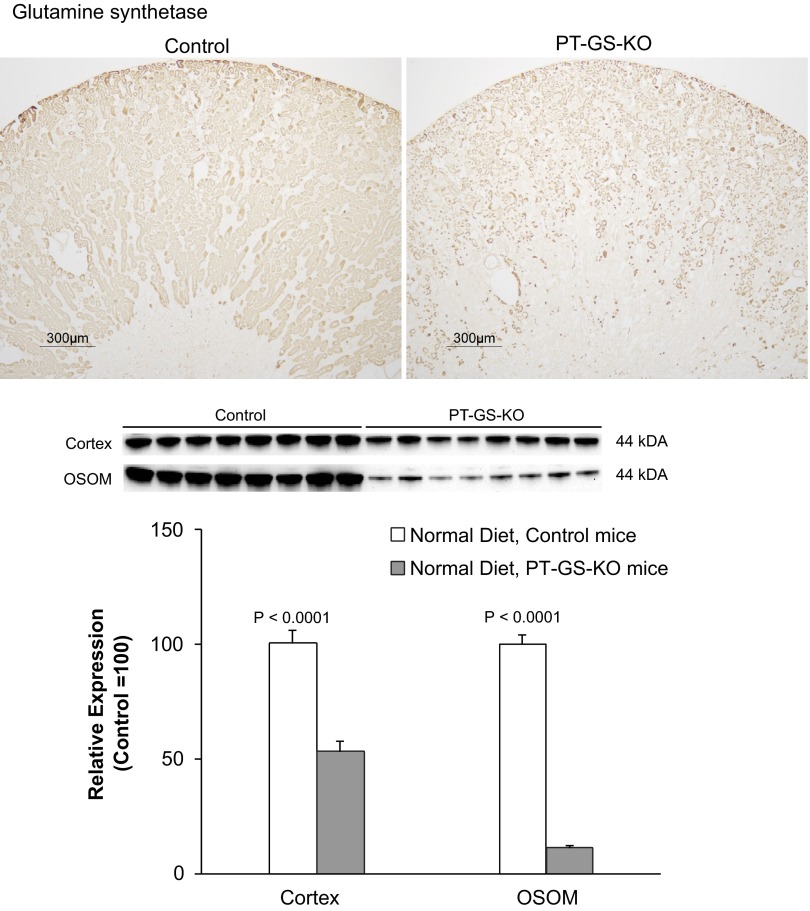
We first confirmed the specificity of this model of PT-GS-KO using immunohistochemistry. Low-power microscopy confirmed a significant decrease in GS immunolabel in both the cortex and outer medulla (Fig. 1). Because GS is expressed in both the PT and in non-PT cells in both the cortex and outer stripe of the outer medulla (58), the residual expression in PT-GS-KO mice could reflect either incomplete PT deletion or continued expression in non-PT cells.
Fig. 1.
Glutamine synthetase (GS) expression in GSfl/fl, phosphoenolpyruvate carboxykinase (PEPCK)-Cre-negative and GSfl/fl, PEPCK-Cre-positive mice. Top: representative low-power micrographs of GS expression in control mouse kidneys and kidneys from mice with proximal tubule (PT)-specific GS deletion (PT-GS-KO). A clear decrease in GS immunoreactivity was evident in PEPCK-Cre-positive kidneys. Results are representative of findings of n = 6 mice/genotype. Bottom: immunoblot analysis of GS expression in the cortex and outer stripe of the outer medulla (OSOM) of control and PT-GS-KO mice. PT-GS-KO resulted in significant decreases in GS expression in both the cortex and OSOM. Values are means ± SE; n = 8 mice/genotype.
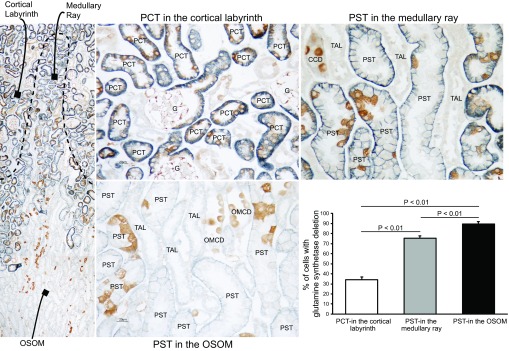
To differentiate these possibilities, we determined the cell-specific pattern of GS expression in PT-GS-KO mice using double immunolabeling for GS and the PT-specific marker NBCe1 (Fig. 2). In control mice, GS immunolabel was present in all PT cells, as we have previously reported for wild-type mice (58). In PT-GS-KO mice, GS immunolabel was deleted from 34.2 ± 2.9% of proximal convoluted tubule cells in the cortex, 75.4 ± 2.2% of proximal straight tubule cells in the cortex, and 89.4 ± 2.3% of proximal straight tubule cells in the outer medulla (n = 4 kidneys/group). The proportion of PT cells with GS deletion increased progressively from the proximal convoluted tubule through the proximal straight tubule. In addition, PT cells that retained GS expression frequently exhibited more intense GS immunoreactivity compared with comparable PT cells in control mice. However, there was no evidence of heterogeneous PT SN1, PEPCK, or NBCe1 expression in PT-GS-KO mice (data not shown). Although metabolic acidosis would be expected to activate the PEPCK promoter that regulates Cre recombinase expression in these mice, in preliminary experiments, 3 days of experimental metabolic acidosis did not alter the extent of PT-GS-KO (data not shown).
Fig. 2.
Double immunolabel of GS with Na+-coupled bicarbonate cotransporter (NBCe1) in PT-GS-KO kidneys. To determine the extent of GS deletion from the PT, we used double immunolabel of GS (brown) with the PT-specific marker NBCe1 (blue). DIC imaging with contrast enhancement was used to identify cell nuclei. Representative micrographs of the proximal convoluted tubule (PCT) in the cortex (top left), proximal straight tubule (PST) in the cortex (top right), and PST in the outer medulla (bottom left) are shown. The proportion of nucleated cells in the PST with GS deletion is shown in the bottom right. There was significant GS deletion throughout the entire PT, with greater levels of deletion in the PST than in the PCT. GS immunolabel is present in intercalated cells in the cortical collecting duct (CCD) and in the outer medullary collecting duct (OMCD). No immunolabel is present in the thick ascending limb of the loop of Henle (TAL). G, glomerulus. n = 4 mice for each PT region. Statistical analysis was performed using a paired t-test.
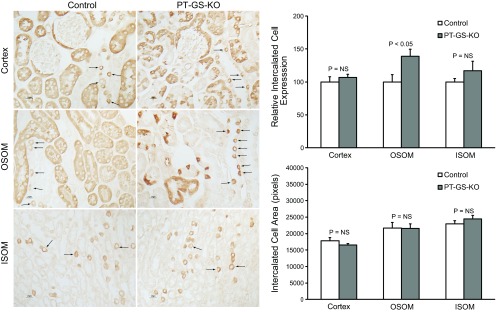
GS is also expressed in intercalated cells in both the cortex and outer medulla (58). We observed no detectable difference in the number or distribution of GS-positive intercalated cells in collecting duct segments of PT-GS-KO mice compared with control mice. However, there was increased GS expression in intercalated cells in the outer stripe of the outer medulla of PT-GS-KO mice compared with control mice; quantitative immunohistochemistry confirmed this observation (Fig. 3). Thus, although PT-GS-KO results in specific GS deletion in PT cells, there are adaptive responses in the level of GS expression in PT cells in which Cre recombinase did not cause GS gene deletion and in intercalated cells in the outer stripe of the outer medullary collecting duct.
Fig. 3.
GS expression in intercalated cells in the cortex, OSOM, and inner stripe of the outer medulla (ISOM). Intercalated cell GS immunolabel (arrows) was present in PT-GS-KO mice in a pattern similar to that observed in control mice (left). In the OSOM, intercalated cell GS immunolabel intensity appeared greater in PT-GS-KO mice than in control mice. Quantitative immunohistochemistry (top right) confirmed this observation. There was no significant difference in intercalated cell GS immunolabel intensity in either the cortex or ISOM. PT-GS-KO did not significantly alter intercalated cell mean area in either the cortex, OSOM, or ISOM (bottom right). n = 4 mice/genotype. NS, not significant.
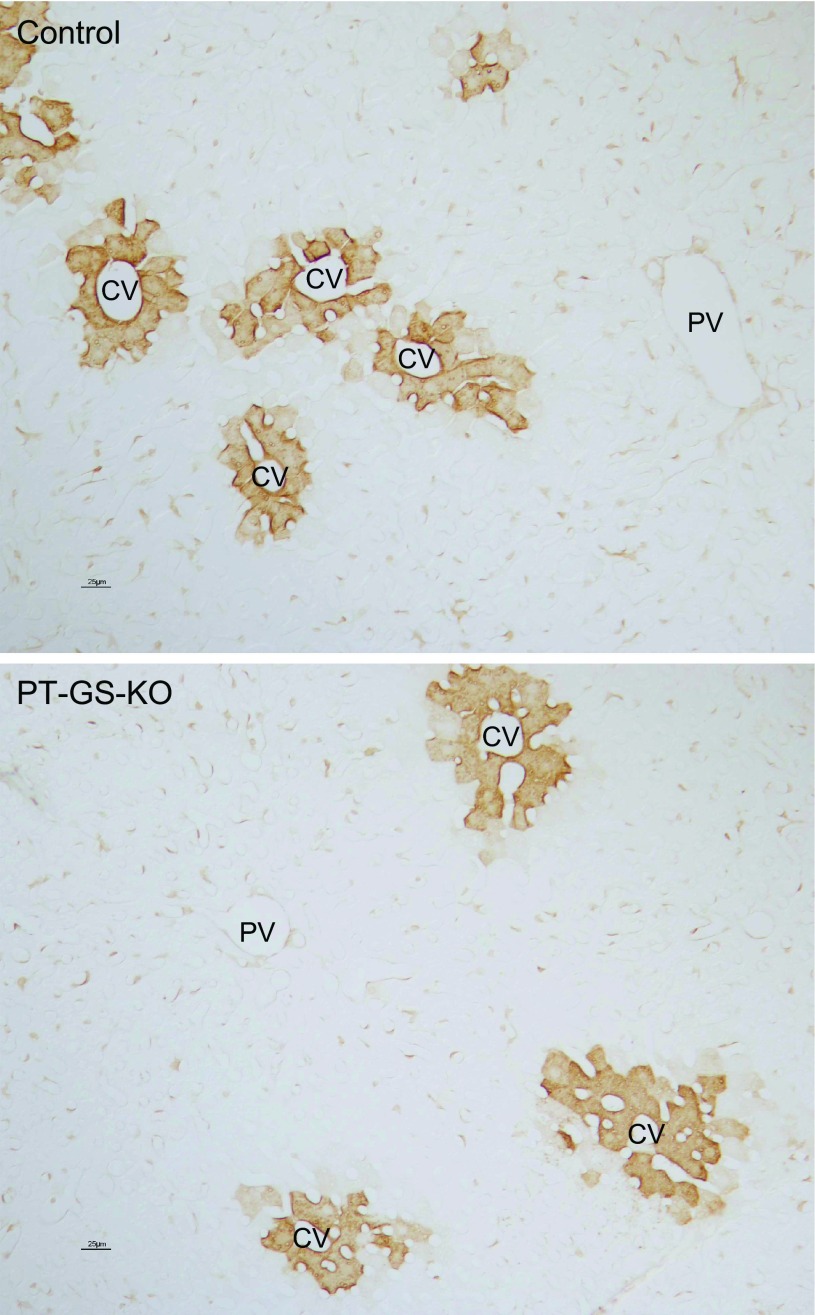
Another important site of GS expression is the liver, where it is expressed in pericentral hepatocytes (14, 19, 53, 61). Immunohistochemical examination of livers from control and PT-GS-KO mice (Fig. 4) showed no change in hepatocyte GS expression. We similarly observed no evidence of GS gene deletion using immunohistochemistry and immunoblot analysis in tissues from the skeletal muscle (gastrocnemius), jejunum, midtransverse colon, and white fat and brown fat (data not shown).
Fig. 4.
Hepatic GS expression in control and PT-GS-KO mice. GS was expressed normally in the liver in pericentral hepatocytes and was present in both control (top) and PT-GS-KO (bottom) mouse livers. There was no detectable difference in GS expression between control and PT-GS-KO mice. PV, portal vein; CV, central vein.
Physiological parameters.
To determine the specific role of PT-GS-KO on basal acid-base homeostasis and renal ammonia metabolism, we first examined plasma electrolytes and urinary ammonia excretion in PT-GS-KO and control mice. Table 1 and Fig. 5 show these results. Daily food intake, urine pH, and urine volume did not differ significantly between PT-GS-KO mice and control mice on a normal diet. PT-GS-KO increased urinary ammonia excretion significantly (102 ± 10 μmol/day in PT-GS-KO mice vs. 75 ± 8 μmol/day in control mice, n = 14 and 8, respectively, P < 0.05). Plasma Na+ was slightly but significantly lower in PT-GS-KO mice than in control mice. Plasma K+ and HCO3− did not differ significantly between PT-GS-KO and control mice. The increased ammonia excretion in PT-GS-KO mice is consistent with PT ammonia recycling via GS having an important role in ammonia metabolism under basal conditions.
Table 1.
Physiological parameters under basal conditions
| Parameter | Control | PT-GS-KO | P Value |
|---|---|---|---|
| Body weight, g | 36.0 ± 1.6 (8) | 41.6 ± 1.4 (14) | <0.05 |
| Food intake, g | 11.6 ± 1.1 (8) | 11.6 ± 0.5 (14) | NS |
| Urine pH | 6.13 ± 0.05 (8) | 6.24 ± 0.05 (14) | NS |
| Urine volume, ml/day | 2.07 ± 0.40 (8) | 2.47 ± 0.23 (14) | NS |
| Urine ammonia, μmol/day | 75 ± 8 (8) | 102 ± 10 (14) | <0.05 |
| Urine titratable acid excretion, μmol/day | 117 ± 26 (8) | 121 ± 12 (14) | NS |
| Serum Na+, mmol/l | 153.6 ± 3.7 (7) | 146.8 ± 0.4 (14) | <0.05 |
| Serum K+, mmol/l | 5.0 ± 0.3 (7) | 4.6 ± 0.2 (14) | NS |
| Serum HCO3−, mmol/l | 15.8 ± 0.9 (7) | 15.6 ± 0.8 (14) | NS |
Values are means ± SE; numbers in parentheses are numbers of animals in each group. PT-GS-KO, proximal tubule-specific glutamine synthetase deletion; NS, not significant. Food was mixed in a 1:1 ratio with water, and the total weight ingested is shown. The actual nutrient intake was 50% of the weight ingested.
Fig. 5.
Effect of PT-GS-KO on urinary ammonia and pH. Left: PT-GS-KO caused a significant increase in basal urinary ammonia excretion. Right: PT-GS-KO did not alter urinary pH under basal conditions.
Effect of PT-GS-KO on PDG and SN1 expression under basal conditions.
Increased ammonia excretion in PT-GS-KO mice could occur either because of decreased ammonia recycling or because of increased ammonia generation. To differentiate these possibilities, we determined whether the increased ammonia excretion with PT-GS-KO occurred because of an unexpected increase in the expression of proteins involved in ammoniagenesis.
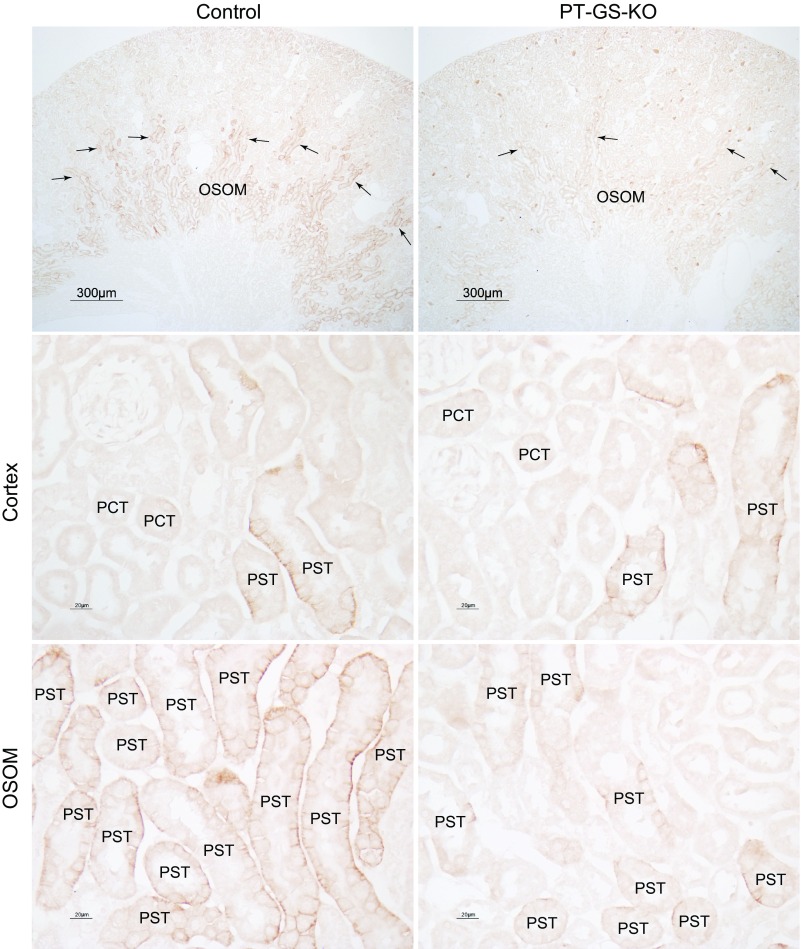
PT ammonia generation requires cellular glutamine uptake. The major protein involved in adaptive changes in PT glutamine uptake is SN1 (23, 26, 41, 44, 54). Similar to previous reports (5, 54), we observed basolateral SN1 immunolabel expression in the proximal straight tubule in both control and PT-GS-KO mice. However, in PT-GS-KO mice, the SN1 immunolabel intensity in the outer stripe of the outer medulla and in proximal straight tubules in the deep inner cortex was substantially less than in control kidney (Fig. 6). This decreased SN1 expression cannot explain the increased ammonia excretion.
Fig. 6.
Effect of PT-GS-KO on SN1 expression in mice fed a normal diet. Top: low-power micrographs of SN1 immunolabel in control and PT-GS-KO kidneys. Strong SN1 immunoreactivity was evident in the OSOM and extended into the medullary rays (arrows) in the deep inner cortex of control kidneys. In PT-GS-KO, SN1 immunoreactivity in these regions was markedly reduced. Middle: high-power micrographs of basolateral SN1 immunolabel in the midcortex. Although SN1 immunolabel was decreased by PT-GS-KO in the PST in the deep inner cortex, in the mid and outer cortical PST, SN1 immunolabel was not appreciably different between control and PT-GS-KO mice. SN1 label in the PCT was negligible in both genotypes. Bottom: SN1 immunolabel in the OSOM. In PSTs in the OSOM, SN1 immunoreactivity was less intense than in mice with PT-GS-KO compared with control mice.
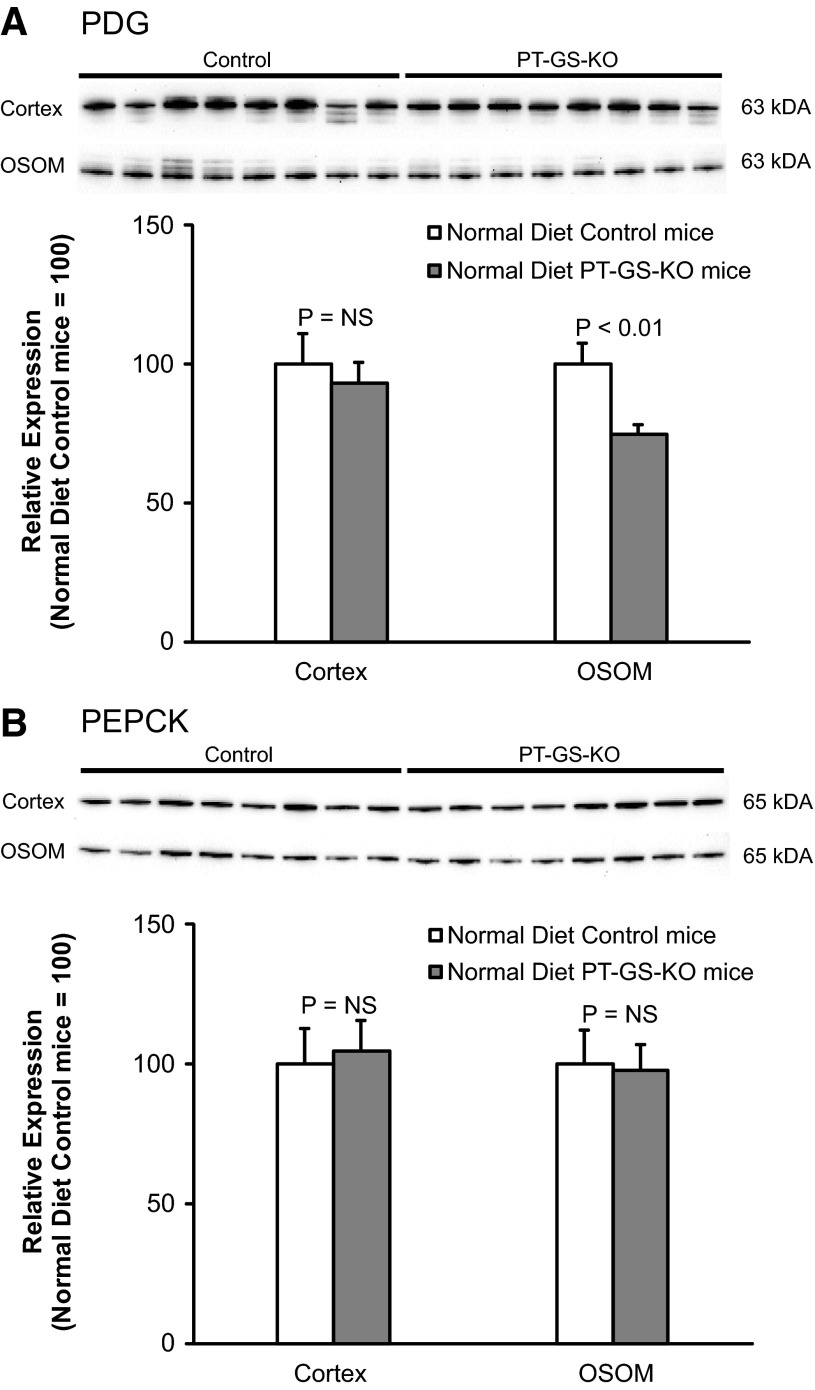
The initial, and rate-limiting, enzyme involved in renal ammoniagenesis is PDG (7, 56, 57, 66). In the outer stripe of the outer medulla, the site of the greatest extent of GS deletion, PT-GS-KO mice had significantly less PDG expression than control mice (Fig. 7). Importantly, decreased PDG expression cannot explain the increased ammonia excretion observed. Instead, it is consistent with deletion of an ammonia recycling protein causing an adaptive decrease in an ammonia-generating protein.
Fig. 7.
Effect of PT-GS-KO on renal phosphate-dependent glutaminase (PDG) and PEPCK protein expression in mice fed a normal diet. Top: effects of PT-GS-KO on PDG expression by immunoblot analysis. In the cortex, PDG expression was not significantly different between control and PT-GS-KO mice. In the OSOM, PDG expression was significantly decreased in PT-GS-KO mice. Bottom: effects of PT-GS-KO on PEPCK expression. Cortical and OSOM PEPCK expression were not significantly different between control and PT-GS-KO mice. Values are means ± SE; n = 8 mice/genotype.
Thus, deletion of the ammonia recycling enzyme GS causes a parallel decrease in the expression of two proteins involved in ammonia generation: the glutamine uptake transporter SN1 and the initial enzyme involved in ammonia generation PDG. These changes cannot explain the observed increase in urinary ammonia excretion. Instead, they appear to be adaptive changes that counterbalance the lack of PT ammonia recycling resulting from PT-GS-KO.
Renal response to metabolic acidosis.
The normal renal response to metabolic acidosis is increased renal ammonia excretion. Previous studies have shown that metabolic acidosis decreases GS expression and activity. This suggests that decreasing GS-mediated ammonia recycling is an integral component of the ability to increase “net” ammonia generation. Moreover, it suggests that the inability to suppress GS-mediated ammonia recycling would impair the ability to increase ammonia excretion during metabolic acidosis. To test this, we determined the effect of PT-GS-KO on the response to metabolic acidosis.
After HCl loading for 7 days, both control and PT-GS-KO mice exhibited metabolic acidosis, measured as serum HCO3− (control: 8.9 ± 0.5 mmol/l vs. PT-GS-KO: 9.6 ± 0.7 mmol/l, n = 11 and 12, respectively, P = not significant). Plasma Na+ and K+ did not differ significantly between PT-GS-KO and control mice (Table 2). Food intake, and thus the degree of acid loading, did not differ significantly between PT-GS-KO and control mice. In addition, there was no difference in weight change between control and PT-GS-KO mice (data not shown).
Table 2.
Physiological parameters after acid loading
| Parameter | Control | PT-GS-KO | P Value |
|---|---|---|---|
| Serum Na+, mmol/l | 149.0 ± 1.7 (11) | 150.8 ± 0.8 (12) | NS |
| Serum K+, mmol/l | 4.8 ± 0.3 (11) | 4.5 ± 0.1 (12) | NS |
| Serum HCO3−, mmol/l | 8.9 ± 0.5 (11) | 9.6 ± 0.7 (12) | NS |
| Mean daily food intake, g/day | 9.4 ± 0.4 (12) | 8.6 ± 0.4 (12) | NS |
Values are means ± SE; numbers in parentheses are numbers of animals in each group.
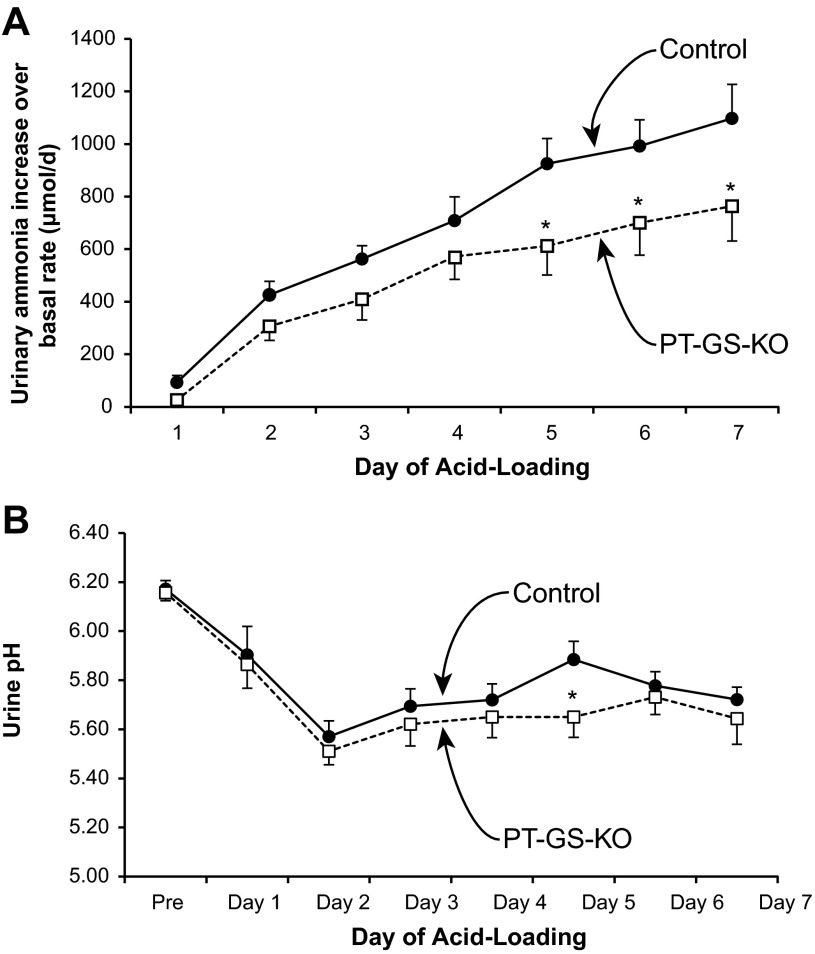
PT-GS-KO significantly altered acidosis-induced changes in urinary ammonia excretion. The increases in ammonia excretion, during days 5–7 of acid loading, were significantly less in mice with PT-GS-KO (Fig. 8). Throughout the course of acid loading, PT-GS-KO resulted in an ∼30% blunting of the increase in urinary ammonia excretion, although this blunting was statistically significant only on days 5–7. Thus, PT-GS-KO impairs the ability to maximally increase urinary ammonia excretion.
Fig. 8.
Urinary ammonia and pH response to metabolic acidosis. Top: change in urinary ammonia excretion in response to HCl-induced metabolic acidosis over basal excretion. During days 5–7 of acid loading, the increase in ammonia excretion was significantly less in mice with PT-GS-KO than in control mice. However, during the initial phase of acid loading, there was no significant difference in the increase in urinary ammonia excretion in mice with PT-GS-KO. Bottom: urine pH in response to HCl-induced metabolic acidosis. On almost all days of acid loading, with the exception of day 5, urinary pH did not differ significantly between control and PT-GS-KO mice. Values are means ± SE; n = 12 mice/genotype. *P < 0.05 vs. control mice.
Effect of GS deletion on urine pH during metabolic acidosis.
Changes in urinary pH can alter renal ammonia excretion, but this does not appear to explain the differences in urinary ammonia excretion after acid loading in PT-GS-KO mice. Specifically, urine pH did not differ significantly between PT-GS-KO and control mice during acid loading, with the sole exception of day 5 of acid loading when PT-GS-KO mice exhibited more acidic urine than did control mice (Fig. 8).
Effect of GS deletion on titratable acid excretion during metabolic acidosis.
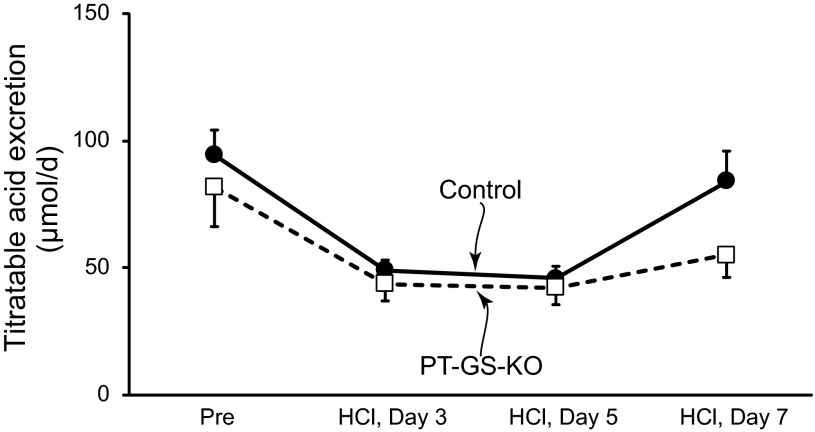
Titratable acid excretion is another important component of renal net acid excretion. Under basal conditions, PT-GS-KO did not alter titratable acid excretion, and during metabolic acidosis, there continued to be no significant effect of PT-GS-KO on titratable acid excretion (Fig. 9). Thus, the effect of GS deletion is specific for ammonia metabolism, and the observed differences in ammonia excretion are not the result of changes in titratable acid excretion.
Fig. 9.
Effect of PT-GS-KO on titratable acid excretion. Titratable acid excretion is a fundamental component of renal net acid excretion. Before acid loading, there was no significant difference in titratable acid excretion between mice with intact GS expression and those with PT-GS-KO. After acid loading, there continued to be no significant effect of PT-GS-KO on titratable acid excretion. n = 8–12 mice/genotype on each day.
GS expression during metabolic acidosis.
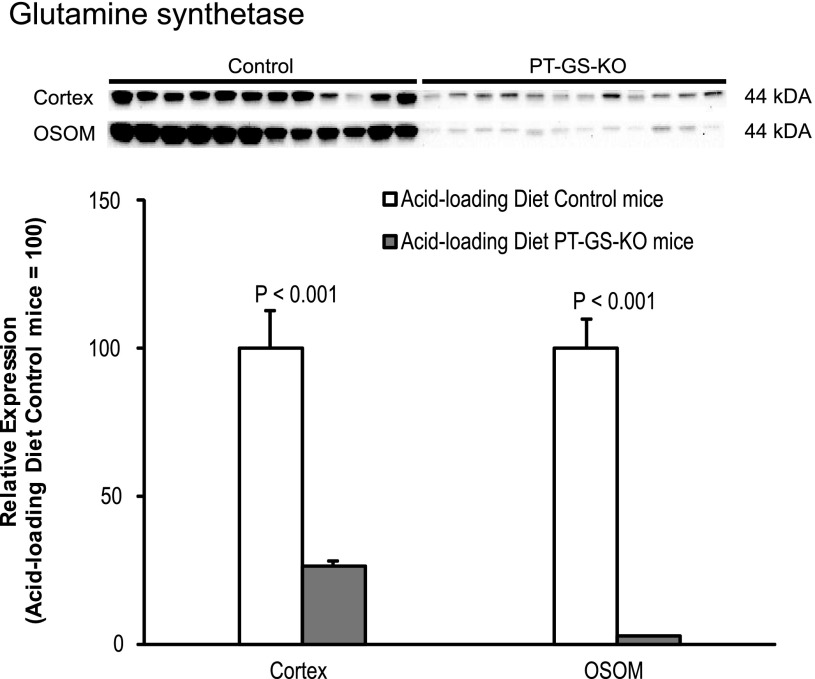
We (2, 34, 36), and others (6, 8, 22, 71) have shown that metabolic acidosis decreases renal GS expression. Because there was residual GS expression in PT-GS-KO mice on the control diet, we quantified GS expression after acid loading. In acid-loaded mice, PT-GS-KO mice had significantly less GS expression in both the cortex and outer stripe of the outer medulla (Fig. 10).
Fig. 10.
GS expression after acid loading. Top: GS protein expression by immunoblot analysis after acid loading. GS protein expression was significantly less in mice with PT-GS-KO compared with control mice in both the cortex and OSOM. Values are means ± SE; n = 12 mice/genotype.
Effect of PT-GS-KO on PDG, PEPCK, and SN1 expression during acid loading.
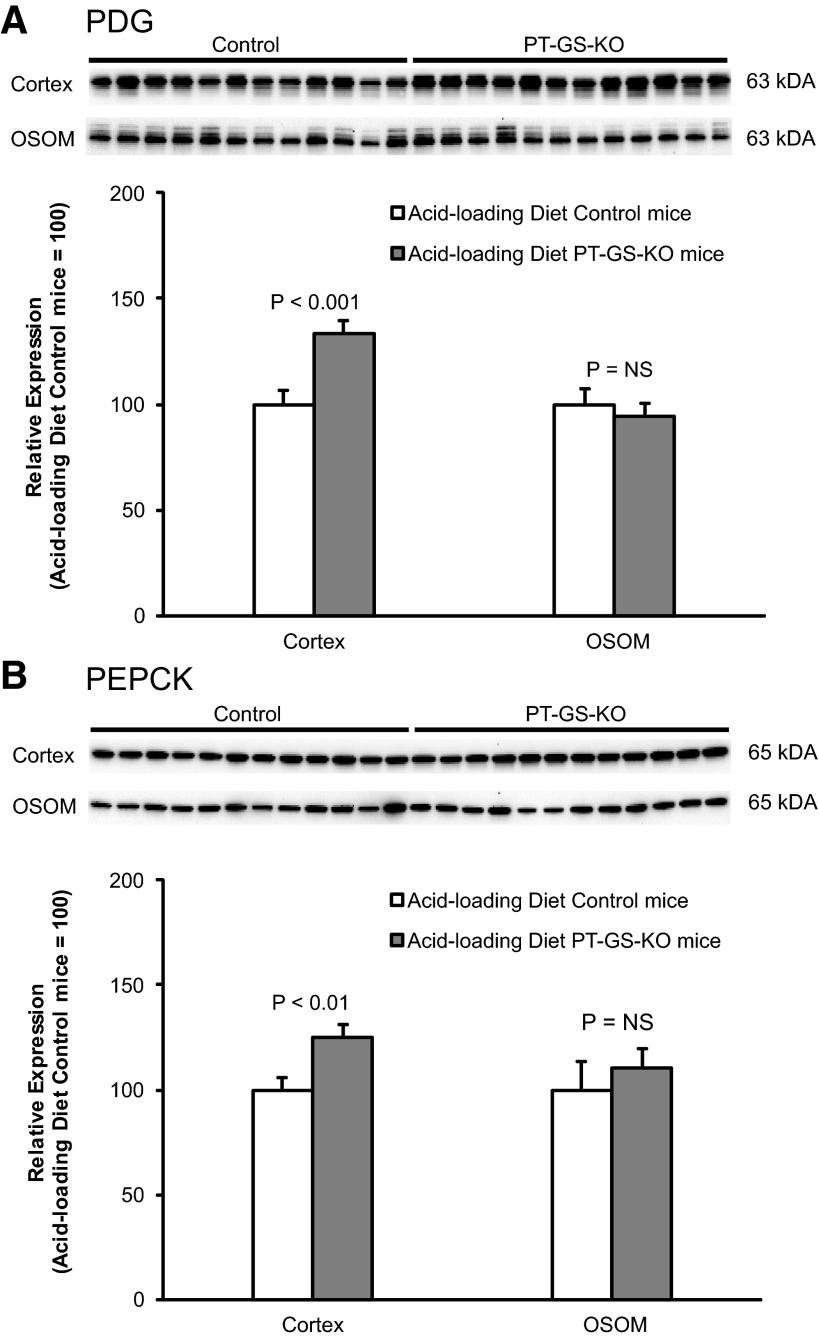
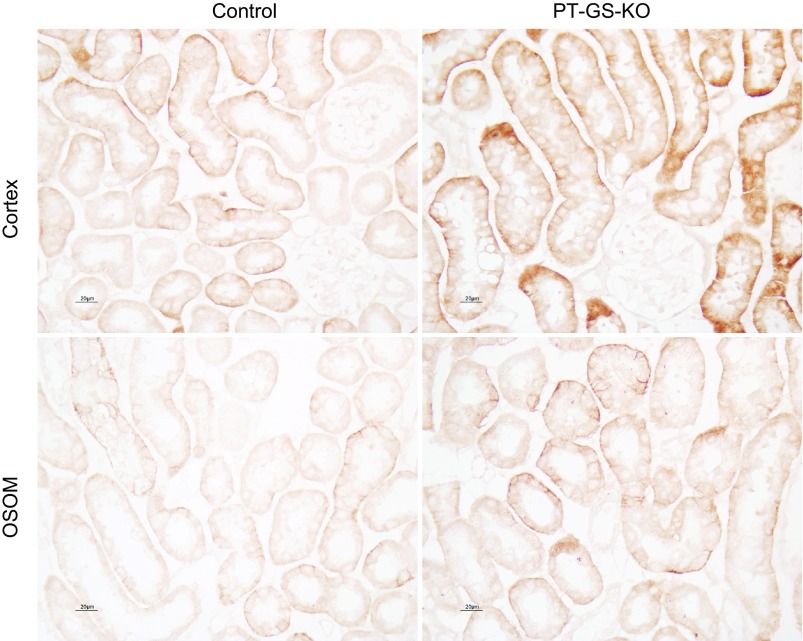
As previously noted, changes in the expression of proteins involved in ammonia generation typically parallel changes in ammonia excretion. Thus, we next examined whether the blunted ammonia excretion response in acid-loaded mice with PT-GS-KO resulted from decreased expression of proteins involved in ammonia generation. The normal response to metabolic acidosis involves increased PDG, PEPCK, and SN1 expression (7, 11, 48). In acid-loaded mice, PT-GS-KO resulted in significantly greater renal cortical PDG and PEPCK expression compared with control mice (Fig. 11), opposite the effect of PT-GS-KO on PDG and PEPCK expression in mice fed the normal diet. Similarly, during acid loading, there was increased expression of the glutamine transporter SN1 in PT-GS-KO mice compared with control mice (Fig. 12). Thus, the impaired ability to increase ammonia excretion during acid loading cannot be explained by decreased PDG, PEPCK, or SN1 expression but, instead, the expression of multiple proteins involved in ammonia generation (SN1, PDG, and PEPCK) increases to partially compensate for the compromised ability of PT-GS-KO mice to further suppress ammonia recycling.
Fig. 11.
Effect of PT-GS-KO on renal PDG and PEPCK expression in acid-loaded mice. Top: effects of PT-GS-KO on PDG expression by immunoblot analysis. In the cortex, PDG expression was significantly greater in PT-GS-KO mice than in control mice. Bottom: effects of PT-GS-KO on PEPCK expression. In the cortex, PEPCK expression was significantly greater in PT-GS-KO mice than in control mice. Values are means ± SE; n = 12 mice/genotype.
Fig. 12.
Effect of PT-GS-KO on expression of the glutamine transporter SN1 in acid-loaded mice. Top: SN1 immunolabel in acid-loaded control and PT-GS-KO mice in the cortex. Bottom: SN1 immunolabel in the OSOM. In both regions, SN1 immunolabel was more intense in acid-loaded PT-GS-KO mouse kidneys than in acid-loaded control mouse kidneys. Results are representative of findings of 6 mice/genotype.
Effect of PT-GS-KO on NBCe1 expression during acid loading.
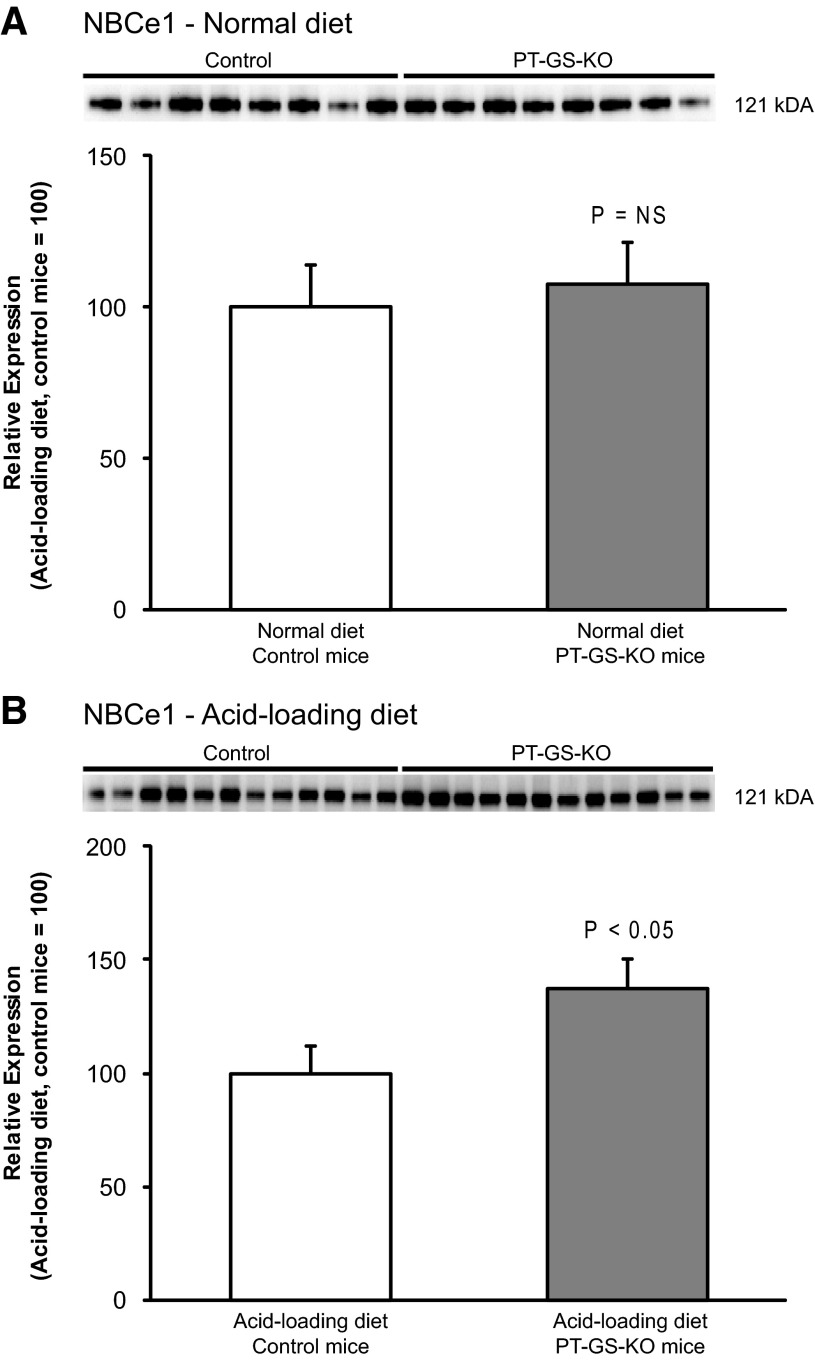
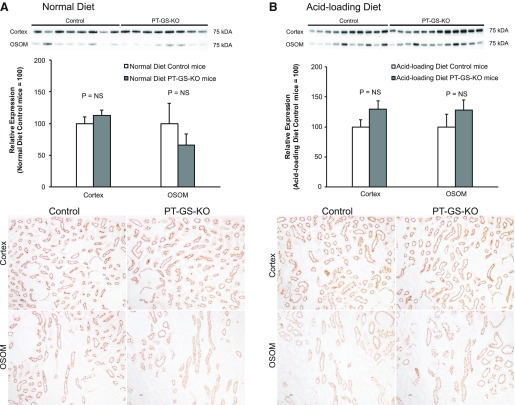
We have recently reported that NBCe1, a PT electrogenic Na+-coupled bicarbonate transporter, is necessary for normal PT ammonia metabolism (16). Although NBCe1 expression did not differ between PT-GS-KO and control mice fed a normal diet, in acid-loaded mice, PT-GS-KO significantly increased NBCe1 expression (Fig. 13). Because NBCe1 deletion decreases ammonia metabolism (16), increased expression in acid-loaded PT-GS-KO mice may stimulate ammonia metabolism. If so, this would be an additional adaptive response to increase ammonia excretion in acid-loaded PT-GS-KO mice.
Fig. 13.
Effect of PT-GS-KO on NBCe1 expression in mice fed normal and acid-loaded diets. Top: NBCe1 expression by immunoblot analysis did not differ significantly between control and PT-GS-KO mice fed a normal diet. Bottom: PT-GS-KO significantly increased NBCe1 expression by immunoblot analysis in acid-loaded mice. Values are means ± SE; n = 8 mice fed a normal diet and n = 12 mice fed an acid-loaded diet in each genotype.
Effect of GS deletion on NHE3 expression.
Apical NHE3 is believed to be an important mechanism of PT apical ammonia secretion (30, 42, 43). NHE3 expression was not altered significantly as a result of PT-GS-KO in either the cortex or outer stripe of the outer medulla either under basal conditions or after acid loading (Fig. 14). Changes in NHE3 expression do not appear to be an adaptive response to PT-GS-KO.
Fig. 14.
Effect of PT-GS-KO on Na+/H+ exchanger (NHE)3 expression. Top: NHE3 expression by immunoblot analysis did not differ significantly between control and PT-GS-KO mice fed either a normal diet (top left) or after acid loading (top right). Bottom: NHE3 expression by immunohistochemistry. There was no observable difference in NHE3 expression using light microscopic analysis as a result of PT-GS-KO when mice received either a normal diet (bottom left) or an acid-loaded diet (bottom right). Values are means ± SE; n = 8 mice fed a normal diet in each genotype and n = 10 control mice and n = 12 PT-GS-KO mice fed an acid-loaded diet.
DISCUSSION
The present study is the first to examine the effect of PT-GS-KO on basal acid-base homeostasis and on the response to metabolic acidosis. Under basal conditions, PT-GS-KO increased urinary ammonia excretion. This occurred despite decreased SN1 and outer medullary PDG expression, changes that by themselves would be expected to decrease ammoniagenesis and, hence, ammonia excretion. In response to acid loading, PT-GS-KO impaired the increase in renal ammonia excretion, and this occurred despite significantly increased SN1, PDG, PEPCK, and NBCe1 expression. These findings suggest that GS-mediated ammonia recycling is a critical component of both basal ammonia metabolism and the maximal response to metabolic acidosis.
The ability of the PEPCK promoter-Cre recombinase transgene to induce genetic recombination and GS deletion obviously varied along the length of the PT. In the proximal convoluted tubule, recombination rates were the lowest, whereas in the proximal straight tubule in the outer medulla, almost complete recombination was observed. This could reflect either differences in activation of the PEPCK promoter along the length of the PT or differences in access of Cre recombinase to the specific floxed sites in the DNA. PEPCK mRNA expression increases axially along the PT (9), suggesting segmental variations in PEPCK promoter activation may underlie this axial gradient in GS deletion. More importantly, the incomplete deletion produced was sufficient to identify a role for GS in both basal and acidosis-stimulated ammonia metabolism.
GS is expressed in a variety of other tissues, but the results in the present study cannot be explained by extrarenal GS deletion. Hepatocyte GS expression is unaltered in the PT-GS-KO mice used in the present study, and the cell-specific gene deletion approach used did not induce GS deletion in other tissues that express GS, including the skeletal muscle, white and brown fat, jejunum, and colon.
The first major finding in this report is that basal ammonia metabolism, in addition to the well-known components of ammonia generation and epithelial cell ammonia transport, also involves GS-mediated ammonia recycling. Specifically, GS deletion from PT cells increases basal ammonia excretion. This occurs despite no change in urine pH and despite decreased expression of both SN1 and PDG, key proteins involved in PT ammonia generation. Thus, under basal conditions, ammonia recycling via PT GS contributes to basal ammonia metabolism.
PT GS also appears to be necessary for the normal response to metabolic acidosis. Several previous studies, examining a variety of species and using a variety of models, have shown that metabolic acidosis decreases GS expression and activity (2, 6, 8, 22, 34, 36, 71). The present study shows that PT-GS-KO impairs the ability to increase urinary ammonia excretion. Thus, the ability to increase net ammonia generation involves both increased generation, through well-studied mechanisms involving multiple proteins involved in glutamine uptake and metabolic ammonia generation (7, 57, 66), and decreased intracellular ammnia recycling, occurring in the same cells, through GS. This ability to both generate and recycle ammonia in PT cells enables a regulated change in “net” ammonia generation that is quantitatively greater than the change that would occur solely through changes in ammonia generation.
The quantitative role of PT GS in the response to metabolic acidosis is difficult to determine. In mice with genetic knock down of PT GS, the increment in ammonia excretion caused by acid loading was decreased by ∼30% compared with mice with intact GS expression. This could suggest that at least ∼30% of the increase in net ammonia generation during acid loading of normal mice involves a decrease in ammonia recycling. However, SN1, PDG, and PEPCK expression were greater in acid-loaded PT-GS-KO mice compared with acid-loaded control mice; this would be expected to increase ammonia generation. In addition, our immunoblot analyses indicate that residual GS expression is decreased further in PT-GS-KO mice under acid-loading conditions, which also would be expected to contribute to net ammoniagenesis. Nonetheless, all of these adaptive mechanisms combined were insufficient to compensate for the loss of maximal capacity to downregulate GS and normalize ammonia excretion in response to acid loading. Thus, the degree of blunting of ammonia excretion observed in PT-GS-KO mice probably underestimates the actual contribution of decreased GS activity to net ammoniagenesis during acid loading in normal mice.
The present study also adds to information regarding the role of NBCe1 in acid-base homeostasis. NBCe1 has a critical role both in PT filtered bicarbonate reabsorption and in PT ammonia metabolism. The recognition of its role in ammonia metabolism is based on studies showing that NBCe1 deletion, despite causing metabolic acidosis (12, 16), decreases ammonia excretion and alters expression of multiple proteins involved in PT ammonia metabolism (16). In the present study, the increased NBCe1 expression in acid-loaded PT-GS-KO mice compared with control mice further suggests that NBCe1 either directly or indirectly promotes PT net ammonia generation.
Ammonia produced in the PT is secreted preferentially into the luminal fluid. Several studies have suggested that apical NHE3 is the primary mechanism of PT ammonia secretion (30, 42, 43). However, other studies have suggested that mechanisms other than NHE3 are important (51, 52), and a recent study showed that PT-specific NHE3 deletion did not alter either basal or acidosis-stimulated renal ammonia excretion (37). In the present study, PT-GS-KO did not significantly alter NHE3 expression, either under basal conditions or after acid loading. This lack of difference is consistent either with PT ammonia secretion occurring partly through NHE3-independent mechanisms or with either subcellular trafficking or phosphorylation/dephosphorylation regulating NHE3-dependent PT ammonia secretion.
GS is also expressed in renal epithelial cells other than the PT. In response to PT-GS-KO, OMCD in the outer stripe intercalated cell GS expression increased significantly. This observation of regulated intercalated cell GS expression is similar to our findings in hypokalemia (58) and further supports the concept that intercalated cells have regulated mechanisms of ammonia recycling and glutamine regeneration in addition to their well-known role in transcellular ammonia secretion.
GS deletion, despite increasing net ammonia excretion, did not cause a significant change in serum bicarbonate. This lack of change was not related to adaptive responses in titratable acid excretion. However, the increase in urinary ammonia excretion observed, ∼30 μmol/day, is ∼15% of typical daily net acid excretion by the mouse. A similar change in ammonia excretion was observed in mice with either global or collecting duct-specific Rhcg deletion and also did not alter serum bicarbonate (3, 31). Thus, changes of this magnitude of ammonia excretion are not sufficient to detectably alter serum bicarbonate.
In summary, the present study shows, using PT-GS-KO, that GS has an important role in ammonia metabolism both under basal conditions and in response to metabolic acidosis. Moreover, the role of GS is probably underestimated largely because of adaptive responses in other proteins involved in renal ammonia metabolism, which serve to compensate for the absence of GS-mediated ammonia recycling and glutamine generation. Thus, our understanding of the fundamental mechanisms of renal ammonia excretion and metabolism both under basal conditions and in response to metabolic acidosis needs to include three components: ammonia generation, renal epithelial cell ammonia transport and, as shown in the present study, ammonia recycling via GS expressed in the PT.
GRANTS
This work was supported by National Institute of Diabetes and Digestive and Kidney Diseases Grants R01-DK-045788 and R01-DK-107798 and Department of Veterans Affairs Grant 1I01BX000818.
DISCLOSURES
No conflicts of interest, financial or otherwise, are declared by the author(s).
AUTHOR CONTRIBUTIONS
H.-W.L., J.W.V., and I.D.W. conception and design of research; H.-W.L., G.O., and M.E.H. performed experiments; H.-W.L., G.O., M.E.H., J.W.V., and I.D.W. analyzed data; H.-W.L., G.O., M.E.H., J.W.V., and I.D.W. interpreted results of experiments; H.-W.L. and I.D.W. prepared figures; H.-W.L. and I.D.W. drafted manuscript; H.-W.L., G.O., M.E.H., W.H.L., F.A.C., J.W.V., and I.D.W. edited and revised manuscript; H.-W.L., G.O., M.E.H., W.H.L., F.A.C., J.W.V., and I.D.W. approved final version of manuscript.
ACKNOWLEDGMENTS
The authors thank Dr. Sharon W. Matthews and Tanisha Thomas of the University of Florida College of Medicine Electron Microscopy Core Facility for assistance with the light microscopic experiments. The authors also thank the dedicated staff of the University of Florida College of Medicine Transgenic Animal Facility for the excellent care of the transgenic animals used in this study.
Footnotes
Ammonia exists in two molecular forms: NH3 and NH4+. When referring specifically to the molecular form NH3, we state specifically “NH3.” When referring specifically to NH4+, we state specifically “NH4+.” In this report, we use the term “ammonia” to refer to the combination of both molecular forms.
REFERENCES
- 1.Bishop JM, Lee HW, Handlogten ME, Han KH, Verlander JW, Weiner ID. Intercalated cell-specific Rh B glycoprotein deletion diminishes renal ammonia excretion response to hypokalemia. Am J Physiol Renal Physiol 304: F422–F431, 2013. [DOI] [PMC free article] [PubMed] [Google Scholar]
- 2.Bishop JM, Verlander JW, Lee HW, Nelson RD, Weiner AJ, Handlogten ME, Weiner ID. Role of the Rhesus glycoprotein, Rh B Glycoprotein, in renal ammonia excretion. Am J Physiol Renal Physiol 299: F1065–F1077, 2010. [DOI] [PMC free article] [PubMed] [Google Scholar]
- 3.Biver S, Belge H, Bourgeois S, Van Vooren P, Nowik M, Scohy S, Houillier P, Szpirer J, Szpirer C, Wagner CA, Devuyst O, Marini AM. A role for Rhesus factor Rhcg in renal ammonium excretion and male fertility. Nature 456: 339–343, 2008. [DOI] [PubMed] [Google Scholar]
- 4.Boulland JL, Osen KK, Levy LM, Danbolt NC, Edwards RH, Storm-Mathisen J, Chaudhry FA. Cell-specific expression of the glutamine transporter SN1 suggests differences in dependence on the glutamine cycle. Eur J Neurosci 15: 1615–1631, 2002. [DOI] [PubMed] [Google Scholar]
- 5.Busque SM, Wagner CA. Potassium restriction, high protein intake, and metabolic acidosis increase expression of the glutamine transporter SNAT3 (Slc38a3) in mouse kidney. Am J Physiol Renal Physiol 297: F440–F450, 2009. [DOI] [PubMed] [Google Scholar]
- 6.Conjard A, Komaty O, Delage H, Boghossian M, Martin M, Ferrier B, Baverel G. Inhibition of glutamine synthetase in the mouse kidney: a novel mechanism of adaptation to metabolic acidosis. J Biol Chem 278: 38159–38166, 2003. [DOI] [PubMed] [Google Scholar]
- 7.Curthoys NP, Moe OW. Proximal tubule function and response to acidosis. Clin J Am Soc Nephrol 9: 1627–1638, 2013. [DOI] [PMC free article] [PubMed] [Google Scholar]
- 8.Damian AC, Pitts RF. Rates of glutaminase I and glutamine synthetase reactions in rat kidney in vivo. Am J Physiol 218: 1249–1255, 1970. [DOI] [PubMed] [Google Scholar]
- 9.Drewnowsk KD, Craig MR, DiGiovanni SR, McCarty JM, Moorman AF, Lamers WH, Schoolwerth AC. PEPCK mRNA localization in proximal tubule and gene regulation during metabolic acidosis. J Physiol Pharmacol 53: 3–20, 2002. [PubMed] [Google Scholar]
- 10.DuBose TD, Good DW, Hamm LL, Wall SM. Ammonium transport in the kidney: new physiological concepts and their clinical implications. J Am Soc Nephrol 1: 1193–1203, 1991. [DOI] [PubMed] [Google Scholar]
- 11.Freund DM, Prenni JE, Curthoys NP. Response of the mitochondrial proteome of rat renal proximal convoluted tubules to chronic metabolic acidosis. Am J Physiol Renal Physiol 304: F145–F155, 2013. [DOI] [PMC free article] [PubMed] [Google Scholar]
- 12.Gawenis LR, Bradford EM, Prasad V, Lorenz JN, Simpson JE, Clarke LL, Woo AL, Grisham C, Sanford LP, Doetschman T, Miller ML, Shull GE. Colonic anion secretory defects and metabolic acidosis in mice lacking the NBC1 cotransporter. J Biol Chem 282: 9042–9052, 2007. [DOI] [PubMed] [Google Scholar]
- 13.Gebhardt R, Burger HJ, Heini H, Schreiber KL, Mecke D. Alterations of hepatic enzyme levels and of the acinar distribution of glutamine synthetase in response to experimental liver injury in the rat. Hepatology 8: 822–830, 1988. [DOI] [PubMed] [Google Scholar]
- 14.Gebhardt R, Mecke D. Heterogeneous distribution of glutamine synthetase among rat liver parenchymal cells in situ and in primary culture. EMBO J 2: 567–570, 1983. [DOI] [PMC free article] [PubMed] [Google Scholar]
- 15.Giebisch G, Wang W. Potassium transport: from clearance to channels and pumps. Kidney Int 49: 1624–1631, 1996. [DOI] [PubMed] [Google Scholar]
- 16.Handlogten ME, Osis G, Lee HW, Romero MF, Verlander JW, Weiner ID. NBCe1 expression is required for normal renal ammonia metabolism. Am J Physiol Renal Physiol 309: F658–F666, 2015. [DOI] [PMC free article] [PubMed] [Google Scholar]
- 17.Hanson RW, Reshef L. Regulation of phosphoenolpyruvate carboxykinase (GTP) gene expression. Annu Rev Biochem 66: 581–611, 1997. [DOI] [PubMed] [Google Scholar]
- 18.Haussinger D. Regulation of hepatic ammonia metabolism: the intercellular glutamine cycle. Adv Enzyme Regul 25: 159–180, 1986. [DOI] [PubMed] [Google Scholar]
- 19.Haussinger D. Hepatic glutamine metabolism. Beitr Infusionther Klin Ernahr 17: 144–157, 1987. [PubMed] [Google Scholar]
- 20.He Y, Hakvoort TB, Köhler SE, Vermeulen JL, de Waart DR, de Theije C, ten Have GA, van Eijk HM, Kunne C, Labruyere WT, Houten SM, Sokolovic M, Ruijter JM, Deutz NEP, Lamers WH. Glutamine synthetase in muscle is required for glutamine production during fasting and extrahepatic ammonia detoxification. J Biol Chem 285: 9516–9524, 2010. [DOI] [PMC free article] [PubMed] [Google Scholar]
- 21.He Y, Hakvoort TB, Vermeulen JL, Labruyère WT, de Waart DR, Van Der Hel WS, Ruijter JM, Uylings HB, Lamers WH. Glutamine synthetase deficiency in murine astrocytes results in neonatal death. Glia 58: 741–754, 2010. [DOI] [PubMed] [Google Scholar]
- 22.Hems DA. Metabolism of glutamine and glutamic acid by isolated perfused kidneys of normal and acidotic rats. Biochem J 130: 671–680, 1972. [DOI] [PMC free article] [PubMed] [Google Scholar]
- 23.Hossain SA, Chaudhry FA, Zahedi K, Siddiqui F, Amlal H. Cellular and molecular basis of increased ammoniagenesis in potassium deprivation. Am J Physiol Renal Physiol 301: F969–F978, 2011. [DOI] [PubMed] [Google Scholar]
- 24.Huang Y, Zhao L, Jia B, Wu L, Li Y, Curthoys N, Zheng JC. Glutaminase dysregulation in HIV-1-infected human microglia mediates neurotoxicity: relevant to HIV-1 associated neurocognitive disorders. J Neurosci 31: 15195–15204, 2011. [DOI] [PMC free article] [PubMed] [Google Scholar]
- 25.Karim Z, Attmane-Elakeb A, Bichara M. Renal handling of NH4+ in relation to the control of acid-base balance by the kidney. J Nephrol 15, Suppl 5: S128–S134, 2002. [PubMed] [Google Scholar]
- 26.Karinch AM, Lin CM, Wolfgang CL, Pan M, Souba WW. Regulation of expression of the SN1 transporter during renal adaptation to chronic metabolic acidosis in rats. Am J Physiol Renal Physiol 283: F1011–F1019, 2002. [DOI] [PubMed] [Google Scholar]
- 27.Kim HY, Verlander JW, Bishop JM, Cain BD, Han KH, Igarashi P, Lee HW, Handlogten ME, Weiner ID. Basolateral expression of the ammonia transporter family member, Rh C Glycoprotein, in the mouse kidney. Am J Physiol Renal Physiol 296: F545–F555, 2009. [DOI] [PMC free article] [PubMed] [Google Scholar]
- 28.Knepper MA. NH4+ transport in the kidney. Kidney Int 40: S95–S102, 1991. [PubMed] [Google Scholar]
- 29.Koeppen BM. The kidney and acid-base regulation. Adv Physiol Educ 33: 275–281, 2009. [DOI] [PubMed] [Google Scholar]
- 30.Laghmani K, Preisig PA, Moe OW, Yanagisawa M, Alpern RJ. Endothelin-1/endothelin-B receptor-mediated increases in NHE3 activity in chronic metabolic acidosis. J Clin Invest 107: 1563–1569, 2001. [DOI] [PMC free article] [PubMed] [Google Scholar]
- 31.Lee HW, Verlander JW, Bishop JM, Igarashi P, Handlogten ME, Weiner ID. Collecting duct-specific Rh C glycoprotein deletion alters basal and acidosis-stimulated renal ammonia excretion. Am J Physiol Renal Physiol 296: F1364–F1375, 2009. [DOI] [PMC free article] [PubMed] [Google Scholar]
- 32.Lee HW, Verlander JW, Handlogten ME, Han KH, Cooke PS, Weiner ID. Expression of the Rhesus glycoprotein, ammonia transporter family members, Rhcg and Rhbg, in male reproductive organs. J Reprod Fertil 146: 283–296, 2013. [DOI] [PMC free article] [PubMed] [Google Scholar]
- 33.Lee HW, Osis G, Handlogten ME, Guo H, Verlander JW, Weiner ID. Effect of dietary protein restriction on renal ammonia metabolism. Am J Physiol Renal Physiol 308: F1463–F1473, 2015. [DOI] [PMC free article] [PubMed] [Google Scholar]
- 34.Lee HW, Verlander JW, Bishop JM, Nelson RD, Handlogten ME, Weiner ID. Effect of intercalated cell-specific Rh C glycoprotein deletion on basal and metabolic acidosis-stimulated renal ammonia excretion. Am J Physiol Renal Physiol 299: F369–F379, 2010. [DOI] [PMC free article] [PubMed] [Google Scholar]
- 35.Lee HW, Verlander JW, Bishop JM, Handlogten ME, Han KH, Weiner ID. Renal ammonia excretion in response to hypokalemia: effects of collecting duct-specific Rh C glycoprotein deletion. Am J Physiol Renal Physiol 304: F410–F421, 2013. [DOI] [PMC free article] [PubMed] [Google Scholar]
- 36.Lee HW, Verlander JW, Handlogten ME, Han KH, Weiner ID. Effect of collecting duct-specific deletion of both Rh B glycoprotein (Rhbg) and Rh C glycoprotein (Rhcg) on renal response to metabolic acidosis. Am J Physiol Renal Physiol 306: F389–F400, 2014. [DOI] [PMC free article] [PubMed] [Google Scholar]
- 37.Li HC, Du Z, Barone S, Rubera I, McDonough AA, Tauc M, Zahedi K, Wang T, Soleimani M. Proximal tubule specific knockout of the Na+/H+ exchanger NHE3: effects on bicarbonate absorption and ammonium excretion. J Mol Med 91: 951–963, 2013. [DOI] [PMC free article] [PubMed] [Google Scholar]
- 38.McKinney TD, Burg MB. Bicarbonate transport by rabbit cortical collecting tubules. Effect of acid and alkali loads in vivo on transport in vitro. J Clin Invest 60: 766–768, 1977. [DOI] [PMC free article] [PubMed] [Google Scholar]
- 39.McKinney TD, Burg MB. Bicarbonate absorption by rabbit cortical collecting tubules in vitro. Am J Physiol Renal Fluid Electrolyte Physiol 234: F141–F145, 1978. [DOI] [PubMed] [Google Scholar]
- 40.McKinney TD, Burg MB. Bicarbonate secretion by rabbit cortical collecting tubules in vitro. J Clin Invest 61: 1421–1427, 1978. [DOI] [PMC free article] [PubMed] [Google Scholar]
- 41.Moret C, Dave MH, Schulz N, Jiang JX, Verrey F, Wagner CA. Regulation of renal amino acid transporters during metabolic acidosis. Am J Physiol Renal Physiol 292: F555–F566, 2007. [DOI] [PubMed] [Google Scholar]
- 42.Nagami GT. Luminal secretion of ammonia in the mouse proximal tubule perfused in vitro. J Clin Invest 81: 159–164, 1988. [DOI] [PMC free article] [PubMed] [Google Scholar]
- 43.Nagami GT. Role of angiotensin II in the enhancement of ammonia production and secretion by the proximal tubule in metabolic acidosis. Am J Physiol Renal Physiol 294: F874–F880, 2008. [DOI] [PubMed] [Google Scholar]
- 44.Nowik M, Lecca MR, Velic A, Rehrauer H, Brandli AW, Wagner CA. Genome-wide gene expression profiling reveals renal genes regulated during metabolic acidosis. Physiol Genomics 32: 322–334, 2008. [DOI] [PubMed] [Google Scholar]
- 45.Patel YM, Yun JS, Liu J, McGrane MM, Hanson RW. An analysis of regulatory elements in the phosphoenolpyruvate carboxykinase (GTP) gene which are responsible for its tissue-specific expression and metabolic control in transgenic mice. J Biol Chem 269: 5619–5628, 1994. [PubMed] [Google Scholar]
- 46.Purich DL. Advances in the enzymology of glutamine synthesis. Adv Enzymol Relat Areas Mol Biol 72: 9–42, 1998. [DOI] [PubMed] [Google Scholar]
- 47.Rankin EB, Tomaszewski JE, Haase VH. Renal cyst development in mice with conditional inactivation of the von Hippel-Lindau tumor suppressor. Cancer Res 66: 2576–2583, 2006. [DOI] [PMC free article] [PubMed] [Google Scholar]
- 48.Schauer KL, Freund DM, Prenni JE, Curthoys NP. Proteomic profiling and pathway analysis of the response of rat renal proximal convoluted tubules to metabolic acidosis. Am J Physiol Renal Physiol 305: F628–F640, 2013. [DOI] [PMC free article] [PubMed] [Google Scholar]
- 49.Seshadri RM, Klein JD, Kozlowski S, Sands JM, Kim YH, Handlogten ME, Verlander JW, Weiner ID. Renal expression of the ammonia transporters, Rhbg and Rhcg, in response to chronic metabolic acidosis. Am J Physiol Renal Physiol 290: F397–F408, 2006. [DOI] [PubMed] [Google Scholar]
- 50.Seshadri RM, Klein JD, Smith T, Sands JM, Handlogten ME, Verlander JW, Weiner ID. Changes in the subcellular distribution of the ammonia transporter Rhcg, in response to chronic metabolic acidosis. Am J Physiol Renal Physiol 290: F1443–F1452, 2006. [DOI] [PubMed] [Google Scholar]
- 51.Simon EE, Merli C, Herndon J, Cragoe EJ Jr, Hamm LL. Determinants of ammonia entry along the rat proximal tubule during chronic metabolic acidosis. Am J Physiol Renal Fluid Electrolyte Physiol 256: F1104–F1110, 1989. [DOI] [PubMed] [Google Scholar]
- 52.Simon EE, Merli C, Herndon J, Cragoe EJ Jr, Hamm LL. Effects of barium and 5-(N-ethyl-N-isopropyl)-amiloride on proximal tubule ammonia transport. Am J Physiol Renal Fluid Electrolyte Physiol 262: F36–F39, 1992. [DOI] [PubMed] [Google Scholar]
- 53.Smith DD Jr, Campbell JW. Distribution of glutamine synthetase and carbamoyl-phosphate synthetase I in vertebrate liver. Proc Natl Acad Sci USA 85: 160–164, 1988. [DOI] [PMC free article] [PubMed] [Google Scholar]
- 54.Solbu TT, Boulland JL, Zahid W, Lyamouri Bredahl MK, miry-Moghaddam M, Storm-Mathisen J, Roberg BA, Chaudhry FA. Induction and targeting of the glutamine transporter SN1 to the basolateral membranes of cortical kidney tubule cells during chronic metabolic acidosis suggest a role in pH regulation. J Am Soc Nephrol 16: 869–877, 2005. [DOI] [PubMed] [Google Scholar]
- 55.Tannen RL. Ammonia and acid-base homeostasis. Med Clin North Am 67: 781–798, 1983. [DOI] [PubMed] [Google Scholar]
- 56.Tannen RL, Sahai A. Biochemical pathways and modulators of renal ammoniagenesis. Miner Electrolyte Metab 16: 249–258, 1990. [PubMed] [Google Scholar]
- 57.Taylor L, Curthoys NP. Glutamine metabolism: role in acid-base balance. Biochem Mol Biol Educ 32: 291–304, 2004. [DOI] [PubMed] [Google Scholar]
- 58.Verlander JW, Chu D, Lee HW, Handlogten ME, Weiner ID. Expression of glutamine synthetase in the mouse kidney: localization in multiple epithelial cell types and differential regulation by hypokalemia. Am J Physiol Renal Physiol 305: F701–F713, 2013. [DOI] [PMC free article] [PubMed] [Google Scholar]
- 59.Wagner CA. Metabolic acidosis: new insights from mouse models. Curr Opin Nephrol Hypertens 16: 471–476, 2007. [DOI] [PubMed] [Google Scholar]
- 60.Weiner ID, Hamm LL. Molecular mechanisms of renal ammonia transport. Annu Rev Physiol 69: 317–340, 2007. [DOI] [PMC free article] [PubMed] [Google Scholar]
- 61.Weiner ID, Miller RT, Verlander JW. Localization of the ammonium transporters, Rh B glycoprotein and Rh C glycoprotein in the mouse liver. Gastroenterology 124: 1432–1440, 2003. [DOI] [PubMed] [Google Scholar]
- 62.Weiner ID, Mitch WE, Sands JM. Urea and ammonia metabolism and the control of renal nitrogen excretion. Clin J Am Soc Nephrol 10: 1444–1458, 2014. [DOI] [PMC free article] [PubMed] [Google Scholar]
- 63.Weiner ID, Verlander JW. Role of NH3 and NH4+ transporters in renal acid-base transport. Am J Physiol Renal Physiol 300: F11–F23, 2011. [DOI] [PMC free article] [PubMed] [Google Scholar]
- 64.Weiner ID, Verlander JW. Renal acidification mechanisms. In: Brenner and Rector's The Kidney, edited by Taal M, Chertow GM, Marsden PA, Skorecki K, Yu AS, Brenner BM. Philadelphia, PA: Elsevier Saunders, 2012, p. 293–325. [Google Scholar]
- 65.Weiner ID, Verlander JW. Molecular physiology of the Rh ammonia transport proteins. Curr Opin Nephrol Hypertens 19: 471–477, 2010. [DOI] [PMC free article] [PubMed] [Google Scholar]
- 66.Weiner ID, Verlander JW. Renal ammonia metabolism and transport. Compr Physiol 3: 201–220, 2013. [DOI] [PMC free article] [PubMed] [Google Scholar]
- 67.Weiner ID, Verlander JW. Ammonia transport in the kidney by Rhesus glycoproteins. Am J Physiol Renal Physiol 306: F1107–F1120, 2014. [DOI] [PMC free article] [PubMed] [Google Scholar]
- 68.Wingo CS. Effect of ouabain on K secretion in cortical collecting tubules from adrenalectomized rabbits. Am J Physiol Renal Fluid Electrolyte Physiol 247: F588–F595, 1984. [DOI] [PubMed] [Google Scholar]
- 69.Wingo CS. Cortical collecting tubule potassium secretion: effect of amiloride, ouabain, and luminal sodium concentration. Kidney Int 27: 886–891, 1985. [DOI] [PubMed] [Google Scholar]
- 70.Wingo CS. Active proton secretion and potassium absorption in the rabbit outer medullary collecting duct. Functional evidence for proton-potassium-activated adenosine triphosphatase. J Clin Invest 84: 361–365, 1989. [DOI] [PMC free article] [PubMed] [Google Scholar]
- 71.Xue Y, Liao SF, Son KW, Greenwood SL, McBride BW, Boling JA, Matthews JC. Metabolic acidosis in sheep alters expression of renal and skeletal muscle amino acid enzymes and transporters. J Anim Sci 88: 707–717, 2010. [DOI] [PubMed] [Google Scholar]


