

Abstract
Although MRI is the gold standard for the diagnosis and monitoring of multiple sclerosis (MS), current conventional MRI techniques often fail to detect cortical alterations and provide little information about gliosis, axonal damage and myelin status of lesioned areas. Diffusion tensor imaging (DTI) and diffusion kurtosis imaging (DKI) provide sensitive and complementary measures of the neural tissue microstructure. Additionally, specific white matter tract integrity (WMTI) metrics modelling the diffusion in white matter were recently derived. In the current study we used the well-characterized cuprizone mouse model of central nervous system demyelination to assess the temporal evolution of diffusion tensor (DT), diffusion kurtosis tensor (DK) and WMTI-derived metrics following acute inflammatory demyelination and spontaneous remyelination.
While DT-derived metrics were unable to detect cuprizone induced cortical alterations, the mean kurtosis (MK) and radial kurtosis (RK) were found decreased under cuprizone administration, as compared to age-matched controls, in both the motor and somatosensory cortices. The MK remained decreased in the motor cortices at the end of the recovery period, reflecting long lasting impairment of myelination.
In white matter, DT, DK and WMTI-derived metrics enabled the detection of cuprizone induced changes differentially according to the stage and the severity of the lesion. More specifically, MK, RK and the axonal water fraction (AWF) were the most sensitive for the detection of cuprizone induced changes in the genu of the corpus callosum, a region less affected by cuprizone administration. Additionally, microgliosis was associated with an increase of MK and RK during the acute inflammatory demyelination phase. In regions undergoing severe demyelination, namely the body and splenium of the corpus callosum, DT-derived metrics, notably the mean diffusion (MD) and radial diffusion (RD), were among the best discriminators between cuprizone and control groups, hence highlighting their ability to detect both acute and long lasting changes. Interestingly, WMTI-derived metrics showed the aptitude to distinguish between the different stage of the disease. Both the intra-axonal diffusivity (Da) and the AWF were found to be decreased in the cuprizone treated group, Da specifically decreased during the acute inflammatory demyelinating phase whereas the AWF decrease was associated to the spontaneous remyelination and the recovery period.
Altogether our results demonstrate that DKI is sensitive to alterations of cortical areas and provides, along with WMTI metrics, information that is complementary to DT-derived metrics for the characterization of demyelination in both white and grey matter and subsequent inflammatory processes associated with a demyelinating event.
Keywords: Diffusion, kurtosis, white matter, grey matter, cuprizone, demyelination
1. INTRODUCTION
For the past decade, diffusion tensor imaging (DTI) has been widely applied to evaluate the brain structural organization and white matter integrity in health and pathological conditions (Alexander et al., 2007; Basser and Jones, 2002; Beaulieu, 2002; Horsfield and Jones, 2002; Le Bihan et al., 2001). Diffusion tensor (DT) derived metrics have revealed alterations in lesioned tissue following a demyelinating insult as well as in normal appearing white matter (NAWM) in patients suffering from multiple sclerosis (MS) (Fox et al., 2011; Giorgio et al., 2010; Roosendaal et al., 2009; Sbardella et al., 2013). MS is an autoimmune disease characterized by demyelination and inflammation of the neural tissue in both white and grey matter (Calabrese et al., 2013; Kutzelnigg et al., 2005). Recent studies have highlighted the association of cortical MS lesions with physical and cognitive disabilities, however, magnetic resonance imaging (MRI) of grey matter remains challenging, and to date, the vast majority of cortical lesions cannot be detected by non-invasive means (Honce, 2013; Kutzelnigg and Lassmann, 2005; Lucchinetti et al., 2011).
An important limitation of DTI is the assumption that diffusion occurs in an unrestricted environment with a Gaussian distribution of the diffusion displacement (Basser, 1995; Basser and Pierpaoli, 1996). However, in biological tissue, the presence of cellular barriers, compartmentalization and complex water exchange restrict and hamper water diffusion. Diffusion kurtosis imaging (DKI), an extension of DTI, provides additional diffusion kurtosis tensor (DK) derived metrics, which quantify the deviation of the water diffusion displacement profile from the Gaussian distribution. Hence DK metrics estimate the degree of diffusion restriction, which is related to tissue complexity in both white and grey matter (Hui et al., 2008; Jensen and Helpern, 2010; Jensen et al., 2005; Wu and Cheung, 2010). Sensitivity of DKI to detect microstructural alterations has been demonstrated in normal developing (Paydar et al., 2014) and aging humans (Coutu et al., 2014; Falangola et al., 2008) and patients suffering from several neurological disorders including MS and other demyelinating diseases (Bester et al., 2014; Kimura et al., 2014; Raz et al., 2013; Yoshida et al., 2013).
The combined use of DTI and DKI has acknowledged the increased sensitivity of DKI over DTI parameters, and emphasized the complementary information provided by DK metrics in assessing microstructural changes (Blockx et al., 2012a; Blockx et al., 2012b; Cheung et al., 2012; Delgado y Palacios et al., 2011; Delgado y Palacios et al., 2014; Umesh Rudrapatna et al., 2014; Vanhoutte et al., 2013; Veraart et al., 2011; Zhu et al., 2015; Zhuo et al., 2012). In addition, white matter tract integrity (WMTI) metrics that model the diffusion in white matter by two non-exchanging compartments have been recently introduced that can be extracted from DKI measures in white matter, and aim to provide more specific information about axonal integrity and extra-axonal surroundings (Fieremans et al., 2011). These WMTI metrics led to an improved clinical stroke assessment (Hui et al., 2012); enabled to distinguish patients with mild cognitive impairment from healthy controls (Fieremans et al., 2013); further characterized the regional course of white matter changes in AD (Benitez et al., 2014); and enhanced the detection of white matter morphological changes in chronically demyelinated lesions (Falangola et al., 2014). Furthermore, specific WMTI metrics have been shown to be sensitive to changes due to myelination during early development (Jelescu et al., 2015) and to correlate with N-acetyl-aspartate levels in subjects with mild traumatic brain injury (Grossman et al., 2015).
In this study we used the cuprizone mouse model, a well-established and extensively described toxic model of central nervous system (CNS) demyelination and spontaneous remyelination (Gudi et al., 2014; Hiremath et al., 1998; Kipp et al., 2009; Matsushima and Morell, 2001; Skripuletz et al., 2011). More specifically, cuprizone is a copper chelator, whose administration induces metabolic disturbances, oxidative stress and eventually leads to oligodendrocytes apoptosis and demyelination (Benardais et al., 2013; Mason et al., 2000). Both demyelination and remyelination phases are accompanied by an inflammatory response characterized by the infiltration and proliferation of microglia and macrophages and astrogliosis (Hibbits et al., 2012; Hiremath et al., 1998; Remington et al., 2007). Remarkable features of the cuprizone model include a distinct temporal pattern of demyelination in white and grey matter (Gudi et al., 2009; Skripuletz et al., 2008; Wergeland et al., 2012) as well as the presence of regional differences within the main CNS white matter tract, i.e. the corpus callosum, thereby allowing the study of several degrees of demyelination and inflammation within the same individual (Steelman et al., 2012; Wu et al., 2008; Xie et al., 2010). For a recent in-depth review covering all aspects of the cuprizone model we refer to (Praet et al., 2014).
In the present work, we examined the temporal changes of diffusion metrics following acute cuprizone induced inflammation, demyelination and subsequent remyelination. We evaluated the sensitivity of in vivo DKI measurements for the non-invasive detection of cortical grey matter and white matter modifications induced by cuprizone administration. For this, we performed a series of DKI measurements at key time points for white matter inflammation and demyelination (3 weeks of cuprizone administration), cortical demyelination (6 weeks of cuprizone administration) and remyelination (6 weeks of cuprizone administration followed by 6 weeks recovery period). Observed changes were further validated by histology.
2. MATERIALS AND METHODS
2.1. Cuprizone mouse model and experimental outline
Female C57/BL6J mice were obtained via Charles River Laboratories (L’Arbresle cedex, France). Mice (n = 20), eight weeks of age, had ad libitum access to standard rodent lab chow mixed with 0.2% w/w cuprizone (bis(cyclohexanone)oxaldihydrazone, Sigma-Aldrich, Germany) for six weeks to induce inflammation and demyelination in the CNS. Following a six week 0.2% w/w cuprizone diet, mice were allowed to recover for six weeks with ad libitum access to standard rodent lab chow. Control mice, eight weeks of age (n = 19), had ad libitum access to standard rodent lab chow during the whole study period.
Mice were imaged at eight weeks of age, prior to cuprizone administration (n = 24), after three weeks of cuprizone administration (n = 10 cuprizone, n = 11 control), after six weeks of cuprizone administration (n = 7 cuprizone, n = 7 control) and after six weeks of cuprizone supplemented diet followed by six weeks of recovery (n = 11 cuprizone, n = 8 control) (Supplementary figure 1 a). A subset of mice underwent all four scanning sessions (n = 7 cuprizone, n = 6 control). For histological purposes a subset of mice was sacrificed at each time point and an additional group of mice that did not undergo the MRI procedure was added in order to perform quantitative immunofluorescence analysis. Experimental procedures for each mouse is described in the supplementary table 1. All experimental procedures were approved by the Ethics Committee for Animal Experiments of the University of Antwerp (approval no. 2011/13).
2.2. Magnetic resonance imaging acquisition
In vivo imaging experiments were conducted on a 9.4T Bruker Biospec system (Biospec 94/20 USR, Bruker Biospin, Germany) using a standard Bruker cross coil setup, with a quadrature volume coil for excitation and quadrature mouse surface coil for signal detection. During imaging, mice were anaesthetized using 1.5–2% isoflurane (Isoflo®, Abbot Laboratories Ltd., USA). Respiratory rate was continuously monitored and body temperature was measured and maintained constant at 37±0.3 °C using a feedback coupled warm air system (MR compatible Small Animal Monitoring and Gating System, SA instruments, Inc., USA).
Axial T2-weighted Fast Spin Echo images were obtained (30 slices, slice thickness = 0.4 mm, matrix = (256 × 256), FOV = (19.2 × 12.8) mm2, spatial resolution: (75 × 50 ×400) μm3 TR = 5000 ms, effective TE = 24.32 ms, echo train = 2, acquisition time = 8 minutes). The DKI protocol included the acquisition of seven non-diffusion weighted (DW) images and 210 DW images with the use of seven b -values (400, 800, 1200, 1600, 2000, 2400, and 2800 s/mm2) and 30 non-collinear diffusion gradient directions. Images were collected with a multislice two-shot DW-SE-EPI sequence (30 slices, repetition time/echo time = 7500/24 ms, δ = 5 ms, Δ = 12 ms, acquisition matrix = (96 ×64), zero filled to (128 ×64), spatial resolution: (150 ×200 ×500) μm3, NEX = 4, total acquisition time = 3 hours and 37 minutes).
2.3. Post-processing of MR images
The DKI signal representation [eq. 1]:
| [1] |
with S(0) the signal intensity without diffusion weighting, D the rank 2 diffusion tensor (DT), W the rank 4 kurtosis diffusion tensor (KT), and g the diffusion gradient direction, was voxel-wise fitted to the DWIs. The DKI tensors (DT and KT) quantify the apparent diffusion coefficient and the deviation from Gaussian diffusion, respectively (Jensen et al., 2005) (Veraart et al., 2011). Both tensors were simultaneously estimated using the conditional least squares estimators, while imposing positivity on the kurtosis coefficients (Veraart et al., 2013), after correcting the data for motion and eddy current correction using functional magnetic resonance imaging of the brain (FMRIB) software library (FSL).
The conditional least squares estimator explicitly accounts for the Rician MR data distribution, for which the noise level has been estimated from the background (den Dekker and Sijbers, 2014). Diffusion tensor and diffusion kurtosis parametric maps (axial (AD), radial (RD) and mean diffusivity (MD), fractional anisotropy (FA) and axial (AK), radial (RK) and mean kurtosis (MK)) were computed (Matlab, The Mathworks Inc., USA) as described before (Poot et al., 2010; Veraart et al., 2011).
Fieremans et al (Fieremans et al., 2011) recently adopted a two-compartment model to characterize the non-Gaussian diffusion in white matter bundles where axons are arranged in a parallel manner, in terms of compartment specific WMTI metrics that can represent diffusion tensor and kurtosis in biologically meaningful terms. Those WMTI metrics include: axonal water fraction (AWF), intra-axonal diffusivity (Da), axial diffusivity of extra-axonal space (De,‖), radial diffusivity of extra-axonal space (De,⊥) and tortuosity of extra-axonal space (α), (see (Fieremans et al., 2011) and figure 1 of (Grossman et al., 2015) for a detailed description).
Regions of interest (ROI) were manually delineated based on the contrast of fractional anisotropy maps, according to the Franklin and Paxinos anatomical mouse brain atlas (Franklin and Paxinos, 1997)with AMIRA software (Mercury Computer systems, San Diego, USA) as depicted in figure 1 a. It has been previously reported that cuprizone induces variable degree of demyelination and inflammation in the corpus callosum (Steelman et al., 2012); for this reason we divided the corpus callosum in three parts, which comprise the splenium, body and genu. Severe cortical demyelination and astrogliosis have been demonstrated by histological analyses after cuprizone intoxication (Buschmann et al., 2012; Skripuletz et al., 2008; Wergeland et al., 2012), therefore we also delineated two distinct cortical ROIs, namely the motor cortices and the somatosensory cortices. Averaged diffusion coefficient and diffusion kurtosis metrics were obtained for the splenium, body, genu, motor and somatosensory cortices. WMTI metrics were calculated for the splenium, body and genu. Representative DTI, DKI and WMTI maps for control and cuprizone treated mice are shown in figure 1 b. In a similar manner as for diffusion MRI, ROIs were manually delineated on T2-weighted images and regional average signal were normalized to the mean cerebral spinal fluid (CSF) signal of the third ventricle. ROIs include the splenium, body, genu of the corpus callosum and the motor and somatosensory cortices.
Figure 1. Illustration of ROIs delineation and representative DTI, DKI and WMTI parametric maps.

Section (a) depicts the delineations performed on a FA map from a representative control mouse at the level of the genu (red), body (yellow), splenium (orange) of the corpus callosum and the motor (light blue) and somatosensory (dark blue) cortices.
DTI, DKI and WMTI parametric maps are shown on section (b) for a representative control mouse and a mouse that received 0.2 % cuprizone supplemented diet for a period of 3 weeks. DT-derived maps are shown for the mean diffusion (MD), radial diffusion (RD) and axial diffusion (AD), (Left panel, CONTROL, 1st row, CUPRIZONE, 2nd row). In a similar manner, DK-derived maps are shown for the mean kurtosis (MK), radial kurtosis (RK) and axial kurtosis (AK), (Left panel, CONTROL, 3rd row, CUPRIZONE, 4th row). WMTI-derived maps are displayed for the splenium of the corpus callosum ROI, as overlays on the FA map, for the axonal water fraction (AWF), the intra-axonal diffusivity (Da), (Right panel, CONTROL, 1st row, CUPRIZONE, 2nd row) and for the radial (De,⊥) and axial (De,‖) diffusivity of the extra-axonal space (Right panel, CONTROL, 3rd row, CUPRIZONE, 4th row).
2.4. Histological analyses and quantification
Histological analyses were performed according to previously optimized procedures (Guglielmetti et al., 2014; Orije et al., 2015). Mice were deeply anesthetized via an intraperitoneal injection pentobarbital (60 mg/kg, Nembutal, Ceva Sante Animale) and transcardially perfused with ice cold PBS and perfused-fixed with 4% paraformaldehyde in 0.1 M PBS (pH 7.4). Complete animal heads were post-fixed overnight in 4% paraformaldehyde and whole brains were then surgically removed and freeze-protected by passing through a sucrose gradient (2 h at 5%, 2 h at 10% and overnight at 20%) after which they were frozen in liquid nitrogen and stored at − 80 °C until further processing for histological analysis. Consecutive 10 μm-thick cryosections were prepared from the somatosensory and motor cortices, the genu, the body and the splenium, using a microm HM500. Immunofluorescence analysis was performed using the following antibodies: a rabbit anti-GFAP (Abcam, ab7779, 1/500 dilution) in combination with a AF555-labeled donkey anti-rabbit secondary antibody (Invitrogen, A31572, 1/1000 dilution), a rabbit anti-Iba1 (Wako, 019-19741, 1/500 dilution) in combination with a AF555-labeled donkey anti-rabbit secondary antibody (Invitrogen, A31572, 1/1000 dilution), a chicken anti-MBP antibody (Millipore, AB9348; 1/200 dilution) in combination with a DyLight549 donkey anti-Chicken secondary antibody (Jackson ImmunoResearch, 703-506-155; 1/1000 dilution). Slides were counterstained using TOPRO-3 (Invitrogen, T3605, 1/200 dilution). Following staining, sections were mounted using Prolong Gold Antifade (Invitrogen, P36930). Fluorescence image acquisition was performed using a standard research fluorescence microscope (Olympus B×51 fluorescence microscope) equipped with an Olympus DP71 digital camera. Olympus cellSense Software (v 1.4) was used for widefield image acquisition. Quantitative analysis was performed using NIH ImageJ analysis software (v1.46r), as previously described (Praet et al., 2015). Astrocytes were determined using the glial fibrillary acidic protein (GFAP), microglia was evaluated using the ionized calcium-binding adapter molecule 1 (Iba-1) and myelin using the myelin basic protein (MBP). The degree of astrogliosis (GFAP), microgliosis (Iba-1) and myelination (MBP) was determined by the image-covering staining and expressed as percentage of the total area.
2.5. Statistical analyses
For each ROI, and for each of the estimated diffusion parameters and the normalized T2 weighted signals we fitted a linear mixed model with time (0, 3, 6 and 12 weeks), treatment (control, cuprizone) and the interaction between time and treatment as fixed factors. Time was defined as a factor to allow for a different time evolution between the different time points. As the mice were measured repeatedly with complete data at the 4 time points for 6 mice in the control group and 7 mice in the cuprizone group we needed to correct for observations coming from the same mouse. To this end a random intercept for each mouse was added to the model. We first tested if the coefficients corresponding to the interaction between time and treatment were significant as we were interested in detecting if the evolution of each parameter over time differs between the two treatment groups. In case of significant interaction (significance level = 5%), control and cuprizone group were compared at each time point (3, 6 and 12 weeks) using the estimates resulting from the interaction model. P-values were compared to 5%/3 to correct for multiple testing. Analysis were done using R version 3.1 (R Core Team (2014). R: A language and environment for statistical computing. R Foundation for Statistical Computing, Vienna, Austria).
Statistical analysis of histological data was performed per region using a one-way ANOVA comparing the 4 time points. In case of significance, post hoc tests were performed using the Bonferroni correction. For data that did not meet the normality criteria, the non-parametric Kruskal-Wallis test was used with post hoc Dunn tests in case of significance (SPSS 20.0. IBM Corp. Released 2011. IBM SPSS Statistics for Windows, Version 20.0. Armonk, NY: IBM Corp.).
3. RESULTS
3.1. Histological validation of demyelination, inflammation and remyelination in the cuprizone mouse model
In this study we used the acute cuprizone model to induce demyelination and inflammation of the CNS, which is later followed by remyelination. For this, mice were fed a cuprizone diet for a period of six weeks resulting in inflammation and demyelination, followed by an additional period of six weeks to allow recovery.
First, we investigated the behaviour of two different cortical areas, the motor and the somatosensory cortices. Cortical demyelination was present as early as three weeks of cuprizone administration in the motor cortices (62.1% decrease vs. control), reached a peak after six weeks (83.4% decrease vs. control) and remained significantly detectable by the end of the recovery period (22% decrease vs. control), (Figure 2 a, 1st row). The somatosensory cortices displayed significant demyelination only after six weeks of ingestion of the cuprizone supplemented diet (70% decrease vs. control), (Figure 2a, 2nd row). While cortical microgliosis was not significantly detectable at any time point (Figure 2 b) astrogliosis was present in both motor and somatosensory cortices upon cuprizone ingestion (10.3 times and 6 times increase vs. control, respectively) and returned to control levels by the end of the recovery period (Figure 2 c).
Figure 2. Histological quantification of myelin, microgliosis and astrogliosis in the motor and somatosensory cortices following cuprizone administration.

Graphs display the mean ± SD for (a) myelin (MBP), (b) microglia (Iba-1) and (c) astrocytes (GFAP) illustrating demyelination, astrogliosis and spontaneous remyelination in the motor and somatosensory cortices following cuprizone administration. Corresponding panels show representative immunofluorescence images taken at the level of the motor (top) and somatosensory (bottom) cortices for myelin (MBP, red fluorescence), microglia (Iba-1, red fluorescence) and astrocytes (GFAP, red fluorescence). The first column shows a control mouse (Control), the second and third columns a mouse following three weeks (3W CPZ) and six weeks (6W CPZ) on a 0.2% cuprizone diet and the fourth column a mouse after six weeks on a 0.2% cuprizone diet followed by six weeks of recovery on standard rodent chow (6W CPZ + 6W recovery). Scale bar = 100 μm for GFAP and Iba-1 and 200 μm for MBP. Significant differences with respect to controls are indicated by *P<0.05, **P<0.01, ***P<0.001. (n = 7 Control; n = 3 3W CPZ; n = 5 6W CPZ; n = 5 6WCPZ + 6W recovery).
In a second part of this study we investigated the behaviour of three anatomically distinct parts of the corpus callosum, namely the genu, body and splenium.
Quantitative histological analyses validated the extensive demyelination and microgliosis of the splenium (77.3% demyelination and 28.4 times increase of microglia vs. control) and body (47.4% demyelination and 7.1 times increase of microglia vs. control) after three weeks of cuprizone administration (Figure 3a, 2nd and 3rd rows and figure 3 b, 2nd and 3rd rows for myelin and microglia, respectively). After six weeks of cuprizone administration, microgliosis was strongly diminished and a first attempt of remyelination was observed. Astrogliosis was evident after three weeks of cuprizone treatment in the body (2.1 times increase vs. control), while in the splenium astrogliosis was detectable only after six weeks (4.9 times increase vs. control), (Figure 3 c, 2nd and 3rd rows). At the end of the recovery period, the splenium displayed a higher degree of astrogliosis (4.7 times increase vs. control), while microglia returned to control levels and remyelination can be observed.
Figure 3. Histological quantification of myelin, microgliosis and astrogliosis in the splenium, body and genu of the corpus callosum following cuprizone administration.

Graphs display the mean ± SD for (a) myelin (MBP), (b) microglia (Iba-1) and (c) astrocytes (GFAP) showing demyelination, microgliosis, astrogliosis and spontaneous remyelination in the genu, body and splenium of the corpus callosum following cuprizone administration. Corresponding panels show representative immunofluorescence images taken at the level of the genu (top), body (middle), and splenium (bottom) for myelin (MBP, red fluorescence), microglia (Iba-1, red fluorescence) and astrocytes (GFAP, red fluorescence). The first column shows a control mouse (Control), the second and third columns a mouse following three weeks (3W CPZ) and six weeks (6W CPZ) on a 0.2% cuprizone diet and the fourth column a mouse after six weeks on a 0.2% cuprizone diet followed by six weeks of recovery on standard rodent chow (6W CPZ + 6W recovery). Scale bar = 100 μm. Significant differences with respect to controls are indicated by *P<0.05, **P<0.01, ***P<0.001. (n = 7 Control; n = 3 3W CPZ; n = 5 6W CPZ; n = 5 6WCPZ + 6W recovery).
The genu of the corpus callosum displayed a more variable response to cuprizone intoxication. Demyelination was not significantly detectable at any time point (Figure 3a, 1st row). Three weeks of cuprizone administration resulted in a peak of microgliosis (6 times increase vs. control), and astrogliosis was maximal after six weeks of cuprizone (2.6 times increase vs. control), (Figure 3 b and c, 1st row, respectively). At the end of the recovery period both microglia and astrocytes returned to control levels.
3.2. Cuprizone induced white matter, but not grey matter, alterations are detectable with T2 weighted imaging
Anatomical T2 weighted MR images were acquired in order to verify the appearance of cuprizone induced lesions in the cortical grey matter and in the white matter, i.e. corpus callosum.
As previously described in the literature, no visual changes were detected between cuprizone treated and control mice in cortical areas on T2 weighted images at any time point (Figure 4 a). Quantitative analysis of nT2w signals further confirmed the absence of significant differences between cuprizone treated and control mice at the level of the motor and somatosensory cortices (Figure 4 b and c).
Figure 4. T2-weighted imaging of cuprizone induced CNS demyelination and inflammation.

Panel a shows representative T2 weighted images at the level of genu, body and splenium of the corpus callosum together with the above motor and somatosensory cortices for a control mouse (Control) a mouse following three weeks (3W CPZ) and six weeks (6W CPZ) on a 0.2% cuprizone diet and a mouse after six weeks on a 0.2% cuprizone diet followed by six weeks of recovery on standard rodent chow (6W CPZ + 6W recovery). Arrows indicate the clear contrast inversion of the corpus callosum following cuprizone administration. Scale bar = 1 mm. Graphs show the individual normalized T2-weighted signals and the linear mixed model fit ± SE for the control (light grey shaded area) and cuprizone treated mice (dark grey shaded area), for the motor (b) and the somatosensory (c) cortices, the splenium (d), the body (e) and the genu (f). Control mice are indicated with open circles and cuprizone fed mice with filled circles. Significant differences with respect to controls are indicated by *P<0.05, **P<0.01, ***P<0.001. Note that p-values were compared to 5%/3 to correct for multiple testing.
The T2 weighted images acquired after three weeks and six weeks of cuprizone administration demonstrated a contrast inversion of the corpus callosum indicative of demyelination and inflammation (Figure 4 a, arrows indicating the corpus callosum at the level of the genu (1st row), body (2nd row) and splenium (3rd row). After six weeks of recovery the corpus callosum harboured its characteristic hypo-intense contrast indicating that remyelination has occurred. Quantitative analysis of the normalized T2 weighted signals (nT2w signal) revealed significant increase of nT2w signal for mice that received a cuprizone diet compared to control mice after three weeks (44.9%, 22.8% and 24.1% increase vs. control, for the splenium, body and genu, respectively) and six weeks (37.8%, 28.6% and 25.8% increase vs. control, for the splenium, body and genu, respectively) of cuprizone administration in the splenium, body and genu. At the end of the recovery period, nT2w signals of the splenium, body and genu were strongly decreased as compared to nT2w signals after six weeks of cuprizone administration, which is in agreement with the reappearance of myelin sheaths; however, the nT2w signals still remained elevated for mice that received the cuprizone diet (15.5%, 15.3% and 18.2% increase vs. control, for the splenium, body and genu, respectively), hence suggesting an incomplete recovery (Figure 4 d, e and f).
3.3. Diffusion kurtosis imaging, but not diffusion tensor imaging, detects alterations in cortical grey matter following demyelination, inflammation and remyelination
We here investigated whether diffusion metrics are sensitive to detect microstructural alterations in cortical areas following cuprizone intoxication.
Diffusion tensor (DT) metrics did not show any significant changes following cuprizone administration in the motor nor in the somatosensory cortices (supplementary figure 1).
In the motor cortices, the diffusion kurtosis metrics MK and RK were decreased after three weeks (6.8% and 8.4% decrease vs. control, respectively) and six weeks of cuprizone administration (9.9% and 13.5% decrease vs. control, respectively). At the end of the recovery period, only MK remained decreased (6% decrease vs. control), (Figure 5 a and b). In a similar manner, MK, RK and AK were significantly decreased after six weeks of cuprizone ingestion at the level of the somatosensory cortices (9%, 9.7% and 8.7% decrease vs. control, for MK, RK and AK), (Figure 5 d, e and f). At the end of the recovery period, all kurtosis metrics from the somatosensory cortices returned to control levels.
Figure 5. Assessment of diffusion kurtosis metrics in the motor and somatosensory cortices following cuprizone induced CNS demyelination and inflammation.
Graphs display the mean (a and d), radial (b and e) and axial (c and f) diffusion kurtosis metrics at the level of the motor and somatosensory cortices, respectively. Circles indicate individual measures for control (open circles) and cuprizone treated mice (filled circles), while the shaded areas indicate the estimated values (mean ± SE) from the linear mixed model for the control (light grey shaded area) and cuprizone treated mice (dark grey shaded area). Significant differences with respect to controls are indicated by *P<0.05, **P<0.01, ***P<0.001. Note that p-values were compared to 5%/3 to correct for multiple testing.
In summary, these results demonstrated that diffusion kurtosis tensor (DK)-derived metrics were able to probe microstructural alterations in cortical grey matter following cuprizone induced demyelination and inflammation.
3.4. Diffusion tensor and kurtosis imaging, along with white matter tract integrity metrics detect alterations in white matter following demyelination, inflammation and remyelination
Next, we evaluated the sensitivity of diffusion tensor (DT) and kurtosis tensor (DK)-derived metrics to detect cuprizone induced white matter pathology.
As shown in figure 6, DT-derived metrics were significantly different between cuprizone and control groups in the splenium and body of the corpus callosum. For both the splenium and the body, MD and RD showed a similar evolution over time. MD and RD first displayed a significant decrease after three weeks of cuprizone (13.6% and 12.2% decrease vs. control, for MD and RD for the splenium and 6.2% and 8.5% decrease vs. control, for MD and RD for the body), which was followed by an increase after six weeks of cuprizone (14% and 18.6% decrease vs. control, for MD and RD for the splenium and 8.1% and 10.4% decrease vs. control, for MD and RD for the body), and which remained until the end of the recovery period (9.2% and 16.2% decrease vs. control, for MD and RD for the splenium and 7.5% and 6.7% decrease vs. control, for MD and RD for the body), (Figure 6 a and b for the splenium, d and e for the body). AD was significantly decreased in the splenium after three weeks of cuprizone (14.5% decrease vs. control), (Figure 6 c) and significantly increased (8.9% increase vs. control) at the end of the recovery period in the body (Figure 6 f). At the level of the genu, the DT-derived metrics did not shown any significant difference at any time point between control and cuprizone treated groups (Figure 6 g, h and i). Similarly, the fractional anisotropy (FA) metric did not enable the distinction between control and cuprizone treated mice at the level of the splenium, body nor genu of the corpus callosum (data not shown).
Figure 6. Assessment of diffusion tensor metrics in the splenium, body and genu following cuprizone induced CNS demyelination and inflammation.

Graphs display the mean (a, d and g), radial (b, e and h) and axial (c, f and i) diffusion tensor metrics at the level of the splenium, body and genu respectively. Circles indicate individual measures for control (open circles) and cuprizone treated mice (filled circles), while the shaded areas indicate the estimated values (mean ± SE) from the linear mixed model for the control (light grey shaded area) and cuprizone treated mice (dark grey shaded area). Significant differences with respect to controls are indicated by *P<0.05, **P<0.01, ***P<0.001. Note that p-values were compared to 5%/3 to correct for multiple testing.
DKI-derived metrics revealed significant changes over time between control and cuprizone treated mice in the splenium, body and genu of the corpus callosum. After three weeks of cuprizone ingestion, MK and RK were increased by 29.1% and 21.3% in the splenium, 10.5% and 11.6% in the body and 15.1% and 14.3% in the genu, as compared to control, respectively (Figure 7 a and b for the splenium, d and e for the body, g and h for the genu). After six weeks of cuprizone treatment, MK and RK returned to control levels in the body and genu and were significantly decreased in the splenium (11.8% and 21.7% decrease vs. control, respectively). In the splenium and body, AK was first increased (23.3% and 6.2% increase vs. control, respectively) and secondly decreased (18.2% and 8.5% decrease vs. control, respectively) after three and six weeks of cuprizone administration, respectively (Figure 7 c and f).
Figure 7. Assessment of diffusion kurtosis metrics in the splenium, body and genu following cuprizone induced CNS demyelination and inflammation.
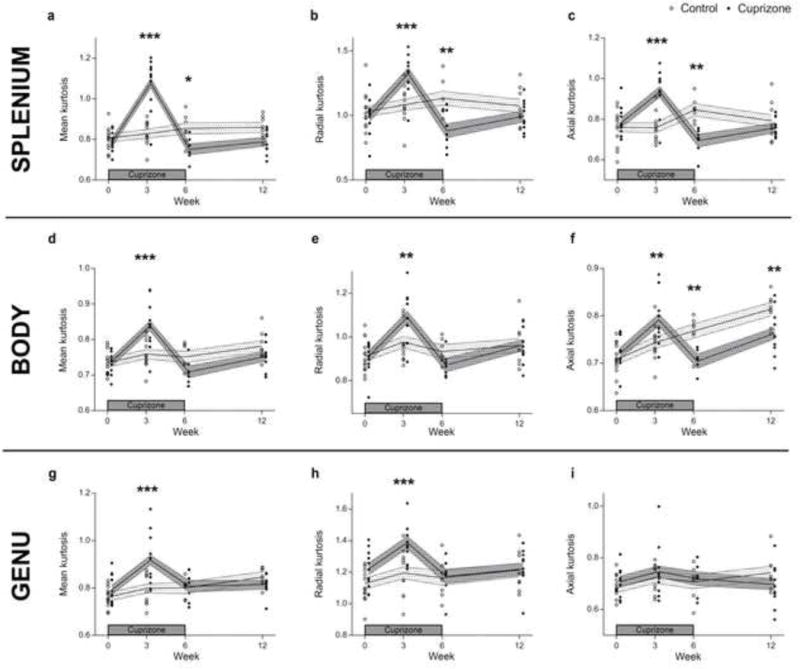
Graphs display the mean (a, d and g), radial (b, e and h) and axial (c, f and i) diffusion kurtosis metrics at the level of the splenium, body and genu, respectively. Circles indicate individual measures for control (open circles) and cuprizone treated mice (filled circles), while the shaded areas indicate the estimated values (mean ± SE) from the linear mixed model for the control (light grey shaded area) and cuprizone treated mice (dark grey shaded area). Significant differences with respect to controls are indicated by *P<0.05, **P<0.01, ***P<0.001. Note that p-values were compared to 5%/3 to correct for multiple testing.
In the last part of this study, we used newly developed WMTI metrics by Fieremans et al. (Fieremans et al., 2011) to characterize in more details the white matter alterations following cuprizone intoxication. The WMTI derived metrics include the AWF, Da, tortuosity, radial and axial diffusivity of the extra-axonal space.
The AWF was decreased after six weeks of cuprizone diet in the splenium and body and remained decreased by the end of the recovery period (17% and 18.6% decrease vs. control for the splenium and 10.2% and 8.2% decrease vs. control for the body). In the genu, this decrease was only detected at the end of the recovery period (7.8% decrease vs. control), revealing long lasting axonal pathology (Figure 8 a, e and i). Da, the intrinsic diffusivity inside the axons, was decreased by 27.4% and 11% in the splenium and body, respectively, after three weeks of cuprizone diet (Figure 8 b and f). In the body, this was accompanied by an additional decrease in the radial and axial diffusivity of the extra-axonal space (7.6% and 5.8% decrease vs. control for radial and axial diffusivity of the extra-axonal space, respectively) (Figure 8 g and h). The tortuosity metric did not show any significant change between control and cuprizone treated group at any time point (data not shown).
Figure 8. White matter tract integrity derived metrics of the splenium, body and genu following cuprizone induced CNS demyelination and inflammation.

The axonal water fraction, intrinsic diffusivity, radial and axial diffusivity of the extra-axonal space are specifically named metrics derived from the WMTI model. Graphs display the axonal water fraction (a, e and i), intrinsic diffusivity inside the axons (b, f and j), the radial (c, g and k) and axial (d, h and l) diffusivities of the extra-axonal space at the level of the splenium, body and genu, respectively. Circles indicate individual measures for control (open circles) and cuprizone treated mice (filled circles), while the shaded areas indicate the estimated values (mean ± SE) from the linear mixed model for the control (light grey shaded area) and cuprizone treated mice (dark grey shaded area). Significant differences with respect to controls are indicated by *P<0.05, **P<0.01, ***P<0.001. Note that p-values were compared to 5%/3 to correct for multiple testing.
4. DISCUSSION
Numerous MRI studies have used the cuprizone mouse model of CNS demyelination as a tool to investigate demyelination and axonal pathology. Among them, conventional T2-weighted imaging and DTI have established their worth in the detection of white matter alterations as they provided a tool to follow non-invasively the temporal evolution of cuprizone induced CNS pathology (Boretius et al., 2012; Song et al., 2002; Thiessen et al., 2013; Tobin et al., 2011; Wu et al., 2008; Xie et al., 2010), and the possibility to evaluate a therapy outcome (Acs et al., 2009; Chandran et al., 2012; Harsan et al., 2008; Marriott et al., 2008; Torkildsen et al., 2009).
As expected, in our study, we observed an increase of T2 weighted signal from the corpus callosum following cuprizone administration, and this was in agreement with our histological findings supporting the induction of microgliosis, astrogliosis and demyelination. Remarkably, our longitudinal analysis revealed differences between cuprizone treated and age-matched control mice at the end of the recovery period, which may be explained by, on the one hand, the persistence of astrogliosis in cuprizone treated mice, and on the other hand as the result of the impairment of the late myelination process and maturation of myelin sheets taking place in the CNS of young adult rodents (Baloch et al., 2009; Semple et al., 2013; Verma et al., 2005). The above underlined the lack of specificity of T2-weighted imaging for the in-depth characterization of histopathological events. Besides, T2-weighted imaging was insensitive to yet well-described cuprizone induced cortical grey matter demyelination (Skripuletz et al., 2008).
In the present study we evaluated the sensitivity of DT, DK and WMTI metrics in brain areas undergoing microstructural changes as a result of cuprizone administration. Using a semi-longitudinal approach, we were able to assess the temporal contribution of combined inflammatory processes and myelination status on diffusion metrics during the acute demyelinating phase, spontaneous remyelination and at the end of the recovery period. For a comprehensive discussion of the results, we summarized the histological findings and the diffusion-derived parameters in TABLE 1.
Table 1.
Histological analyses, DT, DK and WMTI-derived metrics which enable the distinction between cuprizone (CPZ) and control groups for each ROI and time-point.

|
↑ (red) and ↓ (green) indicate an increase or a decrease as compared to the control group, respectively.
p ≤ 0.05,
p ≤ 0.01, and
p ≤ 0.001.
We demonstrated the aptitude of DKI to detect grey matter demyelination in two distinct cortical areas that presented different demyelination patterns. As reported in previous studies (Gudi et al., 2009; Yang et al., 2009) the somatosensory cortices displayed severe demyelination after six weeks of cuprizone intoxication, which corresponded to a significant decrease of MK, RK and AK (TABLE 1, Somatosensory cortices, 6W CPZ). In the motor cortices, demyelination was detectable after three and six weeks of cuprizone administration, which coincided with a decrease of MK and RK (TABLE 1, Motor cortices, 3W CPZ, 6W CPZ). Interestingly, at the end of the recovery period, MK of the motor cortex remained decreased and this was associated with an incomplete remyelination (TABLE 1, Motor cortices, 6W CPZ + 6W recovery).
It is generally accepted that MK reflects tissue complexity and heterogeneity, for instance cell membrane density, orientation and organization of fibers (Hui et al., 2008; Wu and Cheung, 2010). As such, a decrease of MK is believed to be linked to a loss of microstructure. Furthermore, in line with our findings, a decrease of MK has been observed in the grey matter of the spinal cord of MS patients (Raz et al., 2013) and a very recent study by Bester et al. who reported a decrease of MK in cortical grey matter of MS patients, which also correlated with cognitive deficits (Bester et al., 2014).
Although we noted the presence of cortical astrogliosis through an increase of GFAP expression during cuprizone administration, we did not observe any increase in DK metrics in the cortical areas as previously described (Zhuo et al., 2012) (TABLE 1, Motor and Somatosensory cortices). This could be explained by the fact that the diffusion-derived metrics arising from an MRI voxel actually represent the summation of all the effects that the different constituents present in this voxel have on the water dispersion. Consequently, our results suggest that, in our study, diffusion-derived metrics were primarily affected by the severe demyelination which occurred in the cortical brain regions as a consequence of cuprizone administration.
In the white matter, DK-derived metrics showed increased sensitivity as compared to DT-derived metrics for the detection of alterations present in the genu of the corpus callosum, a region less affected by cuprizone administration. Corroborating the findings of a study from Falangola et al. we found that the best differentiators between cuprizone fed mice and control were MK, RK and the AWF (Falangola et al., 2014) (TABLE 1, Genu). However, in the case of Falangola et al., MK and RK were found decreased while we noted an increase of both MK and RK. This discrepancy may be explained by the difference in lesion type as they used a model of chronically induced demyelinated lesions while we observed those changes during the earlier acute inflammatory demyelinating phase (10 weeks vs. 3 weeks of cuprizone administration, respectively). In opposition to our findings in the cortical grey matter, MK was not closely associated with the myelination status in the white matter i.e. MK was found either increased, decreased or unchanged during white matter demyelination.
The extensive infiltration and proliferation of microglia/macrophages is particularly noteworthy in the corpus callosum after three weeks of cuprizone administration, thus resulting in increased cellularity and membrane barriers, that can reach up to four times the density of microglia present under normal conditions (Hiremath et al., 1998). As expected, the increase of membrane barriers due to microgliosis was strongly associated with an increase of MK, RK and to a lesser extent, AK (TABLE 1, Genu, Body and Splenium, 3W CPZ). This association of high MK, RK and AK values to an increase in microstructural complexity and higher cellularity has also been observed in studies examining brain tumours, notably when comparing high grade gliomas to low grade gliomas (Raab et al., 2010; Van Cauter et al., 2012).
In our study, the DT-derived metrics MD and RD were amongst the best differentiators between the cuprizone treated and control groups, in the body and splenium of the corpus callosum, at all investigated time points. MD and RD displayed a similar biphasic behaviour, first decreased during the acute demyelinating phase (TABLE 1, Body and Splenium, 3W CPZ) and later increased during the spontaneous remyelination and recovery periods (TABLE 1, Body and Splenium, 6W CPZ and 6W CPZ + 6W recovery). Increase of RD has been consistently associated with impaired myelination (Ou et al., 2009) and demyelination (Hemanth Kumar et al., 2014; Janve et al., 2013; Klawiter et al., 2011; Song et al., 2002; Wang et al., 2009) and thus RD has been proposed to serve as a surrogate marker of demyelination. However, in the present study, RD did not closely reflect demyelination, as RD was found decreased, instead of increased, during acute demyelination (3W CPZ). This decrease of RD is in agreement with prior studies performed in the cuprizone model that have nuanced the sensitivity of RD to detect demyelination, as the latter may be reduced in the presence of axonal damage, notably during the acute demyelinating phase following cuprizone administration (Sun et al., 2006). This transient axonal damage has been linked to a temporary decrease of AD (Song et al., 2005; Sun et al., 2006; Xie et al., 2010) thereby providing a plausible explanation for the lower value of AD we observed in the splenium of the corpus callosum after a 3-week period of cuprizone administration (TABLE 1, Splenium, 3W CPZ). In contrast, we observed a high value of AD in the body of the corpus callosum at the end of the recovery period (TABLE 1, Body, 6W CPZ + 6W recovery). Several studies have shown a positive correlation between AD and astrogliosis (Falangola et al., 2014; Wang et al., 2009), however, in our study, we were not able to link this increase to remaining astrogliosis (TABLE 1, Splenium, 6W CPZ + 6W recovery) at the level of the corpus callosum.
The DT-derived metrics, notably MD and RD, were able to differentiate between control and cuprizone treated groups at the end of the recovery period while DK-derived metrics were not (with the exception of AK at the level of the body). The increased diffusivity detected with the DT-derived metrics is likely to be associated with oedema seen on the T2-weighted images, which cannot be ascertained by DKI that uses higher b-values, and therefore is intrinsically less sensitive to rapidly diffusing fluid (Yang et al., 2013).
It is interesting to note that we did not detect any changes of FA following cuprizone diet. FA is a scalar value that varies between 0 and 1, and represents the estimation of the directionality of water diffusion, being the highest in white matter due to coherently oriented myelinated bundles that restrict the diffusion along the axonal axis, and approaching zero in the cerebral spinal fluid. FA has been a versatile indicator of demyelinated CNS lesions, while most studies have found that an increase of MD is associated with a decrease of FA (Filippi et al., 2013; Horsfield and Jones, 2002; Patel et al., 2007), others studies have reported an increase of FA (Calabrese et al., 2011; Ciccarelli et al., 2001; Tovar-Moll et al., 2009) or like in our case, no statistical significant changes (Zhang et al., 2012).
Lastly, the WMTI metrics were highly sensitive to the axonal pathology status. After a 3-week period of cuprizone diet, Da was strongly decreased, possibly due to axonal swelling or beading in the body and splenium (TABLE 1, Body and Splenium, 3W CPZ), as a result of severe microglial activation and myelin breakdown (Crawford et al., 2009; Kim et al., 2010; Lindner et al., 2008; Merkler et al., 2005; Song et al., 2005; Tsiperson et al., 2010; Zhang et al., 2012). We hypothesized that this increase in cellularity and myelin debris may be a plausible explanation for the decrease of the extra-axonal diffusivity indexes, namely De,‖ and De,e⊥, in the body (TABLE 1, Body, 3W CPZ). In contrast, the AWF was able to discern long-lasting changes following cuprizone administration. We found that the AWF in the corpus callosum was decreased during spontaneous remyelination and by the end of the recovery period (TABLE 1, Genu, Body and Splenium, 6W CPZ and 6W CPZ + 6W recovery), which can be explained by both demyelination (resulting in a relative increase of the extra-axonal space), as well as due to the decrease in axonal calibre observed after a demyelinating event, which is well documented in the cuprizone mouse model (Bando et al., 2008; Cate et al., 2010; Wu et al., 2008).
We acknowledge that one main limitation of this study was the impossibility to perform a one-to-one correlation between the DKI-derived and the histological metrics due to our semi-longitudinal approach. As recent studies encountered the difficulty of asserting a straightforward causal relationship between a specific histological feature and diffusion derived metrics (Blockx et al., 2012a; Umesh Rudrapatna et al., 2014), we focussed on the assessment of temporal evolution of diffusion parameters according to the CNS lesion stages i.e., acute inflammatory demyelinated and re-myelinated lesions. Moreover, we cannot exclude that a partial volume effect due to a larger voxel size may have had an effect on the results, especially in the body of the corpus callosum.
In conclusion, we have demonstrated that DKI-derived metrics are sensitive to cuprizone induced demyelination and spontaneous remyelination of cortical areas, thus highlighting the potential of kurtosis for the detection of grey matter alterations. Furthermore, DK and WMTI-derived metrics provided complementary information to DT-derived metrics regarding the underlying mechanisms of white matter degeneration, including axonal integrity and associated inflammatory events both during acute demyelination and remyelination.
Supplementary Material
Highlights.
Diffusion kurtosis imaging detects cuprizone induced cortical demyelination.
Diffusion tensor imaging detects cuprizone induced white matter alterations.
Diffusion kurtosis imaging improves detection of white matter alterations.
White matter tract integrity metrics improves detection of white matter pathology.
Acknowledgments
We acknowledge helpful assistance from David Berg with histological techniques (Bio-Imaging Lab, University of Antwerp). This research was supported by the European Union’s Seventh Framework Programme under grant agreement number 278850 (INMiND), by Molecular Imaging of Brain Pathophysiology (BRAINPATH) under grant agreement number 612360 within the Marie Curie Actions-Industry-Academia Partnerships and Pathways (IAPP) program, Hercules funding AUHA/012 financing MRI-research infrastructure and in part by the Flemish Impulse funding for heavy scientific equipment (42/FA010100/1230) (granted to A. Van der Linden) as well as by research grants G.0130.11 and G.0136.11 (granted to A. Van der Linden and P. Ponsaerts) of the Research Foundation Flanders (FWO Vlaanderen, Belgium), the ICON project call 2011 “Super MRI” and Interdisciplinary PhD grant (ID) BOS UA 2012 (granted to M. Verhoye) and by the Interuniversity Attraction Poles Program (P7/11) initiated by the Belgian Science Policy Office (J. Sijbers). C. Guglielmetti is holder of an IWT (Institute for the Promotion of Innovation through Science and Technology in Flanders (IWT-Vlaanderen) PhD grant. J. Veraart research was funded by the Fund for Scientific Research-Flanders (FWO). E. Fieremans work is supported by the National Institutes of Health, under grant numbers R21-NS081230 and R01NS088040.
Abbreviations
- α
tortuosity of extra-axonal space
- Da
intra-axonal diffusivity
- De,‖
axial diffusivity of extra-axonal space
- De,⊥
radial diffusivity of extra-axonal space
- AD
axial diffusion
- AK
axial kurtosis
- AWF
axonal water fraction
- CNS
central nervous system
- DKI
diffusion kurtosis imaging
- DK
diffusion kurtosis tensor
- DT
diffusion tensor
- DTI
diffusion tensor imaging
- DW
diffusion weighted
- FA
fractional anisotropy
- FMRIB
functional magnetic resonance imaging of the brain
- FSL
FMRIB software library
- GFAP
glial fibrillary acidic protein
- Iba1
ionized calcium binding adaptor molecule 1
- MBP
myelin basic protein
- MD
mean diffusion
- MK
mean kurtosis
- MR
magnetic resonance
- NAWM
normal appearing white matter
- nT2
normalized T2
- RK
radial kurtosis
- RD
radial diffusion
- SE-EPI
spin echo – echo planar imaging
- WMTI
white matter tract integrity
Footnotes
Conflict of interest statement: The authors declare no conflict of interest.
References
- Acs P, Kipp M, Norkute A, Johann S, Clarner T, Braun A, Berente Z, Komoly S, Beyer C. 17beta-estradiol and progesterone prevent cuprizone provoked demyelination of corpus callosum in male mice. Glia. 2009;57:807–814. doi: 10.1002/glia.20806. [DOI] [PubMed] [Google Scholar]
- Alexander AL, Lee JE, Lazar M, Field AS. Diffusion tensor imaging of the brain. Neurotherapeutics. 2007;4:316–329. doi: 10.1016/j.nurt.2007.05.011. [DOI] [PMC free article] [PubMed] [Google Scholar]
- Baloch S, Verma R, Huang H, Khurd P, Clark S, Yarowsky P, Abel T, Mori S, Davatzikos C. Quantification of brain maturation and growth patterns in C57BL/6J mice via computational neuroanatomy of diffusion tensor images. Cereb Cortex. 2009;19:675–687. doi: 10.1093/cercor/bhn112. [DOI] [PMC free article] [PubMed] [Google Scholar]
- Bando Y, Takakusaki K, Ito S, Terayama R, Kashiwayanagi M, Yoshida S. Differential changes in axonal conduction following CNS demyelination in two mouse models. Eur J Neurosci. 2008;28:1731–1742. doi: 10.1111/j.1460-9568.2008.06474.x. [DOI] [PubMed] [Google Scholar]
- Basser PJ. Inferring microstructural features and the physiological state of tissues from diffusion-weighted images. NMR Biomed. 1995;8:333–344. doi: 10.1002/nbm.1940080707. [DOI] [PubMed] [Google Scholar]
- Basser PJ, Jones DK. Diffusion-tensor MRI: theory, experimental design and data analysis - a technical review. NMR Biomed. 2002;15:456–467. doi: 10.1002/nbm.783. [DOI] [PubMed] [Google Scholar]
- Basser PJ, Pierpaoli C. Microstructural and physiological features of tissues elucidated by quantitative-diffusion-tensor MRI. J Magn Reson B. 1996;111:209–219. doi: 10.1006/jmrb.1996.0086. [DOI] [PubMed] [Google Scholar]
- Beaulieu C. The basis of anisotropic water diffusion in the nervous system - a technical review. NMR Biomed. 2002;15:435–455. doi: 10.1002/nbm.782. [DOI] [PubMed] [Google Scholar]
- Benardais K, Kotsiari A, Skuljec J, Koutsoudaki PN, Gudi V, Singh V, Vulinovic F, Skripuletz T, Stangel M. Cuprizone [bis(cyclohexylidenehydrazide)] is selectively toxic for mature oligodendrocytes. Neurotox Res. 2013;24:244–250. doi: 10.1007/s12640-013-9380-9. [DOI] [PubMed] [Google Scholar]
- Benitez A, Fieremans E, Jensen JH, Falangola MF, Tabesh A, Ferris SH, Helpern JA. White matter tract integrity metrics reflect the vulnerability of late-myelinating tracts in Alzheimer’s disease. Neuroimage Clin. 2014;4:64–71. doi: 10.1016/j.nicl.2013.11.001. [DOI] [PMC free article] [PubMed] [Google Scholar]
- Bester M, Jensen J, Babb J, Tabesh A, Miles L, Herbert J, Grossman R, Inglese M. Non-Gaussian diffusion MRI of gray matter is associated with cognitive impairment in multiple sclerosis. Mult Scler. 2014 doi: 10.1177/1352458514556295. [DOI] [PMC free article] [PubMed] [Google Scholar]
- Blockx I, De Groof G, Verhoye M, Van Audekerke J, Raber K, Poot D, Sijbers J, Osmand AP, Von Horsten S, Van der Linden A. Microstructural changes observed with DKI in a transgenic Huntington rat model: evidence for abnormal neurodevelopment. Neuroimage. 2012a;59:957–967. doi: 10.1016/j.neuroimage.2011.08.062. [DOI] [PubMed] [Google Scholar]
- Blockx I, Verhoye M, Van Audekerke J, Bergwerf I, Kane JX, Delgado YPR, Veraart J, Jeurissen B, Raber K, von Horsten S, Ponsaerts P, Sijbers J, Leergaard TB, Van der Linden A. Identification and characterization of Huntington related pathology: an in vivo DKI imaging study. Neuroimage. 2012b;63:653–662. doi: 10.1016/j.neuroimage.2012.06.032. [DOI] [PubMed] [Google Scholar]
- Boretius S, Escher A, Dallenga T, Wrzos C, Tammer R, Bruck W, Nessler S, Frahm J, Stadelmann C. Assessment of lesion pathology in a new animal model of MS by multiparametric MRI and DTI. Neuroimage. 2012;59:2678–2688. doi: 10.1016/j.neuroimage.2011.08.051. [DOI] [PubMed] [Google Scholar]
- Buschmann JP, Berger K, Awad H, Clarner T, Beyer C, Kipp M. Inflammatory response and chemokine expression in the white matter corpus callosum and gray matter cortex region during cuprizone-induced demyelination. J Mol Neurosci. 2012;48:66–76. doi: 10.1007/s12031-012-9773-x. [DOI] [PMC free article] [PubMed] [Google Scholar]
- Calabrese M, Rinaldi F, Seppi D, Favaretto A, Squarcina L, Mattisi I, Perini P, Bertoldo A, Gallo P. Cortical diffusion-tensor imaging abnormalities in multiple sclerosis: a 3-year longitudinal study. Radiology. 2011;261:891–898. doi: 10.1148/radiol.11110195. [DOI] [PubMed] [Google Scholar]
- Calabrese M, Romualdi C, Poretto V, Favaretto A, Morra A, Rinaldi F, Perini P, Gallo P. The changing clinical course of multiple sclerosis: a matter of gray matter. Ann Neurol. 2013;74:76–83. doi: 10.1002/ana.23882. [DOI] [PubMed] [Google Scholar]
- Cate HS, Wu QZ, Kemper D, Merlo D, Wang HX, Fang K, Egan GF, Kilpatrick TJ. Influence of methylprednisolone on magnetic resonance and histological measures during cuprizone-induced demyelination. Neurosci Lett. 2010;483:47–52. doi: 10.1016/j.neulet.2010.07.060. [DOI] [PubMed] [Google Scholar]
- Chandran P, Upadhyay J, Markosyan S, Lisowski A, Buck W, Chin CL, Fox G, Luo F, Day M. Magnetic resonance imaging and histological evidence for the blockade of cuprizone-induced demyelination in C57BL/6 mice. Neuroscience. 2012;202:446–453. doi: 10.1016/j.neuroscience.2011.10.051. [DOI] [PubMed] [Google Scholar]
- Cheung JS, Wang E, Lo EH, Sun PZ. Stratification of heterogeneous diffusion MRI ischemic lesion with kurtosis imaging: evaluation of mean diffusion and kurtosis MRI mismatch in an animal model of transient focal ischemia. Stroke. 2012;43:2252–2254. doi: 10.1161/STROKEAHA.112.661926. [DOI] [PMC free article] [PubMed] [Google Scholar]
- Ciccarelli O, Werring DJ, Wheeler-Kingshott CA, Barker GJ, Parker GJ, Thompson AJ, Miller DH. Investigation of MS normal-appearing brain using diffusion tensor MRI with clinical correlations. Neurology. 2001;56:926–933. doi: 10.1212/wnl.56.7.926. [DOI] [PubMed] [Google Scholar]
- Coutu JP, Chen JJ, Rosas HD, Salat DH. Non-Gaussian water diffusion in aging white matter. Neurobiol Aging. 2014;35:1412–1421. doi: 10.1016/j.neurobiolaging.2013.12.001. [DOI] [PMC free article] [PubMed] [Google Scholar]
- Crawford DK, Mangiardi M, Xia X, Lopez-Valdes HE, Tiwari-Woodruff SK. Functional recovery of callosal axons following demyelination: a critical window. Neuroscience. 2009;164:1407–1421. doi: 10.1016/j.neuroscience.2009.09.069. [DOI] [PubMed] [Google Scholar]
- Delgado y Palacios R, Campo A, Henningsen K, Verhoye M, Poot D, Dijkstra J, Van Audekerke J, Benveniste H, Sijbers J, Wiborg O, Van der Linden A. Magnetic resonance imaging and spectroscopy reveal differential hippocampal changes in anhedonic and resilient subtypes of the chronic mild stress rat model. Biol Psychiatry. 2011;70:449–457. doi: 10.1016/j.biopsych.2011.05.014. [DOI] [PubMed] [Google Scholar]
- Delgado y Palacios R, Verhoye M, Henningsen K, Wiborg O, Van der Linden A. Diffusion kurtosis imaging and high-resolution MRI demonstrate structural aberrations of caudate putamen and amygdala after chronic mild stress. PLoS One. 2014;9:e95077. doi: 10.1371/journal.pone.0095077. [DOI] [PMC free article] [PubMed] [Google Scholar]
- den Dekker AJ, Sijbers J. Data distributions in magnetic resonance images: a review. Phys Med. 2014;30:725–741. doi: 10.1016/j.ejmp.2014.05.002. [DOI] [PubMed] [Google Scholar]
- Falangola MF, Guilfoyle DN, Tabesh A, Hui ES, Nie X, Jensen JH, Gerum SV, Hu C, LaFrancois J, Collins HR, Helpern JA. Histological correlation of diffusional kurtosis and white matter modeling metrics in cuprizone-induced corpus callosum demyelination. NMR Biomed. 2014;27:948–957. doi: 10.1002/nbm.3140. [DOI] [PMC free article] [PubMed] [Google Scholar]
- Falangola MF, Jensen JH, Babb JS, Hu C, Castellanos FX, Di Martino A, Ferris SH, Helpern JA. Age-related non-Gaussian diffusion patterns in the prefrontal brain. J Magn Reson Imaging. 2008;28:1345–1350. doi: 10.1002/jmri.21604. [DOI] [PMC free article] [PubMed] [Google Scholar]
- Fieremans E, Benitez A, Jensen JH, Falangola MF, Tabesh A, Deardorff RL, Spampinato MV, Babb JS, Novikov DS, Ferris SH, Helpern JA. Novel white matter tract integrity metrics sensitive to Alzheimer disease progression. AJNR Am J Neuroradiol. 2013;34:2105–2112. doi: 10.3174/ajnr.A3553. [DOI] [PMC free article] [PubMed] [Google Scholar]
- Fieremans E, Jensen JH, Helpern JA. White matter characterization with diffusional kurtosis imaging. Neuroimage. 2011;58:177–188. doi: 10.1016/j.neuroimage.2011.06.006. [DOI] [PMC free article] [PubMed] [Google Scholar]
- Filippi M, Preziosa P, Pagani E, Copetti M, Mesaros S, Colombo B, Horsfield MA, Falini A, Comi G, Lassmann H, Rocca MA. Microstructural magnetic resonance imaging of cortical lesions in multiple sclerosis. Mult Scler. 2013;19:418–426. doi: 10.1177/1352458512457842. [DOI] [PubMed] [Google Scholar]
- Fox RJ, Cronin T, Lin J, Wang X, Sakaie K, Ontaneda D, Mahmoud SY, Lowe MJ, Phillips MD. Measuring myelin repair and axonal loss with diffusion tensor imaging. AJNR Am J Neuroradiol. 2011;32:85–91. doi: 10.3174/ajnr.A2238. [DOI] [PMC free article] [PubMed] [Google Scholar]
- Franklin K, Paxinos G. The mouse brain in stereotaxic coordinates. 3rd. Academic Press; San Diego: 1997. [Google Scholar]
- Giorgio A, Palace J, Johansen-Berg H, Smith SM, Ropele S, Fuchs S, Wallner-Blazek M, Enzinger C, Fazekas F. Relationships of brain white matter microstructure with clinical and MR measures in relapsing-remitting multiple sclerosis. J Magn Reson Imaging. 2010;31:309–316. doi: 10.1002/jmri.22062. [DOI] [PMC free article] [PubMed] [Google Scholar]
- Grossman EJ, Kirov II, Gonen O, Novikov DS, Davitz MS, Lui YW, Grossman RI, Inglese M, Fieremans E. N-acetyl-aspartate levels correlate with intra-axonal compartment parameters from diffusion MRI. Neuroimage. 2015;118:334–343. doi: 10.1016/j.neuroimage.2015.05.061. [DOI] [PMC free article] [PubMed] [Google Scholar]
- Gudi V, Gingele S, Skripuletz T, Stangel M. Glial response during cuprizone-induced de-and remyelination in the CNS: lessons learned. Front Cell Neurosci. 2014;8:73. doi: 10.3389/fncel.2014.00073. [DOI] [PMC free article] [PubMed] [Google Scholar]
- Gudi V, Moharregh-Khiabani D, Skripuletz T, Koutsoudaki PN, Kotsiari A, Skuljec J, Trebst C, Stangel M. Regional differences between grey and white matter in cuprizone induced demyelination. Brain Res. 2009;1283:127–138. doi: 10.1016/j.brainres.2009.06.005. [DOI] [PubMed] [Google Scholar]
- Guglielmetti C, Praet J, Rangarajan JR, Vreys R, De Vocht N, Maes F, Verhoye M, Ponsaerts P, Van der Linden A. Multimodal imaging of subventricular zone neural stem/progenitor cells in the cuprizone mouse model reveals increased neurogenic potential for the olfactory bulb pathway, but no contribution to remyelination of the corpus callosum. Neuroimage. 2014;86:99–110. doi: 10.1016/j.neuroimage.2013.07.080. [DOI] [PubMed] [Google Scholar]
- Harsan LA, Steibel J, Zaremba A, Agin A, Sapin R, Poulet P, Guignard B, Parizel N, Grucker D, Boehm N, Miller RH, Ghandour MS. Recovery from chronic demyelination by thyroid hormone therapy: myelinogenesis induction and assessment by diffusion tensor magnetic resonance imaging. J Neurosci. 2008;28:14189–14201. doi: 10.1523/JNEUROSCI.4453-08.2008. [DOI] [PMC free article] [PubMed] [Google Scholar]
- Hemanth Kumar BS, Mishra SK, Trivedi R, Singh S, Rana P, Khushu S. Demyelinating evidences in CMS rat model of depression: a DTI study at 7 T. Neuroscience. 2014;275:12–21. doi: 10.1016/j.neuroscience.2014.05.037. [DOI] [PubMed] [Google Scholar]
- Hibbits N, Yoshino J, Le TQ, Armstrong RC. Astrogliosis during acute and chronic cuprizone demyelination and implications for remyelination. ASN Neuro. 2012;4:393–408. doi: 10.1042/AN20120062. [DOI] [PMC free article] [PubMed] [Google Scholar]
- Hiremath MM, Saito Y, Knapp GW, Ting JP, Suzuki K, Matsushima GK. Microglial/macrophage accumulation during cuprizone-induced demyelination in C57BL/6 mice. J Neuroimmunol. 1998;92:38–49. doi: 10.1016/s0165-5728(98)00168-4. [DOI] [PubMed] [Google Scholar]
- Honce JM. Gray Matter Pathology in MS: Neuroimaging and Clinical Correlations. Mult Scler Int. 2013;2013:627870. doi: 10.1155/2013/627870. [DOI] [PMC free article] [PubMed] [Google Scholar]
- Horsfield MA, Jones DK. Applications of diffusion-weighted and diffusion tensor MRI to white matter diseases - a review. NMR Biomed. 2002;15:570–577. doi: 10.1002/nbm.787. [DOI] [PubMed] [Google Scholar]
- Hui ES, Cheung MM, Qi L, Wu EX. Towards better MR characterization of neural tissues using directional diffusion kurtosis analysis. Neuroimage. 2008;42:122–134. doi: 10.1016/j.neuroimage.2008.04.237. [DOI] [PubMed] [Google Scholar]
- Hui ES, Fieremans E, Jensen JH, Tabesh A, Feng W, Bonilha L, Spampinato MV, Adams R, Helpern JA. Stroke assessment with diffusional kurtosis imaging. Stroke. 2012;43:2968–2973. doi: 10.1161/STROKEAHA.112.657742. [DOI] [PMC free article] [PubMed] [Google Scholar]
- Janve VA, Zu Z, Yao SY, Li K, Zhang FL, Wilson KJ, Ou X, Does MD, Subramaniam S, Gochberg DF. The radial diffusivity and magnetization transfer pool size ratio are sensitive markers for demyelination in a rat model of type III multiple sclerosis (MS) lesions. Neuroimage. 2013;74:298–305. doi: 10.1016/j.neuroimage.2013.02.034. [DOI] [PMC free article] [PubMed] [Google Scholar]
- Jelescu IO, Veraart J, Adisetiyo V, Milla SS, Novikov DS, Fieremans E. One diffusion acquisition and different white matter models: how does microstructure change in human early development based on WMTI and NODDI? Neuroimage. 2015;107:242–256. doi: 10.1016/j.neuroimage.2014.12.009. [DOI] [PMC free article] [PubMed] [Google Scholar]
- Jensen JH, Helpern JA. MRI quantification of non-Gaussian water diffusion by kurtosis analysis. NMR Biomed. 2010;23:698–710. doi: 10.1002/nbm.1518. [DOI] [PMC free article] [PubMed] [Google Scholar]
- Jensen JH, Helpern JA, Ramani A, Lu H, Kaczynski K. Diffusional kurtosis imaging: the quantification of non-gaussian water diffusion by means of magnetic resonance imaging. Magn Reson Med. 2005;53:1432–1440. doi: 10.1002/mrm.20508. [DOI] [PubMed] [Google Scholar]
- Kim JY, Shen S, Dietz K, He Y, Howell O, Reynolds R, Casaccia P. HDAC1 nuclear export induced by pathological conditions is essential for the onset of axonal damage. Nat Neurosci. 2010;13:180–189. doi: 10.1038/nn.2471. [DOI] [PMC free article] [PubMed] [Google Scholar]
- Kimura MC, Doring TM, Rueda FC, Tukamoto G, Gasparetto EL. In vivo assessment of white matter damage in neuromyelitis optica: a diffusion tensor and diffusion kurtosis MR imaging study. J Neurol Sci. 2014;345:172–175. doi: 10.1016/j.jns.2014.07.035. [DOI] [PubMed] [Google Scholar]
- Kipp M, Clarner T, Dang J, Copray S, Beyer C. The cuprizone animal model: new insights into an old story. Acta Neuropathol. 2009;118:723–736. doi: 10.1007/s00401-009-0591-3. [DOI] [PubMed] [Google Scholar]
- Klawiter EC, Schmidt RE, Trinkaus K, Liang HF, Budde MD, Naismith RT, Song SK, Cross AH, Benzinger TL. Radial diffusivity predicts demyelination in ex vivo multiple sclerosis spinal cords. Neuroimage. 2011;55:1454–1460. doi: 10.1016/j.neuroimage.2011.01.007. [DOI] [PMC free article] [PubMed] [Google Scholar]
- Kutzelnigg A, Lassmann H. Cortical lesions and brain atrophy in MS. J Neurol Sci. 2005;233:55–59. doi: 10.1016/j.jns.2005.03.027. [DOI] [PubMed] [Google Scholar]
- Kutzelnigg A, Lucchinetti CF, Stadelmann C, Bruck W, Rauschka H, Bergmann M, Schmidbauer M, Parisi JE, Lassmann H. Cortical demyelination and diffuse white matter injury in multiple sclerosis. Brain. 2005;128:2705–2712. doi: 10.1093/brain/awh641. [DOI] [PubMed] [Google Scholar]
- Le Bihan D, Mangin JF, Poupon C, Clark CA, Pappata S, Molko N, Chabriat H. Diffusion tensor imaging: concepts and applications. J Magn Reson Imaging. 2001;13:534–546. doi: 10.1002/jmri.1076. [DOI] [PubMed] [Google Scholar]
- Lindner M, Trebst C, Heine S, Skripuletz T, Koutsoudaki PN, Stangel M. The chemokine receptor CXCR2 is differentially regulated on glial cells in vivo but is not required for successful remyelination after cuprizone-induced demyelination. Glia. 2008;56:1104–1113. doi: 10.1002/glia.20682. [DOI] [PubMed] [Google Scholar]
- Lucchinetti CF, Popescu BF, Bunyan RF, Moll NM, Roemer SF, Lassmann H, Bruck W, Parisi JE, Scheithauer BW, Giannini C, Weigand SD, Mandrekar J, Ransohoff RM. Inflammatory cortical demyelination in early multiple sclerosis. N Engl J Med. 2011;365:2188–2197. doi: 10.1056/NEJMoa1100648. [DOI] [PMC free article] [PubMed] [Google Scholar]
- Marriott MP, Emery B, Cate HS, Binder MD, Kemper D, Wu Q, Kolbe S, Gordon IR, Wang H, Egan G, Murray S, Butzkueven H, Kilpatrick TJ. Leukemia inhibitory factor signaling modulates both central nervous system demyelination and myelin repair. Glia. 2008;56:686–698. doi: 10.1002/glia.20646. [DOI] [PubMed] [Google Scholar]
- Mason JL, Jones JJ, Taniike M, Morell P, Suzuki K, Matsushima GK. Mature oligodendrocyte apoptosis precedes IGF-1 production and oligodendrocyte progenitor accumulation and differentiation during demyelination/remyelination. J Neurosci Res. 2000;61:251–262. doi: 10.1002/1097-4547(20000801)61:3<251::AID-JNR3>3.0.CO;2-W. [DOI] [PubMed] [Google Scholar]
- Matsushima GK, Morell P. The neurotoxicant, cuprizone, as a model to study demyelination and remyelination in the central nervous system. Brain Pathol. 2001;11:107–116. doi: 10.1111/j.1750-3639.2001.tb00385.x. [DOI] [PMC free article] [PubMed] [Google Scholar]
- Merkler D, Boretius S, Stadelmann C, Ernsting T, Michaelis T, Frahm J, Bruck W. Multicontrast MRI of remyelination in the central nervous system. NMR Biomed. 2005;18:395–403. doi: 10.1002/nbm.972. [DOI] [PubMed] [Google Scholar]
- Orije J, Kara F, Guglielmetti C, Praet J, Van der Linden A, Ponsaerts P, Verhoye M. Longitudinal monitoring of metabolic alterations in cuprizone mouse model of multiple sclerosis using 1H-magnetic resonance spectroscopy. Neuroimage. 2015;114:128–135. doi: 10.1016/j.neuroimage.2015.04.012. [DOI] [PubMed] [Google Scholar]
- Ou X, Sun SW, Liang HF, Song SK, Gochberg DF. The MT pool size ratio and the DTI radial diffusivity may reflect the myelination in shiverer and control mice. NMR Biomed. 2009;22:480–487. doi: 10.1002/nbm.1358. [DOI] [PMC free article] [PubMed] [Google Scholar]
- Patel SA, Hum BA, Gonzalez CF, Schwartzman RJ, Faro SH, Mohamed FB. Application of voxelwise analysis in the detection of regions of reduced fractional anisotropy in multiple sclerosis patients. J Magn Reson Imaging. 2007;26:552–556. doi: 10.1002/jmri.21076. [DOI] [PubMed] [Google Scholar]
- Paydar A, Fieremans E, Nwankwo JI, Lazar M, Sheth HD, Adisetiyo V, Helpern JA, Jensen JH, Milla SS. Diffusional kurtosis imaging of the developing brain. AJNR Am J Neuroradiol. 2014;35:808–814. doi: 10.3174/ajnr.A3764. [DOI] [PMC free article] [PubMed] [Google Scholar]
- Praet J, Guglielmetti C, Berneman Z, Van der Linden A, Ponsaerts P. Cellular and molecular neuropathology of the cuprizone mouse model: clinical relevance for multiple sclerosis. Neurosci Biobehav Rev. 2014;47:485–505. doi: 10.1016/j.neubiorev.2014.10.004. [DOI] [PubMed] [Google Scholar]
- Praet J, Orije J, Kara F, Guglielmetti C, Santermans E, Daans J, Hens N, Verhoye M, Berneman Z, Ponsaerts P, Van der Linden A. Cuprizone-induced demyelination and demyelination-associated inflammation result in different proton magnetic resonance metabolite spectra. NMR Biomed. 2015;28:505–513. doi: 10.1002/nbm.3277. [DOI] [PMC free article] [PubMed] [Google Scholar]
- Raab P, Hattingen E, Franz K, Zanella FE, Lanfermann H. Cerebral gliomas: diffusional kurtosis imaging analysis of microstructural differences. Radiology. 2010;254:876–881. doi: 10.1148/radiol.09090819. [DOI] [PubMed] [Google Scholar]
- Raz E, Bester M, Sigmund EE, Tabesh A, Babb JS, Jaggi H, Helpern J, Mitnick RJ, Inglese M. A better characterization of spinal cord damage in multiple sclerosis: a diffusional kurtosis imaging study. AJNR Am J Neuroradiol. 2013;34:1846–1852. doi: 10.3174/ajnr.A3512. [DOI] [PMC free article] [PubMed] [Google Scholar]
- Remington LT, Babcock AA, Zehntner SP, Owens T. Microglial recruitment, activation, and proliferation in response to primary demyelination. Am J Pathol. 2007;170:1713–1724. doi: 10.2353/ajpath.2007.060783. [DOI] [PMC free article] [PubMed] [Google Scholar]
- Roosendaal SD, Geurts JJ, Vrenken H, Hulst HE, Cover KS, Castelijns JA, Pouwels PJ, Barkhof F. Regional DTI differences in multiple sclerosis patients. Neuroimage. 2009;44:1397–1403. doi: 10.1016/j.neuroimage.2008.10.026. [DOI] [PubMed] [Google Scholar]
- Sbardella E, Tona F, Petsas N, Pantano P. DTI Measurements in Multiple Sclerosis: Evaluation of Brain Damage and Clinical Implications. Mult Scler Int. 2013;2013:671730. doi: 10.1155/2013/671730. [DOI] [PMC free article] [PubMed] [Google Scholar]
- Semple BD, Blomgren K, Gimlin K, Ferriero DM, Noble-Haeusslein LJ. Brain development in rodents and humans: Identifying benchmarks of maturation and vulnerability to injury across species. Prog Neurobiol. 2013:106–107. doi: 10.1016/j.pneurobio.2013.04.001. [DOI] [PMC free article] [PubMed] [Google Scholar]
- Skripuletz T, Gudi V, Hackstette D, Stangel M. De- and remyelination in the CNS white and grey matter induced by cuprizone: the old, the new, and the unexpected. Histol Histopathol. 2011;26:1585–1597. doi: 10.14670/HH-26.1585. [DOI] [PubMed] [Google Scholar]
- Skripuletz T, Lindner M, Kotsiari A, Garde N, Fokuhl J, Linsmeier F, Trebst C, Stangel M. Cortical demyelination is prominent in the murine cuprizone model and is strain-dependent. Am J Pathol. 2008;172:1053–1061. doi: 10.2353/ajpath.2008.070850. [DOI] [PMC free article] [PubMed] [Google Scholar]
- Song SK, Sun SW, Ramsbottom MJ, Chang C, Russell J, Cross AH. Dysmyelination revealed through MRI as increased radial (but unchanged axial) diffusion of water. Neuroimage. 2002;17:1429–1436. doi: 10.1006/nimg.2002.1267. [DOI] [PubMed] [Google Scholar]
- Song SK, Yoshino J, Le TQ, Lin SJ, Sun SW, Cross AH, Armstrong RC. Demyelination increases radial diffusivity in corpus callosum of mouse brain. Neuroimage. 2005;26:132–140. doi: 10.1016/j.neuroimage.2005.01.028. [DOI] [PubMed] [Google Scholar]
- Steelman AJ, Thompson JP, Li J. Demyelination and remyelination in anatomically distinct regions of the corpus callosum following cuprizone intoxication. Neurosci Res. 2012;72:32–42. doi: 10.1016/j.neures.2011.10.002. [DOI] [PMC free article] [PubMed] [Google Scholar]
- Sun SW, Liang HF, Trinkaus K, Cross AH, Armstrong RC, Song SK. Noninvasive detection of cuprizone induced axonal damage and demyelination in the mouse corpus callosum. Magn Reson Med. 2006;55:302–308. doi: 10.1002/mrm.20774. [DOI] [PubMed] [Google Scholar]
- Thiessen JD, Zhang Y, Zhang H, Wang L, Buist R, Del Bigio MR, Kong J, Li XM, Martin M. Quantitative MRI and ultrastructural examination of the cuprizone mouse model of demyelination. NMR Biomed. 2013;26:1562–1581. doi: 10.1002/nbm.2992. [DOI] [PubMed] [Google Scholar]
- Tobin JE, Xie M, Le TQ, Song SK, Armstrong RC. Reduced axonopathy and enhanced remyelination after chronic demyelination in fibroblast growth factor 2 (Fgf2)-null mice: differential detection with diffusion tensor imaging. J Neuropathol Exp Neurol. 2011;70:157–165. doi: 10.1097/NEN.0b013e31820937e4. [DOI] [PMC free article] [PubMed] [Google Scholar]
- Torkildsen O, Brunborg LA, Thorsen F, Mork SJ, Stangel M, Myhr KM, Bo L. Effects of dietary intervention on MRI activity, de- and remyelination in the cuprizone model for demyelination. Exp Neurol. 2009;215:160–166. doi: 10.1016/j.expneurol.2008.09.026. [DOI] [PubMed] [Google Scholar]
- Tovar-Moll F, Evangelou IE, Chiu AW, Richert ND, Ostuni JL, Ohayon JM, Auh S, Ehrmantraut M, Talagala SL, McFarland HF, Bagnato F. Thalamic involvement and its impact on clinical disability in patients with multiple sclerosis: a diffusion tensor imaging study at 3T. AJNR Am J Neuroradiol. 2009;30:1380–1386. doi: 10.3174/ajnr.A1564. [DOI] [PMC free article] [PubMed] [Google Scholar]
- Tsiperson V, Li X, Schwartz GJ, Raine CS, Shafit-Zagardo B. GAS6 enhances repair following cuprizone-induced demyelination. PLoS One. 2010;5:e15748. doi: 10.1371/journal.pone.0015748. [DOI] [PMC free article] [PubMed] [Google Scholar]
- Umesh Rudrapatna S, Wieloch T, Beirup K, Ruscher K, Mol W, Yanev P, Leemans A, van der Toorn A, Dijkhuizen RM. Can diffusion kurtosis imaging improve the sensitivity and specificity of detecting microstructural alterations in brain tissue chronically after experimental stroke? Comparisons with diffusion tensor imaging and histology. Neuroimage. 2014;97:363–373. doi: 10.1016/j.neuroimage.2014.04.013. [DOI] [PubMed] [Google Scholar]
- Van Cauter S, Veraart J, Sijbers J, Peeters RR, Himmelreich U, De Keyzer F, Van Gool SW, Van Calenbergh F, De Vleeschouwer S, Van Hecke W, Sunaert S. Gliomas: diffusion kurtosis MR imaging in grading. Radiology. 2012;263:492–501. doi: 10.1148/radiol.12110927. [DOI] [PubMed] [Google Scholar]
- Vanhoutte G, Pereson S, Delgado YPR, Guns PJ, Asselbergh B, Veraart J, Sijbers J, Verhoye M, Van Broeckhoven C, Van der Linden A. Diffusion kurtosis imaging to detect amyloidosis in an APP/PS1 mouse model for Alzheimer’s disease. Magn Reson Med. 2013;69:1115–1121. doi: 10.1002/mrm.24680. [DOI] [PubMed] [Google Scholar]
- Veraart J, Poot DH, Van Hecke W, Blockx I, Van der Linden A, Verhoye M, Sijbers J. More accurate estimation of diffusion tensor parameters using diffusion Kurtosis imaging. Magn Reson Med. 2011;65:138–145. doi: 10.1002/mrm.22603. [DOI] [PubMed] [Google Scholar]
- Veraart J, Rajan J, Peeters RR, Leemans A, Sunaert S, Sijbers J. Comprehensive framework for accurate diffusion MRI parameter estimation. Magn Reson Med. 2013;70:972–984. doi: 10.1002/mrm.24529. [DOI] [PubMed] [Google Scholar]
- Verma R, Mori S, Shen D, Yarowsky P, Zhang J, Davatzikos C. Spatiotemporal maturation patterns of murine brain quantified by diffusion tensor MRI and deformation-based morphometry. Proc Natl Acad Sci U S A. 2005;102:6978–6983. doi: 10.1073/pnas.0407828102. [DOI] [PMC free article] [PubMed] [Google Scholar]
- Wang S, Wu EX, Qiu D, Leung LH, Lau HF, Khong PL. Longitudinal diffusion tensor magnetic resonance imaging study of radiation-induced white matter damage in a rat model. Cancer Res. 2009;69:1190–1198. doi: 10.1158/0008-5472.CAN-08-2661. [DOI] [PubMed] [Google Scholar]
- Wergeland S, Torkildsen O, Myhr KM, Mork SJ, Bo L. The cuprizone model: regional heterogeneity of pathology. APMIS. 2012;120:648–657. doi: 10.1111/j.1600-0463.2012.02882.x. [DOI] [PubMed] [Google Scholar]
- Wu EX, Cheung MM. MR diffusion kurtosis imaging for neural tissue characterization. NMR Biomed. 2010;23:836–848. doi: 10.1002/nbm.1506. [DOI] [PubMed] [Google Scholar]
- Wu QZ, Yang Q, Cate HS, Kemper D, Binder M, Wang HX, Fang K, Quick MJ, Marriott M, Kilpatrick TJ, Egan GF. MRI identification of the rostral-caudal pattern of pathology within the corpus callosum in the cuprizone mouse model. J Magn Reson Imaging. 2008;27:446–453. doi: 10.1002/jmri.21111. [DOI] [PubMed] [Google Scholar]
- Xie M, Tobin JE, Budde MD, Chen CI, Trinkaus K, Cross AH, McDaniel DP, Song SK, Armstrong RC. Rostrocaudal analysis of corpus callosum demyelination and axon damage across disease stages refines diffusion tensor imaging correlations with pathological features. J Neuropathol Exp Neurol. 2010;69:704–716. doi: 10.1097/NEN.0b013e3181e3de90. [DOI] [PMC free article] [PubMed] [Google Scholar]
- Yang AW, Jensen JH, Hu CC, Tabesh A, Falangola MF, Helpern JA. Effect of cerebral spinal fluid suppression for diffusional kurtosis imaging. J Magn Reson Imaging. 2013;37:365–371. doi: 10.1002/jmri.23840. [DOI] [PMC free article] [PubMed] [Google Scholar]
- Yang HJ, Wang H, Zhang Y, Xiao L, Clough RW, Browning R, Li XM, Xu H. Region-specific susceptibilities to cuprizone-induced lesions in the mouse forebrain: Implications for the pathophysiology of schizophrenia. Brain Res. 2009;1270:121–130. doi: 10.1016/j.brainres.2009.03.011. [DOI] [PubMed] [Google Scholar]
- Yoshida M, Hori M, Yokoyama K, Fukunaga I, Suzuki M, Kamagata K, Shimoji K, Nakanishi A, Hattori N, Masutani Y, Aoki S. Diffusional kurtosis imaging of normal-appearing white matter in multiple sclerosis: preliminary clinical experience. Jpn J Radiol. 2013;31:50–55. doi: 10.1007/s11604-012-0147-7. [DOI] [PubMed] [Google Scholar]
- Zhang J, Jones MV, McMahon MT, Mori S, Calabresi PA. In vivo and ex vivo diffusion tensor imaging of cuprizone-induced demyelination in the mouse corpus callosum. Magn Reson Med. 2012;67:750–759. doi: 10.1002/mrm.23032. [DOI] [PMC free article] [PubMed] [Google Scholar]
- Zhu J, Zhuo C, Qin W, Wang D, Ma X, Zhou Y, Yu C. Performances of diffusion kurtosis imaging and diffusion tensor imaging in detecting white matter abnormality in schizophrenia. Neuroimage Clin. 2015;7:170–176. doi: 10.1016/j.nicl.2014.12.008. [DOI] [PMC free article] [PubMed] [Google Scholar]
- Zhuo J, Xu S, Proctor JL, Mullins RJ, Simon JZ, Fiskum G, Gullapalli RP. Diffusion kurtosis as an in vivo imaging marker for reactive astrogliosis in traumatic brain injury. Neuroimage. 2012;59:467–477. doi: 10.1016/j.neuroimage.2011.07.050. [DOI] [PMC free article] [PubMed] [Google Scholar]
Associated Data
This section collects any data citations, data availability statements, or supplementary materials included in this article.