Abstract
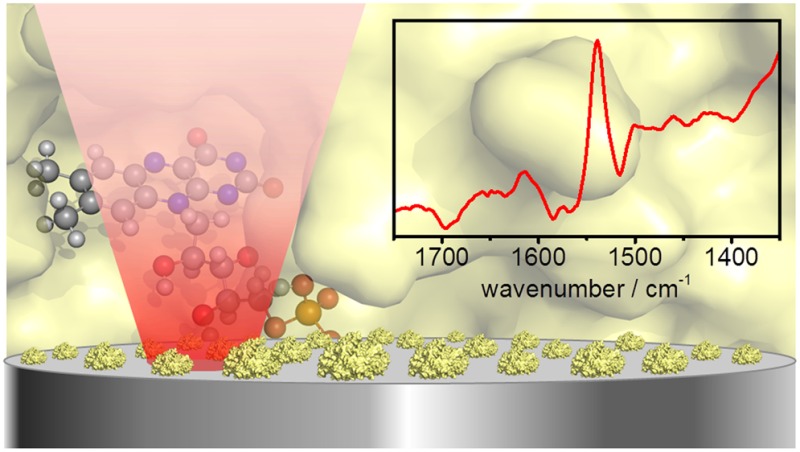
We describe a method for addressing redox enzymes adsorbed on a carbon electrode using synchrotron infrared microspectroscopy combined with protein film electrochemistry. Redox enzymes have high turnover frequencies, typically 10–1000 s–1, and therefore, fast experimental triggers are needed in order to study subturnover kinetics and identify the involvement of transient species important to their catalytic mechanism. In an electrochemical experiment, this equates to the use of microelectrodes to lower the electrochemical cell constant and enable changes in potential to be applied very rapidly. We use a biological cofactor, flavin mononucleotide, to demonstrate the power of synchrotron infrared microspectroscopy relative to conventional infrared methods and show that vibrational spectra with good signal-to-noise ratios can be collected for adsorbed species with low surface coverages on microelectrodes with a geometric area of 25 × 25 μm2. We then demonstrate the applicability of synchrotron infrared microspectroscopy to adsorbed proteins by reporting potential-induced changes in the flavin mononucleotide active site of a flavoenzyme. The method we describe will allow time-resolved spectroscopic studies of chemical and structural changes at redox sites within a variety of proteins under precise electrochemical control.
Infrared (IR) microspectroscopy has been applied to biological systems for cell and tissue mapping,1−5 for example, for probing the subcellular distribution of anticancer agents,6 characterization of adrenal gland tumors,7 probing H/D exchange in live cells,8 and analysis of hydration water around proteins.9 Here, we make use of synchrotron IR microspectroscopy to develop a method for addressing specific chemical changes at sites within redox proteins in response to electrochemically induced changes in oxidation state.
Direct electrochemical control is an important tool for the study of redox proteins. In the technique known as protein film electrochemistry, a redox protein is immobilized on an electrode such that electrons transfer directly to or from its redox cofactors when the electrode is polarized at an appropriate potential.10,11 This approach is particularly valuable in studying enzymes responsible for catalyzing oxidation and reduction reactions, as the electrode potential can be used to trigger catalysis. The electrocatalytic current reports on the activity of the enzyme at each potential and the ways in which the enzyme responds to introduction of substrates or inhibitors.
In order to combine direct electrochemical control with structural and mechanistic insight into chemistry occurring at redox sites within enzymes, high sensitivity spectroscopic techniques, capable of providing chemical information on mechanistically useful time scales, are necessary.12−14 The sensitivity requirement arises due to the low surface coverages achievable with electrode-immobilized redox enzymes, typically on the order of 1–2 pmol cm–2.15 This means that only a small number of active sites are being addressed in comparison to surface science studies of small molecule adsorbates on metal electrodes, for example. Several spectroelectrochemical approaches have been developed for immobilized proteins, including UV–visible spectroscopy at transparent metal oxide electrodes,16−18 fluorescence19,20 or surface enhanced infrared absorption (SEIRA) spectroscopy21,22 at gold electrodes, and various surface enhanced Raman spectroscopies,23,24 most commonly at silver electrodes. We recently demonstrated an attenuated total reflectance IR (ATR-IR) approach for studying redox enzymes immobilized on high surface area carbon electrodes,25,26 exploiting the ease of adsorption of many proteins onto carbon surfaces. The relative chemical inertness of carbon to competing small molecule activation reactions makes it a useful electrode material for studying enzyme electrocatalysis.
In order to extend steady-state turnover studies to subturnover time-resolved investigations, it is necessary to initiate a reaction in the immobilized enzyme by applying an experimental trigger that is fast on the time scale of interest. This equates to applying a potential rapidly at the electrode (on subsecond to millisecond time scales) to be compatible with the high turnover frequencies of redox enzymes, often on the order of 10–1000 s–1. The electrochemical time constant (i.e., the product of solution resistance and double layer capacitance) at the macro-electrodes typically used in biological spectroelectrochemistry compromises the achievable experimental time resolution. This arises because there is greater double layer capacitance in response to a potential step at the electrode–electrolyte interface for a high surface area electrode. For example, the geometric electrode area in the ATR-IR approach we have reported is approximately 43 mm2.25 Significantly improved electrochemical dynamics have been achieved in reflection–absorption microspectroscopy studies which have been applied to surface-enhanced detection of CO adlayers on Pt microelectrodes27,28 and to diffusion-limited reduction of a ferricyanide solution at gold microelectrodes.29,30 We now describe a reflection–absorption microspectroscopic method for studying low coverages of redox enzymes, under electrocatalytic turnover conditions, adsorbed on a carbon particle electrode. Use of a miniaturized high surface area electrode provides a compromise between spectroscopic sensitivity and electrochemical response time (vide infra). In combination with the bright synchrotron IR microbeam available at the MIRIAM (Multimode InfraRed Imaging and Microspectroscopy) beamline of the Diamond Light Source, UK, this approach improves the spectroscopic signal by a factor of between 100 and 1000 times in the mid to far IR range.
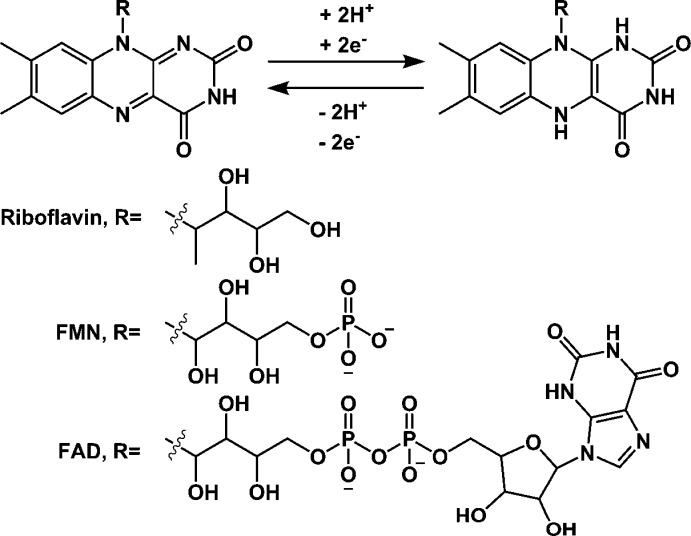
We demonstrate surface electrochemical synchrotron infrared microspectroscopy here applied to the biological flavin cofactor. The flavin moiety undergoes a reversible 2-electron 2-proton redox reaction centered at the isoalloxazine ring as shown in Scheme 1.31 The flavin core is found in vitamin B2 (riboflavin) and is modified in the biologically relevant forms of flavin, flavin mononucleotide (FMN), and flavin adenine dinucleotide (FAD), which are critical to a wide range of cellular processes including the catalytic reduction of NAD(P)+ to NAD(P)H to store reducing equivalents from photosynthesis, catalytic oxidation of NADH by the multisubunit enzyme complex 1 during respiration, and catalysis of certain dehydrogenation and O2 activation reactions. Both the FMN active site and nearby amino acid residues in the protein have infrared spectroscopic markers that are sensitive to the redox reaction shown in Scheme 1.32,33 We report electrochemically induced difference spectra for FMN immobilized on a carbon black electrode and within an immobilized flavoenzyme, the NuoF subunit of respiratory complex I from Escherichia coli.
Scheme 1. Reversible Reduction of the Isoalloxazine Ring of Flavin Cofactors.
Experimental Section
Particle Preparation
Carbon black particles were dispersed in water by ultrasonication (20 mg mL–1, Black Pearls 2000, Cabot Corporation). The dispersed particles were then modified by adsorption of FMN (from a 10 mM solution, Sigma), NouF cell-free extract (CE) containing overexpressed flavoprotein (the 52 kDa NuoF subunit of E. coli complex I; see Supporting Information S1), or NuoF-deficient CE in the dark at 4 °C for 1 h. In order to remove unadsorbed material, the particles were washed with several aliquots of N2-saturated potassium phosphate buffer (50 mM, pH 6.0) containing 100 mM KCl as background electrolyte. After washing, the particles were transferred to an inert atmosphere glovebox (<1 ppm of O2, Glove Box Technology Ltd.) and stored in the dark prior to use.
Synchrotron IR Microspectroscopy
Microspectroscopy experiments were carried out on the MIRIAM beamline at the Diamond Light Source, UK, using a Vertex 80V FT-IR spectrometer and a Hyperion 3000 IR microscope (Bruker) with a high-sensitivity photovoltaic mercury cadmium telluride (MCT) detector cooled to 77 K. Spectra were acquired in reflection mode using a 36× objective and 25 × 25 μm2 aperture, as an average of 1024 interferograms at 4 cm–1 resolution. Data acquisition was performed using Bruker Optik’s OPUS software (version 7.0).
ATR-IR Spectroscopy
ATR-IR spectra were recorded as previously described,25 using the external beam of a 680-IR spectrometer (Varian) diverted into an anaerobic glovebox (<1 ppm of O2, Glove Box Technology Ltd.) housing a multiple-reflection ATR accessory (GladiATR, PIKE Technologies) and a narrow-band MCT detector. High surface area particle electrodes were formed by drop-casting a 1 μL aliquot of FMN-modified particles onto a Si internal reflection element (8.39 × 5 × 1 mm3, face angle of 39°, Crystal GmbH) sealed into a polyether ether ketone (PEEK) base. The electrodes are highly porous with a layer thickness of roughly 3–5 μm: characterization of similar particle electrodes formed from a range of carbon materials has been discussed previously.34 Carbon paper (Toray, TGP-H-030) was placed on top of the deposited particles to ensure lateral electronic connectivity. The spectroelectrochemical cell body, containing a miniature saturated calomel reference electrode, a Pt wire counter electrode (Surepure Chemetals, 99.99%, 26 gauge), and a carbon rod working electrode connection, was sealed onto the base and filled with N2-saturated potassium phosphate buffered electrolyte. Data acquisition was performed using Agilent Resolutions Pro software.
All data analysis was carried out using OriginPro software (OriginLab Corp.). Electrochemical control was provided by an Autolab 128N potentiostat. Electrochemical characterization of NuoF CE was performed by adsorbing the enzyme onto a freshly sanded pyrolytic graphite “edge” electrode which was then immersed in potassium phosphate buffered electrolyte containing 1 mM NAD+ and 1 mM NADH (Prozomix). Potentials were converted to V vs standard hydrogen electrode (SHE) using the conversion E(SHE) = E(SCE) + 242 mV at 25 °C.
Results and Discussion
Figure 1 shows the reflection–absorption cell used to carry out combined spectroscopic-electrochemical measurements by synchrotron microspectroscopy (Figure S2). A glassy carbon rod working electrode (1 mm diameter, Alfa Aesar) was sealed into a Delrin holder using resin (Araldite). The glassy carbon was polished to a mirror finish using successive grades of silicon carbide paper (to 4000 grit, Kemet). A Pt wire counter electrode (Surepure Chemetals, 99.99%, 26 gauge) was housed in a groove around the working electrode and was removable to prevent contamination of the working electrode surface with Pt during polishing. A miniature saturated calomel reference electrode25 was placed close to the working electrode to minimize uncompensated resistance. In order to form a high surface area electrode, the as-prepared carbon black particles were drop-cast onto the working electrode and the cell was sealed against a 2 mm thick CaF2 window (Crystran). The path length of the cell could be controlled either by adjusting the height of the working electrode within the cell (with a 32 threads per inch screw thread) or using a 12.5 μm PTFE spacer (Harrick), in order to minimize absorption losses to bulk water. The cell was filled with N2-saturated phosphate buffered electrolyte through two filling holes that allow operation as a flow cell.
Figure 1.
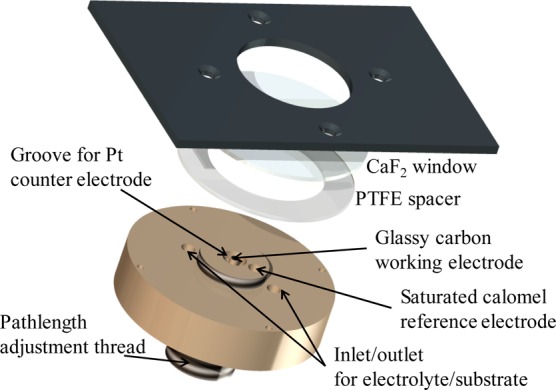
Exploded diagram of the reflection–absorption electrochemical microspectroscopy cell (not to scale; see Figure S2). The glassy carbon working electrode is modified with a layer of carbon black particles, and the path length of the cell can be adjusted to account for small differences in layer thickness between measurements.
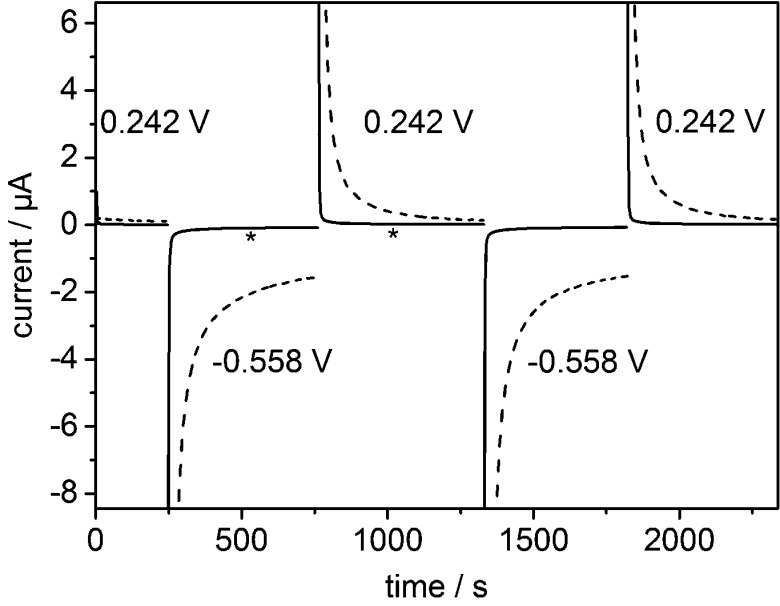
Figure 2 shows current–time traces recorded during a series of potential steps corresponding to repeated reduction (−0.558 V) and reoxidation (+0.242 V) of adsorbed FMN in the microspectroscopy cell (solid) and the ATR-IR cell (dashed). The capacitive contribution to the current persists for several hundred seconds with the high surface area electrode in the ATR-IR cell but contributes for only a few seconds in the microspectroscopy cell (Figure S3). The carbon black particles used in this study have a specific surface area of 1332 m2/g.34 A typical high surface area electrode in the ATR-IR cell contains 2 × 10⁻⁵ g of carbon black (1 μL of a 20 mg/mL dispersion), and so, the total electrode surface area is approximately 266 cm2. In the microspectroscopy cell, the total electrode surface area is approximately 5 cm2 (for a comparable particle deposition of ca. 1 μm thickness,25 as the geometric area is 54 times lower than in the ATR-IR cell). This is still quite high and reflects the deposition of particles onto a large (1 mm diameter in the present microspectroscopy cell) supporting electrode. Carbon microelectrodes with diameters as small as 7 μm are commercially available, and even smaller electrodes can be fabricated using carbon fiber; thus, it will be possible to decrease the total surface area of the particle electrode further by employing a suitable deposition strategy. A conservative estimate of the electrochemical time constant achievable using this particle electrode microspectroscopic method is roughly 50 μs. (The electrochemical time constant of a cell using a microelectrode can be on the order of 1 μs,30 and a typical particle electrode deposited onto a 7 μm microelectrode increases the total surface area by a factor of approximately 50.) This demonstrates the clear advantages of a microspectroscopic approach for electrochemically triggered time-resolved experiments that are capable of probing chemically useful time scales.
Figure 2.
Electrochemistry of FMN adsorbed on carbon black particles. Current–time trace showing a series of potential steps in the ATR-IR (dashed) and reflection–absorption microspectroscopy (solid) cells. The geometric areas of the electrodes are approximately 43 mm2 (ATR-IR) and 0.8 mm2 (microspectroscopy). In the microspectroscopy cell, spectra initiated at times indicated with an ∗ were used to calculate the difference spectrum shown in Figure 3. Potassium phosphate buffer, pH 6, containing 100 mM KCl was used as background electrolyte.
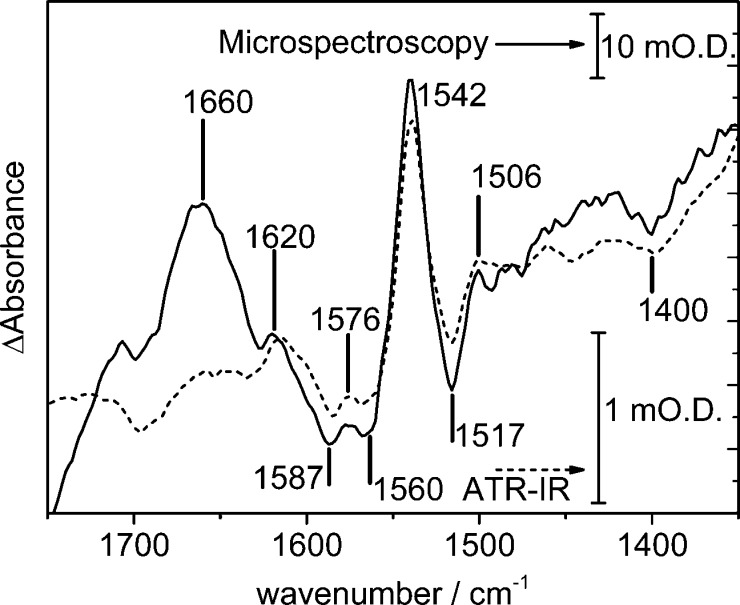
Figure 3 compares spectra obtained using the ATR-IR and synchrotron microspectroscopy approaches, using the reversible 2-electron 2-proton reduction of adsorbed FMN as a model system. Scheme 1 shows the overall reaction occurring at the electrode surface, and Figure 3 shows oxidized minus reduced difference spectra following a potential step from +0.242 to −0.558 V. In these difference spectra, positive going bands correspond to species that are present at oxidizing potentials and negative going bands correspond to species that are present at reducing potentials. The difference spectrum collected using the ATR-IR approach (dashed, large scale bar) shows approximately 40 times lower signal than that using the synchrotron microspectroscopic approach (solid, small scale bar, calculated from spectra initiated at the times indicated with an ∗ in Figure 2), demonstrating a large sensitivity gain using the synchrotron microspectroscopy approach despite spectral acquisition from only a 25 × 25 μm2 area of the supporting electrode (Figure S4). The general features of the difference spectra in Figure 3 are consistent with those previously reported for FMN in solution32,33 although the peak positions are shifted, consistent with the peaks arising from adsorbed FMN rather than FMN in solution. The peak positions in both difference spectra overlap very well, showing that FMN behaves in the same way in both the ATR-IR and reflection–absorption microspectroscopy cells. The electrochemically induced oxidation and reduction of adsorbed FMN in the microspectroscopy cell is fully reversible and reproducible over several potential steps (Figure S5). In principle, therefore, the microspectroscopy cell can be used to collect time-resolved data by coaveraging data over successive cycles.
Figure 3.
Spectroelectrochemistry of FMN adsorbed on carbon black particles. Oxidized minus reduced difference spectra recorded in the ATR-IR (dashed) and reflection–absorption microspectroscopy (solid) cells. Difference spectra were calculated from spectra collected at +0.242 and −0.588 V as an average of 1024 interferograms. The spectrum recorded in the microspectroscopy cell was acquired from a 25 × 25 μm2 geometric area of the electrode, from spectra initiated at the times indicated with an ∗ in Figure 2. Potassium phosphate buffer, pH 6, containing 100 mM KCl was used as background electrolyte.
Precise band assignment of the spectra in Figure 3 is complicated by the lack of consistency of assignment in the literature, both experimentally and computationally (band positions are sensitive to sample age, choice of buffer, pH, and whether the FMN has been subject to visible illumination before or during the measurement). However, in Figure 3, oxidized FMN exhibits C=O bands at ca. 1706 and 1620 cm–1 (in the microspectroscopic case, this latter band is convoluted with a potential-induced change in the H–O–H bend of water at the electrode interface, at ca. 1660 cm–1, reflecting the interfacial sensitivity of the microspectroscopic method relative to the ATR-IR) and bands due to the isoalloxazine ring at roughly 1576, 1541, and 1506 cm–1. Reduced FMN has contributions from the isoalloxazine ring at ca. 1587, 1560, and 1517 cm–1. Negative features due to the broad N–H wag modes at ∼1400 cm–1 confirm that reduction has taken place, as these are not present in the oxidized form (Scheme 1). Additional detail in the synchrotron microspectroscopy data (above the signal-to-noise ratio achieved during the measurement, Figure S5) at 1497 and 1475 cm–1 emphasizes the increased sensitivity of the synchrotron microspectroscopy technique, as weak contributions from CH2 deformations in the phosphate-containing side chain of FMN (Scheme 1) are expected in the region below 1500 cm–1.
Figure 4 shows an oxidized minus reduced difference spectrum for electrode-adsorbed flavoenzyme NuoF CE, collected in the microspectroscopy cell following a potential step from +0.242 to −0.558 V. The surface coverage of NuoF CE is much lower than the surface coverage of FMN,13 so the overall intensity of the difference spectrum is much smaller (Figure S6 shows the difference spectrum relative to the baseline noise level of the microspectroscopic measurement). Nonetheless, the general form of the difference spectrum in the 1400–1600 cm–1 region is similar for both the protein-bound and adsorbed FMN. A clear positive peak at 1540 cm–1 is characteristic of oxidized flavin, and a smaller positive peak at 1522 cm–1 is similar to that in Figure 3 arising from the isoalloxazine ring. Negative peaks at 1556, 1545, and 1511 cm–1 are similar to those of reduced FMN. Further peaks in the NuoF CE difference spectrum are probably due to changes in amide band structure that occur due to changes in protonation during the reduction of the FMN active site and potential-induced reorientation of the protein on the electrode.35 Differences in peak position between FMN in solution,32 adsorbed FMN (Figure 3), and protein-bound FMN (Figure 4) provides evidence that the FMN remains protein-bound during the course of our measurements. Confirmation that the FMN active site remains protein-bound upon adsorption is provided by the catalytic competence of NuoF CE adsorbed on carbon toward both NAD+ reduction and NADH oxidation, as shown in the cyclic voltammogram in the inset of Figure 4. Similar spectroscopic and electrochemical measurements on NuoF-deficient cell-free extract showed no detectable FMN redox chemistry or any electrocatalytic NAD+ reduction or NADH oxidation activity (Figures S7 and S8).
Figure 4.
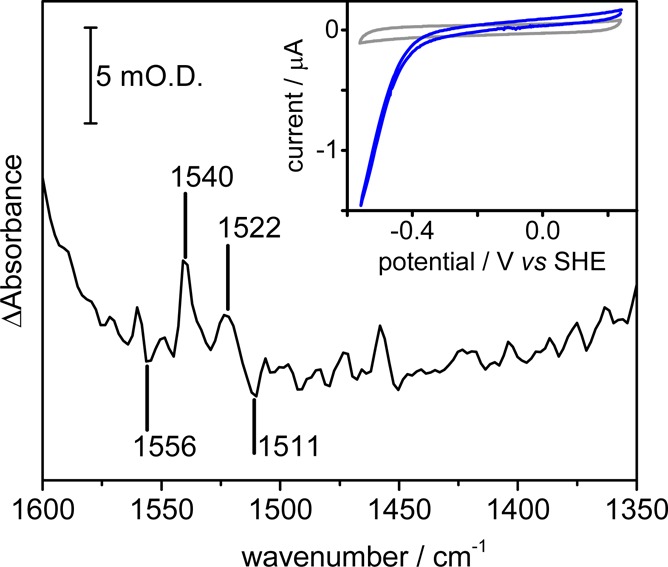
Spectroelectrochemistry of NuoF cell-free extract adsorbed on carbon black particles. Oxidized minus reduced difference spectrum, recorded in the microspectroscopy cell, showing spectroscopic changes in the flavin region. The difference spectrum was calculated from spectra collected at +0.242 and −0.588 V as an average of 1024 interferograms. The inset shows a catalytic cyclic voltammogram (blue) of NuoF CE adsorbed on a pyrolytic graphite “edge” rotating disc electrode rotating at 2000 rpm in the presence of both NAD+ and NADH, compared to a cyclic voltammogram recorded in the absence of NuoF CE (gray). Potassium phosphate buffer, pH 6, containing 100 mM KCl was used as background electrolyte.
We have developed a combined synchrotron microspectroscopic-electrochemical technique which offers significant advantages over other techniques for probing the redox chemistry of electrode-immobilized redox enzymes in situ. We have demonstrated that the technique can be applied to flavoproteins using NuoF CE, a small fragment of respiratory complex 1 from E. coli. Although a relatively large supporting electrode was used in this work, spectroscopic data were collected from a 25 × 25 μm2 area, highlighting the scope for further miniaturization by depositing particles onto microelectrodes (Figure S4). This will allow the electrochemical time constant to be lowered to approximately 50 μs, better than that achievable by conventional freeze-quench or stopped flow methods. Protein adsorption on carbon electrodes can be very robust (we have previously demonstrated stability for several days with no damage to protein structure or electrochemical response),25 and their electrochemically triggered processes are generally very repeatable and reproducible, meaning it will be possible to improve spectroscopic sensitivity further through use of modulation excitation spectroscopy and phase sensitive detection. This will allow time-resolved spectroscopic studies of chemical and structural changes at redox sites within proteins under the precise electrochemical control provided by protein film electrochemistry.
Acknowledgments
The work of K.A.V., P.A.A., H.A.R., and I.J.M. was supported by the European Research Council (EnergyBioCatalysis-ERC-2010-StG-258600), Engineering and Physical Sciences Research Council (EPSRC, EP/K031503/1, and INSPIRE award EP/J015202/1), and the Biotechnology and Biological Sciences Research Council (BB/L009722/1). H.A.R. was supported by a postdoctoral fellowship from the European Molecular Biology Organization. J.Q. and T.H.L. held EPSRC DTA awards EP/J500495/1 and EP/L505031/1, respectively. R.H. is supported by Ministerio de Ciencia y Tecnología, Universidad de Costa Rica, and Lincoln College, Oxford. M.-W.C. was supported by an Oxford Clarendon Fund Scholarship and A.J.H. by the John Fell Fund. S.N. holds a Marie Skłodowska-Curie actions individual fellowship (659306). We are grateful to Dr Alizé Pennec for assistance with isolation of NuoF and Prof. Luet Wong for access to molecular biology laboratories. We are grateful to Dr Miguel Ramirez for useful discussions. We thank Diamond Light Source for access to the MIRIAM beamline B22 (SM9029-1 and SM11611-1) that contributed to the results presented here.
Supporting Information Available
The Supporting Information is available free of charge on the ACS Publications website at DOI: 10.1021/acs.analchem.6b00898.
Additional experimental data, including details of the preparation of cell-free extract of NuoF subunit of E. coli complex I; scale diagram of the microspectroscopy cell; comparison of electrochemical response of the microspectroscopy and ATR-IR cells; image of the particle-modified electrode used to record data presented in Figure 4; difference spectra showing the reproducibility of spectral data in the microspectroscopic cell; NuoF CE difference spectrum compared to the baseline noise level; absence of flavin signal in cell-free extract deficient in NuoF; absence of electrocatalytic NAD+NADH cycling in cell-free extract deficient in NuoF (PDF)
Author Contributions
The manuscript was written through contributions of all authors. All authors have given approval to the final version of the manuscript.
The authors declare no competing financial interest.
Supplementary Material
References
- Martin M. C.; Dabat-Blondeau C.; Unger M.; Sedlmair J.; Parkinson D. Y.; Bechtel H. A.; Illman B.; Castro J. M.; Keiluweit M.; Buschke D.; Ogle B.; Nasse M. J.; Hirschmugl C. J. Nat. Methods 2013, 10 (9), 861–864. 10.1038/nmeth.2596. [DOI] [PubMed] [Google Scholar]
- Mattson E. C.; Unger M.; Sedlmair J.; Nasse M.; Aboualizadeh E.; Alavi Z.; Hirschmugl C. J.. Widefield FT-IR 2D and 3D Imaging at the Microscale Using Synchrotron Radiation. In Infrared and Raman Spectroscopic Imaging; Wiley-VCH Verlag GmbH & Co. KGaA: Hoboken, NJ, 2014; pp 585–618. [Google Scholar]
- Quaroni L.; Zobi F.. Cellular Imaging with Metal Carbonyl Complexes. In Inorganic Chemical Biology; John Wiley & Sons, Ltd: Hoboken, NJ, 2014; pp 149–182. [Google Scholar]
- Clède S.; Policar C. Chem. - Eur. J. 2015, 21 (3), 942–958. 10.1002/chem.201404600. [DOI] [PubMed] [Google Scholar]
- Quaroni L.; Obst M.; Nowak M.; Zobi F. Angew. Chem., Int. Ed. 2015, 54 (1), 318–322. 10.1002/anie.201407728. [DOI] [PubMed] [Google Scholar]
- Clède S.; Lambert F.; Sandt C.; Gueroui Z.; Delsuc N.; Dumas P.; Vessières A.; Policar C. Biotechnol. Adv. 2013, 31 (3), 393–395. 10.1016/j.biotechadv.2012.01.023. [DOI] [PubMed] [Google Scholar]
- Dudala J.; Bialas M.; Surowka A.; Bereza-Buziak M.; Hubalewska-Dydejczyk A.; Budzynski A.; Pedziwiatr M.; Kolodziej M.; Wehbe K.; Lankosz M. Analyst 2015, 140 (7), 2101–2106. 10.1039/C4AN01891E. [DOI] [PubMed] [Google Scholar]
- Quaroni L.; Zlateva T.; Sarafimov B.; Kreuzer H. W.; Wehbe K.; Hegg E. L.; Cinque G. Biophys. Chem. 2014, 189, 40–48. 10.1016/j.bpc.2014.03.002. [DOI] [PubMed] [Google Scholar]
- Bye J. W.; Meliga S.; Ferachou D.; Cinque G.; Zeitler J. A.; Falconer R. J. J. Phys. Chem. A 2014, 118 (1), 83–88. 10.1021/jp407410g. [DOI] [PubMed] [Google Scholar]
- Léger C.; Elliott S. J.; Hoke K. R.; Jeuken L. J. C.; Jones A. K.; Armstrong F. A. Biochemistry 2003, 42 (29), 8653–8662. 10.1021/bi034789c. [DOI] [PubMed] [Google Scholar]
- Léger C.; Bertrand P. Chem. Rev. 2008, 108 (7), 2379–2438. 10.1021/cr0680742. [DOI] [PubMed] [Google Scholar]
- Male L.; Marritt S. J.; Berks B. C.; Cheesman M. R.; van Wonderen J. H.; George S. J.; Butt J. N. Theor. Chem. Acc. 2008, 119 (1), 107–111. 10.1007/s00214-006-0233-y. [DOI] [Google Scholar]
- Ash P. A.; Vincent K. A. Chem. Commun. 2012, 48 (10), 1400–1409. 10.1039/C1CC15871F. [DOI] [PubMed] [Google Scholar]
- Sezer M.; Millo D.; Weidinger I. M.; Zebger I.; Hildebrandt P. IUBMB Life 2012, 64 (6), 455–464. 10.1002/iub.1020. [DOI] [PubMed] [Google Scholar]
- Pershad H. R.; Duff J. L. C.; Heering H. A.; Duin E. C.; Albracht S. P. J.; Armstrong F. A. Biochemistry 1999, 38 (28), 8992–8999. 10.1021/bi990108v. [DOI] [PubMed] [Google Scholar]
- Schaming D.; Renault C.; Tucker R. T.; Lau-Truong S.; Aubard J.; Brett M. J.; Balland V.; Limoges B. Langmuir 2012, 28 (39), 14065–14072. 10.1021/la302913j. [DOI] [PubMed] [Google Scholar]
- Kemp G. L.; Marritt S. J.; Xiaoe L.; Durrant J. R.; Cheesman M. R.; Butt J. N. Biochem. Soc. Trans. 2009, 37 (2), 368–372. 10.1042/BST0370368. [DOI] [PubMed] [Google Scholar]
- Renault C.; Andrieux C. P.; Tucker R. T.; Brett M. J.; Balland V.; Limoges B. J. Am. Chem. Soc. 2012, 134 (15), 6834–6845. 10.1021/ja301193s. [DOI] [PubMed] [Google Scholar]
- Krzemiński Ł.; Ndamba L.; Canters G. W.; Aartsma T. J.; Evans S. D.; Jeuken L. J. C. J. Am. Chem. Soc. 2011, 133 (38), 15085–15093. 10.1021/ja204891v. [DOI] [PubMed] [Google Scholar]
- Akkilic N.; Kamran M.; Stan R.; Sanghamitra N. J. M. Biosens. Bioelectron. 2015, 67, 747–751. 10.1016/j.bios.2014.07.051. [DOI] [PubMed] [Google Scholar]
- Ataka K.; Stripp S. T.; Heberle J. Biochim. Biophys. Acta, Biomembr. 2013, 1828 (10), 2283–2293. 10.1016/j.bbamem.2013.04.026. [DOI] [PubMed] [Google Scholar]
- Kozuch J.; Weichbrodt C.; Millo D.; Giller K.; Becker S.; Hildebrandt P.; Steinem C. Phys. Chem. Chem. Phys. 2014, 16 (20), 9546–9555. 10.1039/c4cp00167b. [DOI] [PubMed] [Google Scholar]
- Silveira C. M.; Quintas P. O.; Moura I.; Moura J. J. G.; Hildebrandt P.; Almeida M. G.; Todorovic S. PLoS One 2015, 10 (6), e0129940. 10.1371/journal.pone.0129940. [DOI] [PMC free article] [PubMed] [Google Scholar]
- Todorovic S.; Hildebrandt P.; Martins L. O. Phys. Chem. Chem. Phys. 2015, 17 (18), 11954–11957. 10.1039/C5CP01283J. [DOI] [PubMed] [Google Scholar]
- Hidalgo R.; Ash P. A.; Healy A. J.; Vincent K. A. Angew. Chem., Int. Ed. 2015, 54 (24), 7110–7113. 10.1002/anie.201502338. [DOI] [PMC free article] [PubMed] [Google Scholar]
- Ash P. A.; Liu J.; Coutard N.; Heidary N.; Horch M.; Gudim I.; Simler T.; Zebger I.; Lenz O.; Vincent K. A. J. Phys. Chem. B 2015, 119 (43), 13807–13815. 10.1021/acs.jpcb.5b04164. [DOI] [PubMed] [Google Scholar]
- Zhou Z.-Y.; Lin S.-C.; Chen S.-P.; Sun S.-G. Electrochem. Commun. 2005, 7 (5), 490–495. 10.1016/j.elecom.2005.03.001. [DOI] [Google Scholar]
- Zhou Z.-Y.; Sun S.-G. Electrochim. Acta 2005, 50 (25–26), 5163–5171. 10.1016/j.electacta.2005.03.063. [DOI] [Google Scholar]
- Rosendahl S. M.; Borondics F.; May T. E.; Pedersen T. M.; Burgess I. J. Rev. Sci. Instrum. 2011, 82 (8), 083105. 10.1063/1.3624693. [DOI] [PubMed] [Google Scholar]
- Rosendahl S. M.; Borondics F.; May T. E.; Burgess I. J. Anal. Chem. 2013, 85 (18), 8722–8727. 10.1021/ac401799z. [DOI] [PubMed] [Google Scholar]
- Ghisla S.; Edmondson D. E.. Flavin Coenzymes. In eLS; John Wiley & Sons, Ltd: Hoboken, NJ, 2001. [Google Scholar]
- Spexard M.; Immeln D.; Thöing C.; Kottke T. Vib. Spectrosc. 2011, 57 (2), 282–287. 10.1016/j.vibspec.2011.09.002. [DOI] [Google Scholar]
- El Khoury Y.; Van Wilderen L. J. G. W.; Bredenbeck J. J. Chem. Phys. 2015, 142 (21), 212416. 10.1063/1.4916916. [DOI] [PubMed] [Google Scholar]
- Quinson J.; Hidalgo R.; Ash P. A.; Dillon F.; Grobert N.; Vincent K. A. Faraday Discuss. 2014, 172 (0), 473–496. 10.1039/C4FD00058G. [DOI] [PubMed] [Google Scholar]
- Ly H. K.; Wisitruangsakul N.; Sezer M.; Feng J.-J.; Kranich A.; Weidinger I. M.; Zebger I.; Murgida D. H.; Hildebrandt P. J. Electroanal. Chem. 2011, 660 (2), 367–376. 10.1016/j.jelechem.2010.12.020. [DOI] [PubMed] [Google Scholar]
Associated Data
This section collects any data citations, data availability statements, or supplementary materials included in this article.


