Abstract
Background
Hypertrophic cardiomyopathy (HCM) is caused by mutations in different structural genes and induces pathological hypertrophy with sudden cardiac death as a possible consequence. HCM can be separated into hypertrophic non-obstructive and obstructive cardiomyopathy (HNCM/HOCM) with different clinical treatment approaches. We here distinguished between HNCM, HOCM, cardiac amyloidosis and aortic stenosis by using microRNA profiling and investigated potential interactions between circulating miRNA levels and the most common mutations in MYH7and MYBPC3 genes.
Methods
Our study included 4 different groups: 23 patients with HNCM, 28 patients with HOCM, 47 patients with aortic stenosis and 22 healthy controls. Based on previous findings, 8 different cardiovascular known microRNAs (miR-1, miR-21, miR-29a, miR-29b, miR-29c, miR-133a, miR-155 and miR-499) were studied in serum of all patients and compared with clinically available patient data.
Results
We found miR-29a levels to be increased in patients with HOCM and correlating markers of cardiac hypertrophy. This was not the case in HNCM patients. In contrast, we identified miR-29c to be upregulated in aortic stenosis but not the other patient groups. ROC curve analysis of miR-29a/c distinguished between HOCM patients and aortic stenosis patients. MiR-29a and miR-155 levels discriminated HNCM patients from patients with senile cardiac amyloidosis. MiR-29a increased mainly in HOCM patients with a mutation in MYH7, whereas miR-155 was decreased in hypertrophic cardiomyopathy patients with a mutation in MYBPC3.
Conclusion
We demonstrated that miR-29a and miR-29c show a specific signature to distinguish between aortic stenosis, hypertrophic non-obstructive and obstructive cardiomyopathies and thus could be developed into clinically useful biomarkers.
Keywords: MicroRNA, Hypertrophic cardiomyopathies, Aortic stenosis, Amyloidosis, Biomarker, Diagnosis
1. Introduction
Hypertrophic cardiomyopathy is a heterogeneous monogenic heart disease with important pathophysiological consequences such as sudden cardiac death, pressure-overload induced cardiac remodeling, fibrosis, atrial fibrillation and in later stages heart failure [1]. There is prevalence of about 1:500 in the general population and more than 1.400 mutations in a multitude of different genes have been identified (for example in MYH7 and MYBPC3) demonstrating the diversity and complexity of this disease. Histological analyses in hearts of affected individuals reveal changes such as cardiomyocyte hypertrophy, fiber disarray and processes of fibrosis. The clinical appearance includes inconspicuous symptoms, heart sounds, palpitations or dyspnea, but also sudden cardiac death, the most fatal complication of this disease [2]. It is also important to differentiate between hypertrophic obstructive cardiomyopathy (HOCM) and hypertrophic non-obstructive cardiomyopathy (HNCM) as treatment strategies differ between these forms [2]. The obstructive form (HOCM) shows a pathological left ventricular outflow tract gradient because of asymmetric septum hypertrophy. Recently, first evidence was provided for microRNAs (miRNAs/miRs), to be directly or indirectly associated to HCM both in blood and cardiac tissues [3,4]. MiRNAs are short ribonucleic acids orchestrating gene expression post-transcriptionally. These regulatory molecules influence cell differentiation and modulation both in a physiological and pathophysiological way. In cardiovascular diseases they are relevant for processes like cardiac hypertrophy, ischemia, fibrosis, arteriosclerosis and heart failure [5–8]. Further miRNAs have a crucial role as biomarkers and reserve functions as therapeutic targets in cardiovascular diseases. Although one initial paper described some changes in circulating miRNAs in patients with HCM [4], there is no information about the discrimination between HNCM and HOCM, nor to the underlying genetic mutation. The aim of the present study was to identify circulating miRNAs differentiating between hypertrophic obstructive cardiomyopathy, hypertrophic non-obstructive cardiomyopathy and patients with aortic stenosis. We also compared miRNA changes in comparison with the two most occurring gene mutations MYH7 and MYBPC3.
2. Methods
2.1. Patient data
Patients with HNCM/HOCM were recruited from the Special Outpatient Clinic for HCM of the Department of Cardiology and Angiology (Hannover Medical School). Patients with aortic stenosis were recruited within the Department of Cardiology and Angiology (Hannover, Germany) during a planned hospital stay for transcatheter aortic valve implantation (TAVI). Blood was taken before TAVI implantation. All patients gave written informed consent and the study was approved by the local ethical committee of Hannover Medical School. The diagnosis of HCM was based on the recent European guidelines for the diagnosis and management of hypertrophic cardiomyopathies [2] and mainly included presence of a hypertrophic cardiac septum (≥15 mm) or combined presence of a hypertrophic cardiac septum (≥13 mm) and positive family history and/or ECG abnormalities. Left ventricular outflow tract obstruction was defined as a peak Doppler LV outflow tract gradient of ≥ 30 mm Hg.
2.2. DNA Analysis
Genomic DNA of the patients was isolated using the QIAamp DNA Blood Mini Kit from Qiagen. All coding exons and flanking intronic regions of the MYBPC3 (NM_000256.3) and MYH7 (NM_000257.2) genes were amplified by PCR (primer sequences and PCR conditions can be obtained from the authors upon request). Sequencing of all amplicons was carried out with BigDye Terminator DNA sequencing kit (version 3.1) and on an ABI 3130xl Genetic analyzer.
2.3. RNA isolation from patient serum
Blood serum samples were centrifuged at 2000 x g for 10 minutes at room temperature to separate corpuscular components. The liquid supernatant was frozen in RNase/DNase clean tubes at −80 ° C. After thawing on ice, RNA was isolated with miRNeasy Mini Kit (Qiagen) according to the manual. 30 μl of RNA-solution were obtained from an amount of 100 μl patients’ serum. Before the RNA isolation, Caenorhabditis elegans miR-39 was added as spike-in RNA for normalization as described [9,10].
2.4. Reverse transcription and realtime PCR-based amplification of miRNAs
Isolated RNA was transcribed to complementary DNA (cDNA) using TagMan MicroRNA Reverse Transcription Kit (Applied Biosystems) according to manufacturer’s manuals. Hsa-miR-1, hsa-miR-21, hsa-miR-29a, hsa-miR-29b, hsa-miR-29c, hsa-miR-133a, hsa-miR-155, hsa-miR-499 and cel-miR-39 primers (control) were used. Afterwards the different miRNAs were amplified with quantitative real-time PCR (qRT-PCR) utilizing specific TagMan MicroRNA assays (Applied Biosystems). Normalization to cel-miR-39 was applied as described (Table 4) [9,10].
Table 4.
Primer sequences.
| microRNA | sequence |
|---|---|
| hsa-mir-1-3p | UGGAAUGUAAAGAAGUAUGUAU |
| hsa-miR-21-5p | UAGCUUAUCAGACUGAUGUUGA |
| hsa-miR-29a-3p | UAGCACCAUCUGAAAUCGGUUA |
| hsa-miR-29b-3p | UAGCACCAUUUGAAAUCAGUGUU |
| hsa-miR-29c-3p | UAGCACCAUUUGAAAUCGGUUA |
| hsa-miR-133a-3p | UUUGGUCCCCUUCAACCAGCUG |
| hsa-miR-155-5p | UUAAUGCUAAUCGUGAUAGGGGU |
| hsa-miR-499 | UUAAGACUUGCAGUGAUGUUUAA |
| cel-miR-39-3p | UCACCGGGUGUAAAUCAGCUUG |
2.5. Statistical evaluation
Multiple comparison tests upon ANOVA were used to compare the regulation of miRNAs between control and different patients groups. Results were illustrated as mean plus standard error of the mean (SEM). Unpaired t-test was used to compare the percentage of gene mutations in HNCM/HOCM. Supplementary correlation based on Pearson was used to compare the amplification of miRNAs with echocardiographic parameters. Graph Pad Prism was used for analysis and illustrative presentations.
3. Results
The patient characteristics are described in Table 1. Based on the diagnostic criteria described in the Methods section, we included 28 patients with hypertrophic obstructive cardiomyopathy (HOCM) and 23 with hypertrophic non-obstructive cardiomyopathy (HNCM). As further controls we used healthy control individuals (n = 22) as well as patients with cardiac hypertrophy due to severe aortic stenosis (AS; n = 47). To further assess for the specificity of miRNA expression changes, we analyzed a cohort of patients with senile cardiac amyloidosis (SCA; n = 9) representing another cohort of patients with cardiomyopathy of different etiology. The serum samples from this cohort were obtained from patients at the outpatient clinic at Columbia University Medical Center. The diagnosis was made clinically and confirmed by endomyocardial biopsy followed by histology using trichrome, congo red and crystal violet staining (Table 1). HNCM and HOCM patients had significantly greater wall thickness when compared to patients with AS as well as more palpitations. Patients with HOCM had significantly higher left ventricular outflow tract gradients and clinically evaluated mitral valve murmurs than patients with HNCM or AS, whereas dyspnoea was most frequent in patients with AS and HOCM compared to patients with HNCM (Table 2). There were no differences between the numbers of syncopes, peripheral edema or positive family history between HOCM and HNCM patients. There also were no differences between left ventricular end-diastolic dimensions between these two groups (Table 2). Information about the presence of mutations in the MHY7 and MYBPC3 genes was available from 25 patients; more precisely in 17 patients with HOCM and 8 with HNCM. The percentage of MYBPC3 mutations was higher in HNCM patients, whereas mutations in MYH7 were more frequent among HOCM patients (Table 3). However, these differences were statistically not significant. There was no difference in the medical treatment for the three groups for beta blockers, ACE inhibitors and AT receptor antagonists. However, there was significant lower use of diuretics in HOCM and HNCM versus AS patients (Table 2).
Table 1.
Overview: Different patient groups.
| control | HNCM | HOCM | aortic stenosis | amyloidosis | |
|---|---|---|---|---|---|
| n | 22 (m = 12; f = 10) | 23 (m = 17; f = 6) | 28 (m = 9; f = 19) | 47 (m = 24; f = 23) | 9 (m = 9; f = 0) |
| mean age [years] | 42.45 | 56.17 | 56.29 | 79.91 | 78.00 |
| BMI [kg/m2] | – | 28.59 (n = 20) | 28.11 (n = 25) | – | – |
n = number of existing data.
BMI = body mass index.
m = male.
f = female.
Table 2.
Echocardiographic data, clinical symptoms and drugs.
| Echocardiography | HNCM | HOCM | AS | P-value
|
||
|---|---|---|---|---|---|---|
| HNCM:HOCM | HNCM:AS | HOCM:AS | ||||
| IVS [mm] | 19.5 (n = 22) | 20.2 (n = 25) | 13.8 (n = 43) | ns | **** | *** |
| LVEDD [mm] | 46.5 (n = 22) | 43.6 (n = 27) | 48.4 (n = 44) | ns | ns | * |
| Aortic root [mm] | 31.5 (n = 15) | 31.7 (n = 25) | 31.7 (n = 35) | ns | ns | ns |
| LVOT-gr. max. [mmHg] | 12.7 (n = 11) | 95.7 (n = 23) | 2.9 (n = 31) | **** | ns | **** |
| LVEF — normal (%) | 72.7 (n = 22) | 100.0 (n = 27) | 59.1 (n = 44) | ns | ns | *** |
| LVEF — reduced (%) | 27.3 (n = 22) | 0.00 (n = 27) | 40.9 (n = 44) | ns | ns | *** |
| LVEF — diast. dysfct. (%) | 33.3 (n = 21) | 51.9 (n = 27) | 18.2 (n = 44) | ns | ns | ** |
| RVEF — normal (%) | 85.0 (n = 20) | 92.0 (n = 25) | 86.1 (n = 36) | ns | ns | ns |
| RVEF — reduced (%) | 15.0 (n = 20) | 8.0 (n = 25) | 13.9 (n = 36) | ns | ns | ns |
| Clinical symptoms | ||||||
| Syncopes (%) | 15.0 (n = 20) | 24.0 (n = 25) | 19.6 (n = 40) | ns | ns | ns |
| Hypotonic RR regul. (%) | 0.0 (n = 19) | 16.7 (n = 24) | – | ns | – | – |
| Positive family history (%) | 31.8 (n = 22) | 23.1 (n = 26) | – | ns | – | – |
| Dyspnoea (%) | 45.5 (n = 22) | 74.1 (n = 27) | 88.9 (n = 45) | * | *** | ns |
| Angina pectoris (%) | 9.1 (n = 22) | 25.9 (n = 27) | 42.9 (n = 42) | ns | * | ns |
| Palpitations (%) | 45.5 (n = 22) | 55.6 (n = 27) | 9.5 (n = 21) | ns | * | ** |
| Peripheral edema (%) | 27.3 (n = 22) | 22.2 (n = 27) | 22.5 (n = 40) | ns | ns | ns |
| Diabetes mellitus (%) | 18.2 (n = 22) | 11.1 (n = 27) | 25.5 (n = 47) | ns | ns | ns |
| Systolic murmur (%) | 27.3 (n = 22) | 73.1 (n = 26) | 83.0 (n = 47) | *** | **** | ns |
| Mitral valve murmur (%) | 23.8 (n = 21) | 61.5 (n = 26) | 12.8 (n = 47) | ** | ns | **** |
| Drugs | ||||||
| Beta blockers (%) | 76.2 (n = 21) | 74.1 (n = 27) | 66.0 (n = 47) | ns | ns | ns |
| ACE inhibitors (%) | 38.1 (n = 21) | 40.7 (n = 27) | 66.0 (n = 47) | ns | ns | ns |
| AT1 inhibitors (%) | 23.8 (n = 21) | 7.4 (n = 27) | 21.3 (n = 47) | ns | ns | ns |
| Diuretics (%) | 38.1 (n = 21) | 44.4 (n = 27) | 87.2 (n = 47) | ns | **** | *** |
| Calcium antagonists (%) | 23.8 (n = 21) | 18.5 (n = 27) | 51.1 (n = 47) | ns | ns | * |
n = number of existing data; IVS = interventricular septum size; LVEDD = left ventricular enddiastolic diameter; LVOT-gr. max. = left ventricular outflow tract gradient maximum; AT1 = angiotensin I.
LVEF/RVEF = left/right ventricular ejection fraction; Hypotonic RR regul. = hypotonic blood pressure regulation; diast. dysfct. = diastolic dysfunction; ACE = angiotensin-converting-enzyme.
p < 0.05,
p < 0.01,
p < 0.001,
p < 0.0001;
ns = not significant (p ≥ 0.05).
Table 3.
Gene mutations in HNCM and HOCM patients.
| HNCM | HOCM | P-value | |
|---|---|---|---|
| n (tested) | 8 | 17 | |
| n (MYH7/MYBPC3) | 6 | 12 | |
| % | 75.00 | 70.59 | ns |
| n (MYH7) | 2 | 7 | |
| % percentage | 25.00 | 41.18 | ns |
| n (MYBPC3) | 4 | 5 | |
| % | 50.00 | 29.41 | ns |
n (tested) = patients tested for any mutation.
n (MYH7/MYBPC3) = patients positive tested for MYH7 and MYBPC3.
n (MYH7) = patients positive tested for MYH7.
n (MYBPC3) = patients positive tested for MYBPC3.
ns = not significant (p ≥ 0.05).
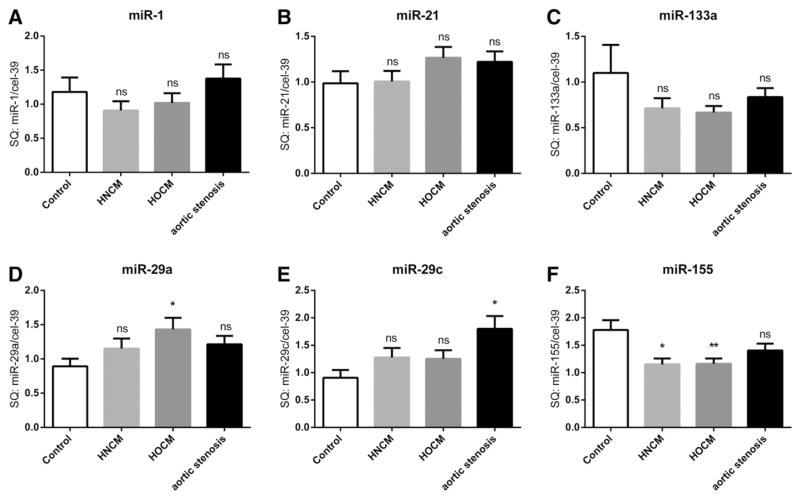
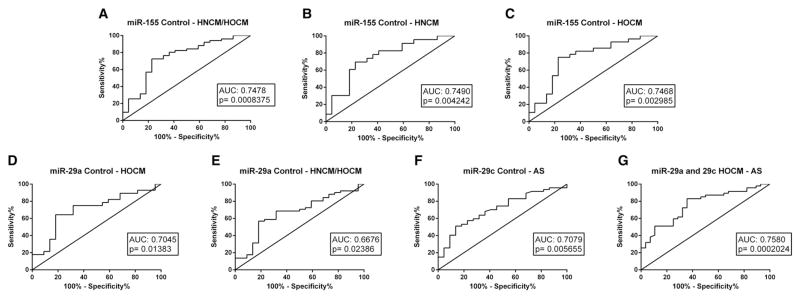
We next profiled a selection of literature-based miRNA biomarkers in serum of all patients, which have been described to play a significant role in cardiac remodeling (miR-1, miR-21, miR-29a, miR-29b, miR-29c, miR-133a, miR-155, miR-499) [11]. There was no change in circulating levels of miR-1, miR-21 and miR-133a in patients with HNCM, HOCM or AS when compared with controls (Fig. 1. A,B,C). In contrast, there were differences of members of the miR-29 family and of miR-155 among the four groups (Fig. 1. D,E,F); miR-29a was only significantly upregulated in patients with HOCM, whereas in patients with AS only miR-29c was upregulated (Fig. 1. D,E). In contrast, circulating levels of miR-155 were downregulated in HNCM and HOCM but not AS patients (Fig. 1. F). Using ROC curve analyses we identified miR-155 levels to identify patients with HCM (both with and without obstruction), whereas miR-29a was able to significantly identify HOCM patients and miR-29c AS patients (Fig. 2. A, D, F). When combining both miR-29a and miR-29c into ROC curve analyses, it also was possible to discriminate between HOCM and AS patients (Fig. 2G).
Fig. 1.
microRNA levels in serum of patients with HOCM, HNCM, AS and in controls. SQ = standard quantity * = p < 0.05, ** = p < 0.01, *** = p < 0.001, ns = not significant (p ≥ 0.05). HOCM = hypertrophic obstructive cardiomyopathy; HNCM = hypertrophic non-obstructive cardiomyopathy; AS = aortic stenosis.
Fig. 2.
ROC curve analysis of single microRNAs (miR-29a, miR-29c, miR-155) and combined microRNAs (miR-29a and miR-29c) to distinguish between different groups (Control with both HNCM/HOCM, HNCM, HOCM, AS; and HOCM with AS). HOCM = hypertrophic obstructive cardiomyopathy; HNCM = hypertrophic non-obstructive cardiomyopathy; AS = aortic stenosis.
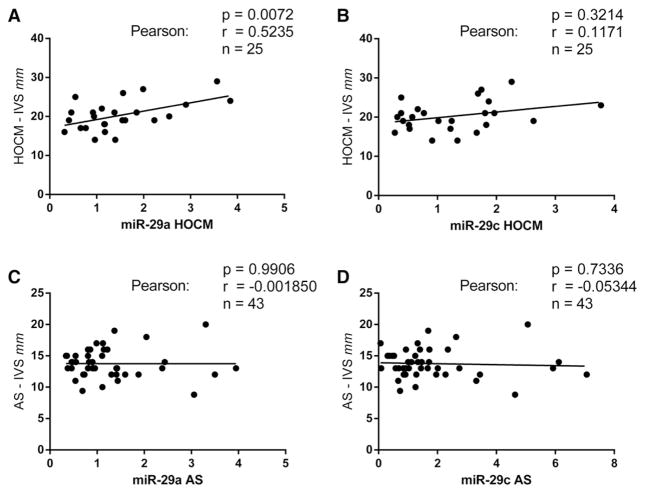
Interestingly, circulating miR-29a levels positively correlated with interventricular septum thickness as a measure of cardiac hypertrophy (Fig. 3A; p = 0.01). No significant correlations were found with circulating levels of miR-29a or miR-29c in patients with AS (Fig. 3C, D), nor were found correlations between miR-29c levels and interventricular septum thickness in HOCM (Fig. 3B).
Fig. 3.
Correlation analysis of the expression of single microRNAs (miR-29a, miR-29c) and the thickness of interventricular septum (IVS) of patients affected with HOCM and AS. Abscissa = standard quantity of miR-29a/miR-29c in HOCM/AS. HOCM = hypertrophic obstructive cardiomyopathy; AS = aortic stenosis.
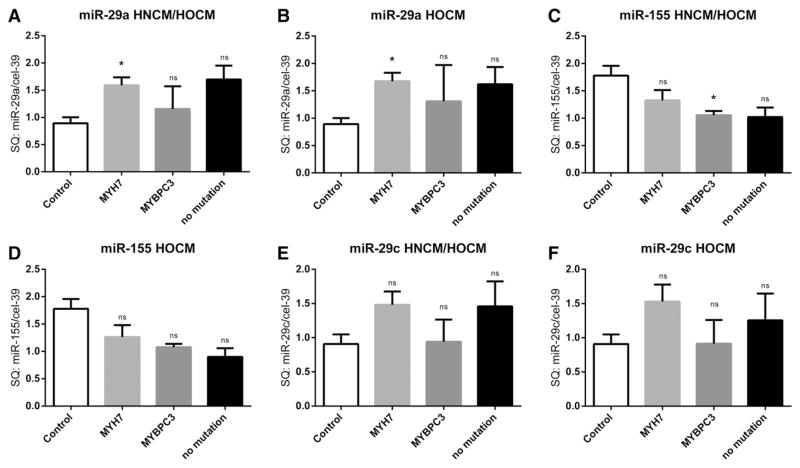
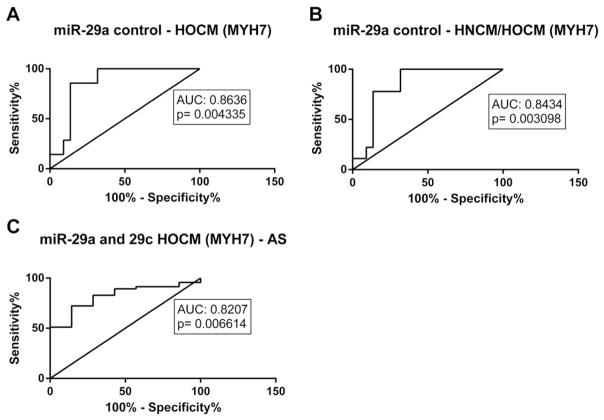
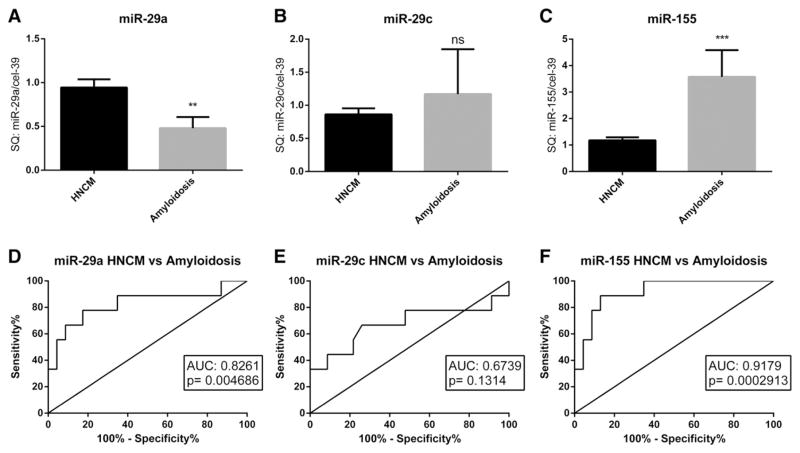
We next studied a potential association of the two major underlying genetic sarcomeric mutations (in the MHY7 and MYBPC3 genes) in HOCM patients on levels of circulating miRNAs. Interestingly, miR-29a levels were highest in HOCM patients with a sarcomeric mutation in the MYH7 gene, whereas patients with a mutation in the MYBPC3 gene did not show altered miR-29a levels (Fig. 4A,B). In strong contrast, patients with a mutation in the MYBPC3 gene had significantly lower miR-155 levels when compared to controls (Fig. 4C). MicroRNA-29c levels tended to be higher in HOCM patients with a mutation in the MYH7 gene, although this finding did not reach statistical significance (Fig. 4F). Interestingly, when we performed ROC analysis specifically between HCM patients with a mutation in the MYH7 gene with controls or AS patients, we found an even better discriminative capacity of miR-29a levels (Fig. 5A–C). To further test disease specificity of the afore tested miRNA markers, we compared miR-29a, miR-29c and miR-155 levels in serum of HNCM patients with that of another cohort of patients with cardiac hypertrophy, e.g. patients with senile cardiac amyloidosis. Interestingly, both miR-29a and miR-155 levels were able to significantly discriminate between HNCM and SCA patients, showing disease specificity of these markers (Fig. 6A–F).
Fig. 4.
Expression levels of miR-29a, miR-29c and miR-155 in the “no mutation” group (including DNA analyzed HNCM and/or HOCM patients without a mutation in MYH7 and MYBPC3), in HNCM and HOCM patients affected by mutations in MYH7 or MYBPC3 gene were compared to control group. * = p < 0.05, ** = p < 0.01, *** = p < 0.001, ns = not significant (p ≥ 0.05); SQ = standard quantity. HOCM = hypertrophic obstructive cardiomyopathy; HNCM = hypertrophic non-obstructive cardiomyopathy; AS = aortic stenosis. MYH7 = beta myosin heavy chain; MYBPC3 = cardiac myosin binding protein C.
Fig. 5.
ROC curve analysis of microRNAs (miR-29a, miR-29c) in HCM patients with a mutation in the MYH7 gene and control patients or patients with aortic stenosis (AS). HOCM = hypertrophic obstructive cardiomyopathy; MYH7 = beta myosin heavy chain.
Fig. 6.
Comparison (A–C) and ROC curve analysis (D–F) of miR-29a, miR-29c and miR-155 serum levels between patients with hypertrophic non-obstructive cardiomyopathy (HNCM) and patients with senile cardiac amyloidosis (SCA). ** = p < 0.01, *** = p < 0.001, ns = not significant (p ≥ 0.05); SQ = standard quantity.
4. Discussion
In our current study we analyzed different microRNAs mainly involved in cardiac diseases, to identify specific blood-based biomarkers differentiating between hypertrophic non-obstructive cardiomyopathy, hypertrophic obstructive cardiomyopathy and also aortic stenosis. It was previously shown that miR-29a is upregulated in patients with hypertrophic cardiomyopathies [4]. However, we here show distinct differences between the two different forms of hypertrophic cardiomyopathy, i.e. miR-29a was significantly increased in patients with hypertrophic obstructive cardiomyopathy, but not in patients with hypertrophic non-obstructive cardiomyopathy. Moreover, in patients with hypertrophic obstructive cardiomyopathy we identified a tight correlation between miR-29a and the size of interventricular septum (suggesting degree of cardiac hypertrophy and fibrotic processes) as also identified by Roncarati et al. [4] but not in patients with no obstruction. This suggests that the high intraventricular pressure caused by the obstruction may increase active secretion of miR-29a from the cardiac muscle and thus put forward this miRNAs as a potential biomarker for hypertrophic obstructive cardiomyopathy. The myocardial infarction and chronic heart failure associated microRNAs miR-1 and miR-133a showed no differences in different patients group, and miR-499 was not measurable at all [12,13] suggesting no active secretion under non-ischemic conditions. MiR-29b, another described antifibrotic microRNA [14] was not measurable in our patient cohort, whereas the other forms miR-29a and miR-29c were clearly detectable.
MiR-155 was significant decreased both in hypertrophic non-obstructive cardiomyopathy and in hypertrophic obstructive cardiomyopathy. MiR-155 is known in inflammatory processes, e.g. during cardiac rejection after transplantation [15], as well as in oncogenic diseases [16]. Although miR-155 has been described as an inducer for hypertrophic processes [17] we found down-regulation of miR-155 levels to be specific for both hypertrophic non-obstructive and obstructive cardiomyopathies.
Interestingly, we identified another member of the miR-29 family, miR-29c, to be significantly increased in patients with aortic stenosis. MiR-29c is known as an anti-fibrotic associated miRNA in myocardial fibrosis [18] and a connection to cutaneous melanoma was also reported [19]. In our studies we demonstrated miR-29c as a possible marker for aortic stenosis, and especially in combination with miR-29a we identified a specific signature to discriminate between hypertrophic obstructive cardiomyopathy and aortic stenosis which clinically can be sometimes challenging.
In addition, our study describes a connection of the most common gene mutations in hypertrophic cardiomyopathies (in MYH7 and MYBPC3 genes) with alterations of circulating miRNA levels. Our results suggest that there could be an inter-relation between MYH7 gene mutation and miR-29a levels as well as and between MYBPC3 gene mutation and miR-155 levels. Indeed, a link between miRNAs and a mutation in the MYH7 gene was already shown in tissues of patients with hypertrophic cardiomyopathies [20].
Our study has several limitations: The age and gender matching was unbalanced, because of different age/gender incidences in the different diseases. Besides, it could not be clarified exactly which parts/cells of the heart were responsibility for changes in the expression/secretion of different miRNAs. Also, not all patients agreed for genetic testing and thus this information is not available for all tested subjects. The complexity and costs of analyzing expression of miRNAs is a further problem for clinical usability, too. However, there are many groups, start-up companies and industrial players currently developing less complicated miRNA biomarker “kits” that together with emerging technologies such as direct hybridization techniques and others [21] likely will find their way into clinical practice.
5. Conclusion
In conclusion, we demonstrated that miR-29a, miR-29c and miR-155 have a specific signature to distinguish between aortic stenosis, hypertrophic non-obstructive and obstructive cardiomyopathies as well as senile cardiac amyloidosis and thus could be developed into clinically useful biomarkers.
Acknowledgments
Funding
This work was supported by the European Commission FP7 project FIBRO-TARGETS (to TT), the Integrated Research and Treatment Center Transplantation (Hannover; to TT).
We would like to thank all the patients who participated in this study.
A.A.D. was supported by the Otto-Hess Scholarship of the German Cardiac Society.
Footnotes
Homepage: http://www.mh-hannover.de/imtts.html.
Conflict of interest
Conflict of Interest: none declared.
References
- 1.Maron BJ, Maron MS. Hypertrophic cardiomyopathy. Lancet. 2013;381(9862):242–255. doi: 10.1016/S0140-6736(12)60397-3. 1/19–25. [DOI] [PubMed] [Google Scholar]
- 2.Authors/Task Force members. Elliott PM, Anastasakis A, et al. 2014 ESC Guidelines on diagnosis and management of hypertrophic cardiomyopathy: The Task Force for the Diagnosis and Management of Hypertrophic Cardiomyopathy of the European Society of Cardiology (ESC) Eur Heart J. 2014 Oct 14;35(39):2733–2779. doi: 10.1093/eurheartj/ehu284. [DOI] [PubMed] [Google Scholar]
- 3.Song L, Su M, Wang S, et al. MiR-451 is decreased in hypertrophic cardiomyopathy and regulates autophagy by targeting TSC1. J Cell Mol Med. 2014 Nov;18(11):2266–2274. doi: 10.1111/jcmm.12380. [DOI] [PMC free article] [PubMed] [Google Scholar]
- 4.Roncarati R, Viviani Anselmi C, Losi MA, et al. Circulating miR-29a, among other up-regulated microRNAs, is the only biomarker for both hypertrophy and fibrosis in patients with hypertrophic cardiomyopathy. J Am Coll Cardiol. 2014 Mar 11;63(9):920–927. doi: 10.1016/j.jacc.2013.09.041. [DOI] [PubMed] [Google Scholar]
- 5.Thum T, Gross C, Fiedler J, et al. MicroRNA-21 contributes to myocardial disease by stimulating MAP kinase signalling in fibroblasts. Nature. 2008 Dec 18;456(7224):980–984. doi: 10.1038/nature07511. [DOI] [PubMed] [Google Scholar]
- 6.Care A, Catalucci D, Felicetti F, et al. MicroRNA-133 controls cardiac hypertrophy. Nat Med. 2007 May;13(5):613–618. doi: 10.1038/nm1582. [DOI] [PubMed] [Google Scholar]
- 7.van Rooij E, Olson EN. MicroRNA therapeutics for cardiovascular disease: opportunities and obstacles. Nat Rev Drug Discov. 2012 Nov;11(11):860–872. doi: 10.1038/nrd3864. [DOI] [PMC free article] [PubMed] [Google Scholar]
- 8.Thum T. Noncoding RNAs and myocardial fibrosis. Nat Rev Cardiol. 2014 Nov;11(11):655–663. doi: 10.1038/nrcardio.2014.125. [DOI] [PubMed] [Google Scholar]
- 9.Jaguszewski M, Osipova J, Ghadri JR, et al. A signature of circulating microRNAs differentiates takotsubo cardiomyopathy from acute myocardial infarction. Eur Heart J. 2014 Apr;35(15):999–1006. doi: 10.1093/eurheartj/eht392. [DOI] [PMC free article] [PubMed] [Google Scholar]
- 10.Bauters C, Kumarswamy R, Holzmann A, et al. Circulating miR-133a and miR-423-5p fail as biomarkers for left ventricular remodeling after myocardial infarction. Int J Cardiol. 2013 Oct 3;168(3):1837–1840. doi: 10.1016/j.ijcard.2012.12.074. [DOI] [PubMed] [Google Scholar]
- 11.Kumarswamy R, Thum T. Non-coding RNAs in cardiac remodeling and heart failure. Circ Res. 2013 Aug 30;113(6):676–689. doi: 10.1161/CIRCRESAHA.113.300226. [DOI] [PubMed] [Google Scholar]
- 12.Widera C, Gupta SK, Lorenzen JM, et al. Diagnostic and prognostic impact of six circulating microRNAs in acute coronary syndrome. J Mol Cell Cardiol. 2011 Nov;51(5):872–875. doi: 10.1016/j.yjmcc.2011.07.011. [DOI] [PubMed] [Google Scholar]
- 13.Kumarswamy R, Lyon AR, Volkmann I, et al. SERCA2a gene therapy restores microRNA-1 expression in heart failure via an Akt/FoxO3A-dependent pathway. Eur Heart J. 2012 May;33(9):1067–1075. doi: 10.1093/eurheartj/ehs043. [DOI] [PMC free article] [PubMed] [Google Scholar]
- 14.Zhang Y, Huang XR, Wei LH, Chung AC, Yu CM, Lan HY. miR-29b as a therapeutic agent for angiotensin II-induced cardiac fibrosis by targeting TGF-beta/Smad3 signaling. Mol Ther. 2014 May;22(5):974–985. doi: 10.1038/mt.2014.25. [DOI] [PMC free article] [PubMed] [Google Scholar]
- 15.Duong Van Huyen JP, Tible M, Gay A, et al. MicroRNAs as non-invasive biomarkers of heart transplant rejection. Eur Heart J. 2014 Dec 1;35(45):3194–3202. doi: 10.1093/eurheartj/ehu346. [DOI] [PubMed] [Google Scholar]
- 16.Elton TS, Selemon H, Elton SM, Parinandi NL. Regulation of the MIR155 host gene in physiological and pathological processes. Gene. 2013 Dec 10;532(1):1–12. doi: 10.1016/j.gene.2012.12.009. [DOI] [PubMed] [Google Scholar]
- 17.Seok HY, Chen J, Kataoka M, et al. Loss of MicroRNA-155 protects the heart from pathological cardiac hypertrophy. Circ Res. 2014 May 9;114(10):1585–1595. doi: 10.1161/CIRCRESAHA.114.303784. [DOI] [PMC free article] [PubMed] [Google Scholar]
- 18.Lew WY, Bayna E, Dalle Molle E, Contu R, Condorelli G, Tang T. Myocardial Fibrosis Induced by Exposure to Subclinical Lipopolysaccharide Is Associated with Decreased miR-29c and Enhanced NOX2 Expression in Mice. PLoS One. 2014 Sep 18;9(9):e107556. doi: 10.1371/journal.pone.0107556. [DOI] [PMC free article] [PubMed] [Google Scholar]
- 19.Nguyen T, Kuo C, Nicholl MB, et al. Downregulation of microRNA-29c is associated with hypermethylation of tumor-related genes and disease outcome in cutaneous melanoma. Epigenetics. 2011 Mar;6(3):388–394. doi: 10.4161/epi.6.3.14056. [DOI] [PMC free article] [PubMed] [Google Scholar]
- 20.Palacin M, Reguero JR, Martin M, et al. Profile of microRNAs differentially produced in hearts from patients with hypertrophic cardiomyopathy and sarcomeric mutations. Clin Chem. 2011 Nov;57(11):1614–1616. doi: 10.1373/clinchem.2011.168005. [DOI] [PubMed] [Google Scholar]
- 21.Batkai S, Thum T. Analytical approaches in microRNA therapeutics. J Chromatogr B Analyt Technol Biomed Life Sci. 2014 Aug 1;964:146–152. doi: 10.1016/j.jchromb.2014.03.027. [DOI] [PubMed] [Google Scholar]


