Abstract
Purpose of Review
There are an increasing number of markers that are used to predict the occurrence of type 1 diabetes (T1D), and to study the progression of pathologic changes prior to diagnosis. This review discusses some of those markers, particularly markers for which data are available that pertain to the progression to T1D.
Recent Findings
A study of birth cohorts showed that young children who develop multiple autoantibodies are at a particularly high risk for developing T1D, and that there appears to be a typical sequence for autoantibody development. The measurement of autoantibodies by electroluminescence can increase the prediction accuracy for T1D. A new marker of changes in glucose over 6 months (PS6M) has potential utility as an endpoint in short-term prevention trials. Markers which combine C-peptide and glucose, such as the Diabetes Prevention Trial-Type 1 Risk Score (DPTRS) and the Index60, can increase the accuracy of prediction, and can potentially be utilized as pre-diagnostic endpoints. β-cell death measurements could have substantial utility in future T1D research.
Summary
Markers are highly useful for studying the prediction of and progression to T1D. Moreover, markers can possibly be utilized to diagnose T1D at an earlier stage of disease.
Keywords: Type 1 Diabetes, Markers, Prediction, Natural History, Diagnosis
Introduction
A number of markers have been identified that are indicative of the risk for type 1 diabetes (T1D), including genetic, demographic, immunologic, and metabolic characteristics. Some of these risk markers change during the progression to T1D and have been used to characterize its development. In fact, the degree of risk for T1D and the changes in these markers can be intertwined; as the markers change, the risk changes. Thus, in discussing markers that have been identified and developed for following the progression to T1D, risk will often be considered. The particular markers included in this review were selected because they have been studied during the progression to T1D. Although the decline of the β-cell can continue for a number of years after diagnosis, this review will be limited to the use of markers prior to diagnosis and in the peri-diagnostic period. Following the review of the markers, a system for staging the progression to T1D will be proposed.
Autoantibody Markers
Autoantibodies have long been known to be risk factors for T1D (1-7). However, more recently there has been interest in relating their characteristics to T1D progression. Although autoantibodies have potential in this regard, it will be evident below that much is still to be learned.
Autoantibody Number
An investigation of several cohorts followed from birth has shown that the risk for T1D becomes very high once there is the development of 2 or more autoantibodies (8). In fact, it has been proposed that the occurrence of multiple autoantibodies in very young children is indicative of the inevitability of T1D. This will ultimately be determined as children with multiple autoantibodies continue to be followed.
Relatives of T1D patients who are identified as having multiple autoantibodies are also at high risk for T1D, but their risk does not appear to be as high as children followed from birth (7). Explanatory factors for this differences have not been identified, but could include age, types of autoantibodies, and such characteristics as affinity and titers. Whatever the basis, it is clear that in both children and adults the development of multiple autoantibodies is a significant milestone in the progression to T1D.
Autoantibody Type
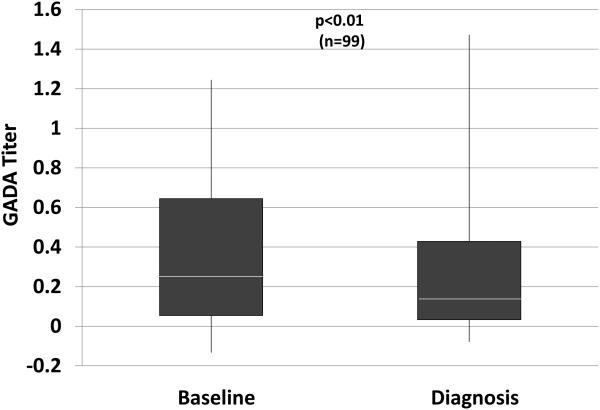
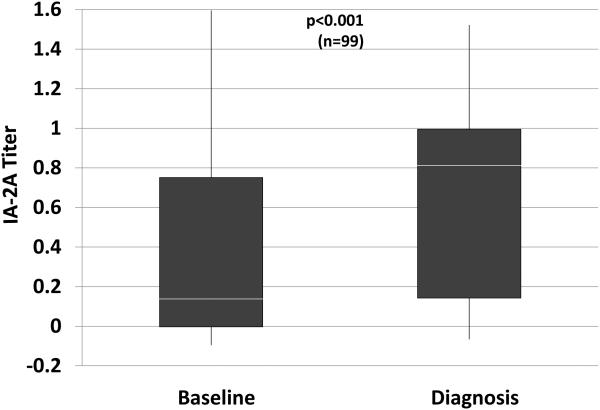
There are known differences in the degree of risk according to types of autoantibodies. For example, in an autoantibody positive cohort, individuals with IA-2A autoantibodies were at greater risk than those with GADA autoantibodies (7). This suggests that IA-2A autoantibodies appear closer to the diagnosis of T1D. A study (9) has shown that among a population of autoantibody positive relatives of T1D patients followed an average of approximately 3 years, the proportion of those with GADA positivity was high at baseline with a small decrease at diagnosis (81% to 77%, respectively), whereas the proportion positive for IA-2A increased appreciably from baseline to diagnosis (58% to 81%; p<0.001).
Recent data from birth cohorts at risk for T1D suggest that IAA autoantibodies are more commonly the initial autoantibody to appear, with a peak between the first and second year. When GADA appears first, it tends to occur later, with a peak at 3-5 years (10). More longitudinal data is needed to more precisely understand how changes in types of autoantibodies relate to the progression to T1D.
Autoantibody Titer
Even when autoantibodies are positive, titers appear to contribute to the prediction of T1D (5-7,10,11). In the study (9) that examined changes in GADA and IA-2A positivity, among those positive at baseline, IA-2A titers were increased at diagnosis; conversely, GADA titers decreased (Figure 1). Similar to other autoantibody characteristics, there is insufficient natural history information regarding changes in titers to know whether they can be useful markers for assessing progression.
Figure 1.
Shown are titers of GADA (A) and IA-2A (B) at baseline (mean±SD: 3.3±1.5 years before diagnosis) and at diagnosis in the same individuals. Whereas there tends to be a decrease in the GADA titer, the IA-2A titer increases. (White line: median; bottom of box: 25th percentile; top of box: 75th percentile; vertical line: range)
Autoantibody Affinity
Studies have shown that the risk for T1D could be related to autoantibody affinity (12,13). Electrochemical luminescence (ECL) measurements of autoantibodies, which are indicative of autoantibody affinity, have been shown to improve the prediction accuracy for T1D (14-16). They also appear to predict progression from single to multiple autoantibodies (16). However, their value as markers for progression in longitudinal studies is not known. More needs to be learned about how ECL positivity relates to the natural history of T1D. For example, it would be helpful to know whether the development of ECL positivity defines a stage of progression.
Glucose Markers
The level of glycemia has been used to study the progression to T1D. Importantly, glycemic thresholds have been used as the gold standard for T1D. Thus, the degree of progression can be assessed by relating glucose levels to diagnostic thresholds. Indeed, glucose markers have been used as indicators of progression more than other markers.
Glucose Levels
The value of glucose as a marker of progression was shown in the Diabetes Prevention Trial-Type 1 (DPT-1). Fasting, 2-hour and area under the curve (AUC) glucose levels all gradually increased from over 2 years before diagnosis to approximately 6 months before diagnosis (17). Since among normoglycemic individuals the risk for T1D is associated with a higher glucose (18), it appears that glucose levels gradually increase even within the normal range of glycemia. Glucose levels increased markedly between 6 months before diagnosis and diagnosis (19).
Dysglycemia
Dysglycemia has been utilized as a marker in studies of progression to T1D (20,21). In addition, it has been used as an entry criterion (22-24) in T1D prevention trials, and currently, as a pre-diagnostic endpoint in a prevention trial. Dysglycemia has various definitions. However, for T1D natural history studies and clinical trials in which 2-hr oral glucose tolerance tests (OGTTs) are performed, it is usually defined as one or more of the following: a fasting glucose value from 110-125 mg/dl; a 30-, 60-, and/or 90-minute value ≥200 mg/dl; a 2-hour value from 140-199 mg/dl.
Dysglycemia is a risk factor for T1D among autoantibody positive relatives, although the risk is substantially modified by age (23). Younger dysglycemic individuals are at much greater risk for T1D than are older individuals with dysglycemia. Among those followed over a period of years, the vast majority of autoantibody positive relatives pass through a stage of dysglycemia (17). However, it is not known whether all of those who become dysglycemic, especially older individuals, progress to T1D. Autoantibody relatives with dysglycemia can revert to a normoglycemic state; this is even true for those who ultimately progress to T1D (24).
There are several considerations in using dysglycemia as a marker for T1D progression. Since it covers a wide range of glucose levels, the risk for T1D varies among dysglycemic individuals Moreover, the risk implications of dysglycemia can vary substantially between autoantibody positive populations (25). Also, since the dysglycemic state is so often a precursor to type 2 diabetes (T2D), and T2D is so much more common than T1D, an appreciable proportion of autoantibody positive adults with dysglycemia could actually develop T2D.
Hemoglobin A1c (HbA1c)
HbA1c has been shown to increase during the progression to T1D, and has been assessed as a potential pre-diagnostic endpoint (26-28). A HbA1c value of ≥6.5% (the value currently used as a diagnostic threshold for T1D) was highly specific, but not sensitive for diagnosing T1D in autoantibody positive individuals (27). Thus, the 6.5% threshold value does not appear useful for diagnosing T1D at an earlier stage of pathogenesis in those individuals. Still, additional studies of HbA1c during progression might provide new insights into the natural history of the disorder.
6- Month Progression Scale (PS6M)
The progression to dysglycemia is used as a pre-diagnostic endpoint in a current prevention trial in order to shorten prevention trials. However, trials with such pre-diagnostic endpoints can still be quite prolonged, since they are open-ended. Another approach for shortening trials is to use alternative endpoints indicative of short-term change during progression.
Evidence that glycemia can increase for several years prior to the diagnosis of T1D (17) has been a basis for developing such an alternative endpoint. The PS6M (29) is a glucose measure that is indicative of the change in glycemia (the sum of 30-, 60-, 90-, and 120-minute glucose values from OGTTs) over 6 months relative to the expected change for those not progressing to T1D. The PS6M was developed from the DPT-1 and TrialNet Pathway to Prevention (PTP) studies. A PS6M value of 0 corresponds to the value expected for a typical non-progressor to T1D. Thus, negative values would indicate a smaller degree of progression than the typical non-progressor, while positive values would indicate a greater degree of progression. As PS6M values increase above 0, 6-month glycemic progression increases. PS6M values vary according to autoantibody number (29), which suggests that the PS6M could be used to develop shorter trials with finite (i.e., 6 months) rather than open-ended follow-up.
Insulin Markers
The loss of insulin secretion is a fundamental outcome of T1D pathology, yet there is relatively little longitudinal information about insulin secretion during the progression to T1D. Most of the information is derived from C-peptide analyses (see below).
First-Phase Insulin Response (FPIR)
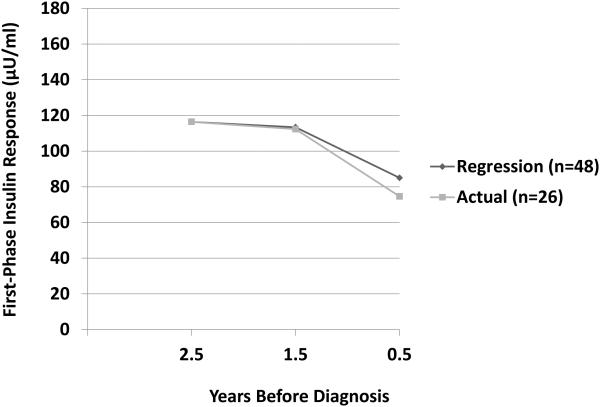
The FPIR, which is the earliest response to a glucose load during an intravenous glucose tolerance test, can desrease years before the diagnosis of T1D, and is predictive of the disorder (11,30-35). Although few studies have examined changes in the FPIR during progression, a study showed that on average there is a gradual loss of the FPIR until 1 to 2 years prior to diagnosis, after which the decline accelerates (34) (Figure 2).
Figure 2.
Shown are curves of FPIR values during the progression to T1D from actual serial values of progressors to T1D and values derived from a regression model for other progressors. The curve for the actual serial values is plotted according to the mean times from diagnosis of the FPIR measurements within each of yearlong intervals. The patterns are similar with a gradual decline from 2.5 to 1.5 years and a marked decline from 1.5 to 0.5 years before diagnosis.
C-peptide Markers
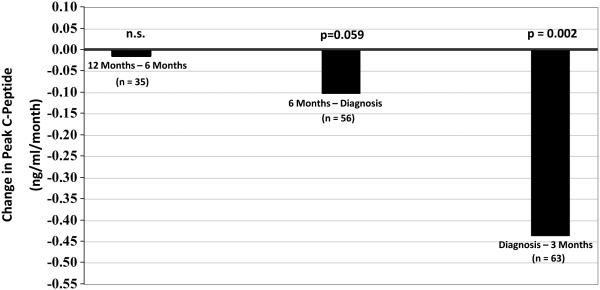
The AUC C-peptide from OGTTs is predictive of T1D (11,18), and both the AUC and peak C-peptide have been followed longitudinally prior to the diagnosis of T1D (17). These overall measures of C-peptide tend to change little until about 6 months before diagnosis, after which there is an appreciable decline (19). Figure 3 shows a substantial rate of decline of the peak C-peptide from 6 months prior to diagnosis to within 3 months after diagnosis.
Figure 3.
Shown are rates of changes of peak C-peptide levels according to intervals prior to and after diagnosis. C-peptide levels changed minimally between approximately 12 months and 6 months prior to diagnosis. The rate of decline was more marked in the 6 months prior to diagnosis and substantial in the period following diagnosis.
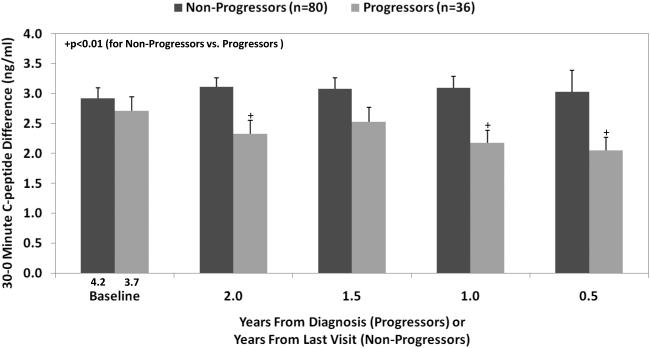
More information regarding insulin loss can be obtained by partitioning OGTTs into earlier and later C-peptide responsiveness (36). The 30-0 minute C-peptide, which correlates with the FPIR (36), appears to be a more sensitive indicator than either the AUC or peak C-peptide for examining the decline in C-peptide responsiveness. A decrease in the 30-0 minute C-peptide difference was evident at least 2 years before diagnosis (Figure 4) in DPT-1. There is a more marked decline 1 to 2 years prior to diagnosis, which mirrors the decline in the FPIR.
Figure 4.
Shown is the difference (mean±SEM) in C-peptide levels from 0 to 30 minutes (the 30-0 minute C-peptide difference) according to the time before diagnosis (progressors) or the time before the last visit (non-progressors). The 30-0 minute C-peptide difference was consistently lower in the progressors than in the non-progressors. (Mean values are shown for the time prior to diagnosis or to the last visit.)
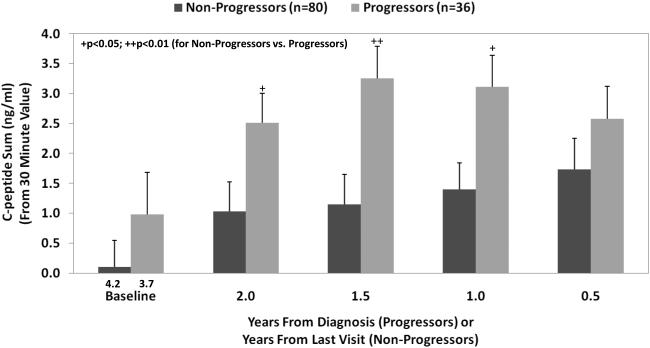
Measures of later C-peptide secretion (after 30 minutes) suggest that there is a compensatory response for the deficient early response during progression. During the last 2 years of progression, the C-peptide response after 30 minutes is actually greater than that in non-progressors (Figure 5), and there is a delay in the timing of the peak C-peptide (36).
Figure 5.
Shown is the C-peptide sum of the 60, 90, and 120-minute values (mean±SEM) from the OGTT prior to diagnosis (progressors to T1D) or from the OGTT prior to the last visit (non-progressors to T1D). The values were higher in the progressors from baseline to 0.5 years.
C-peptide measures have not been used as pre-diagnostic endpoints, although they have been assessed for this purpose (28). The AUC and peak C-peptide are used as endpoints for trials designed to prevent the loss of insulin secretion after diagnosis (37-41).
Combined Markers
Combinations of markers can provide more prediction accuracy than single markers, although they tend to have less direct pathogenic relevance. As will be evident below, in addition to higher prediction accuracy, combinations of markers can provide a unique approach for developing pre-diagnostic and diagnostic endpoints.
Diabetes Prevention Trial Type-1 Risk Score (DPTRS)
Using proportional hazards regression modeling, the DPTRS was developed from DPT-1 OGTT data in order to refine the prediction of T1D (35). The DPTRS combines age, BMI, fasting C-peptide, the sum of glucose values from 30 to 120 minutes, and the sum of C-peptide values from 30 to 120 minutes. When those variables were included together in a regression model, the associations with T1D were positive for the BMI, fasting C-peptide, and glucose sum, and negative for age and the C-peptide sum. The DPTRS was subsequently validated in the TrialNet Pathway to Prevention Study (42). A combination of the DPTRS with another risk score, the autoantibody risk score (43), which predicts T1D according to autoantibody type and titer, has even greater prediction accuracy.
When a DPTRS value of 9.00 is exceeded during OGTT surveillance, a diagnosis of T1D becomes a virtual certainty (44). Thus, that DPTRS threshold could be indicative of a point at which the DPTRS becomes diagnostic of T1D rather than just predictive. This led to the development of another marker, the Index60 (see below), which could potentially be used as a criterion for diagnosis.
Index60
Glucose diagnostic criteria for T1D and T2D have been the same for a number of years, despite differences in the pathogenesis of the disorders. Moreover, current diagnostic criteria for T1D do not take into account the severe insulin deficiency that is present. In contrast with standard glucose criteria, Index60 (45) is a potential diagnostic threshold for T1D that includes both glucose and C-peptide measurements. Derived with proportional hazards modeling, the Index60 combines glucose (60-minute glucose) and C-peptide measures (fasting and 60-minute C-peptide). It can be calculated from a 1-hour OGTT with only 2 blood samples. Since it was developed to serve as a metabolic diagnostic indicator of T1D, it does not include age and BMI as does the DPTRS. As might be expected, the Index60 correlates with the DPTRS and therefore could also be used for prediction.
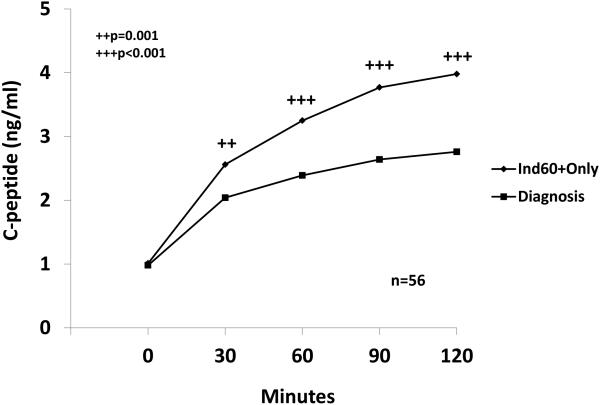
The Index60 was assessed as a possible endpoint for T1D using both DPT-1 and PTP data. When an Index60 threshold of ≥2.00 was utilized, a virtual diagnosis of T1D could be made before a diagnosis based on standard glucose criteria. In DPT-1, the first OGTT exceeding a threshold of ≥2.00 occurred approximately one year before a diagnosis according to standard OGTT glucose criteria. The C-peptide levels declined considerably in the interval from the first OGTT with Index60≥2.00 to the time of diagnosis (Figure 6). The data indicated that ≥2.00 threshold for Index60 could be used alone or together with standard glucose criteria for diagnosis. These findings suggest that the Index60 threshold of ≥2.00 could result in an earlier clinical diagnosis of T1D and shorten prevention trials.
Figure 6.
Shown are the mean changes in C-peptide levels from the first OGTT during progression with an Index60 value ≥2.00 and below standard diagnostic glucose criteria (Ind60+Only) to the time of diagnosis in DPT-1. The interval from the first Ind60+only OGTT to the diagnostic OGTT was 0.99±0.66 years. There was a marked decline in C-peptide levels at each of the post-challenge time points.
By using a lower threshold (e.g., ≥1.00 instead of ≥2.00), the Index60 also has potential as an earlier pre-diagnostic endpoint. The combination of glucose and C-peptide measurements suggests that Index60 might be a more specific indicator of T1D than dysglycemia, which is also a common precursor for T2D.
Other Markers
As a marker of β-cell death, unmethylated DNA (INS DNA), has potential utility for studying progression (46). Repeated measurements of this marker during progression could provide a great deal of information about the timing of the loss of β-cells. It will be of interest to further examine the association between insulin loss and β-cell death to determine the extent to which the decline in insulin secretion is related to the loss of β-cells.
The β-cell sensitivity to glucose is a marker that has already shown value for studying progression. In a DPT-1 study, the β-cell sensitivity to glucose decreased just prior to the accelerated increase in glucose that occurs prior to progression (47). This finding suggests that future studies of β-cell sensitivity to glucose will provide valuable additional information.
There are several other markers that have potential for improving our understanding of the progression to T1D. New techniques that are being developed to measure islet inflammation and β-cell mass have promise in this regard. Existing and new assays of T-cells and cytokines could also be useful for studying progression. MicroRNAs could provide new information pertinent to genetic control mechanisms during progression. Additional metabolic indices followed serially during progression, such as insulin secretory rates, the insulinogenic index, the disposition index, and specific measures of insulin resistance, might also add insights. Finally, further insight should be gained from examining the relation of markers to each other, such as how the decline in insulin secretion relates to changes in autoantibody characteristics.
Defining Stages of T1D
George Eisenbarth proposed the first comprehensive staging system for T1D (48). Although some have proposed modifications, Eisenbarth’s original proposal has stood the test of time. However, with the additional information that has been accrued regarding the natural history of T1D, it seems possible to add detail to the staging of T1D, especially among those who are autoantibody positive. A proposed staging system for autoantibody positive individuals is shown below. Information from studies of metabolic markers are used as the basis, since those markers have been studied serially. This information is summarized below.
The FPIR and early C-peptide response can be decreased years before diagnosis. There tends to be an accelerated decline in both 1 to 2 years prior to diagnosis. Paradoxically, the later insulin response (after 30 minutes) response can increase, possibly in response to higher glucose levels.
Glucose levels within the normal range of glycemia are predictive of T1D.
Glucose levels can increase years before diagnosis. There tends to be an accelerated increase in glucose 6 months to 1 year prior to diagnosis.
Combined markers that include C-peptide and glucose more accurately predict T1D than glucose markers alone. When a high threshold of such markers is exceeded, a clinical diagnosis is virtually inevitable within a few years.
Among those positive for autoantibodies, metabolic progression might be defined by four stages.
No Progression: Early insulin response values (e.g., FPIR and 30-0 Minute C-peptide difference) and glucose levels are normal and show little or no measureable change over time.
Gradual Progression: Early insulin response values begin to gradually decline and glucose levels gradually increase, often within the normal range. Later insulin response values can increase.
Accelerated Progression: The decline in early insulin response values accelerates which results in a greater rate of increase in glucose levels. Glucose levels could still be within the normal range in some individuals, especially children. Later insulin response values can increase.
Pre-Diagnosis: A combined C-peptide and glucose marker exceeds a threshold (e.g., Index60≥2.00) at which a diagnosis of T1D is virtually inevitable, but standard diagnostic criteria have not been met.
The time intervals for each stage could vary considerably among individuals. For example, young children might proceed more quickly through each stage. Autoantibody characteristics and other immunologic factors could also modify the rate of progression through the stages. Moreover, it is conceivable that some might proceed to a particular stage, but not to T1D. For example, the presence of a protective factor or the absence of a causative factor could prevent movement from the stage of gradual progression to the stage of accelerated progression. Factors that modify progression deserve extensive exploration. As we learn more about the progression to T1D from new and existing markers, the staging will be further refined.
Conclusion
Markers have provided valuable insights into the pathogenesis of T1D. In addition, those markers have practical applications for improving the designs of prevention trials and even potentially for diagnosing T1D at an earlier stage of its development. An earlier diagnosis could result in more effective treatment interventions for preserving insulin secretion. The discovery and development of new markers will almost certainly lead to further progress for delaying or even preventing T1D.
Key Points.
Markers have recently been identified which contribute to the prediction accuracy for T1D, an understanding of its natural history, and the design of prevention trials for the disorder.
Markers for T1D can be combined into scores to enhance their utility for prediction.
Markers can be used alone or in combination to serve as pre-diagnostic endpoints for T1D prevention trials.
Markers have provided information which should lead to a more detailed staging of the development of T1D.
Markers have provided information which could lead to an earlier diagnosis of T1D.
Acknowledgements
The author wishes to thank all Diabetes Prevention Trial-Type 1 and TrialNet researchers and staff for their contributions.
Financial Support and Sponsorship
The sponsor of the trial was the Type 1 Diabetes TrialNet Pathway to Prevention Study Group. Type 1 Diabetes TrialNet Pathway to Prevention Study Group is a clinical trials network funded by the National Institutes of Health (NIH) through the National Institute of Diabetes and Digestive and Kidney Diseases, the National Institute of Allergy and Infectious Diseases, and The Eunice Kennedy Shriver National Institute of Child Health and Human Development, through the cooperative agreements U01 DK061010, U01 DK061034, U01 DK061042, U01 DK061058, U01 DK085465, U01 DK085453, U01 DK085461, U01 DK085463, U01 DK085466, U01 DK085499, U01 DK085504, U01 DK085505, U01 DK085509, U01 DK103180, U01-DK103153, U01-DK085476, U01-DK103266 and the Juvenile Diabetes Research Foundation International (JDRF). The contents of this Article are solely the responsibility of the authors and do not necessarily represent the official views of the NIH or the JDRF. Jay Sosenko is the guarantor of this work and, as such, had full access to all the data in the study and takes responsibility for the integrity of the data and the accuracy of the data analysis.
Footnotes
Conflicts of interest
None.
References
- 1).Gorsuch AN, Spencer KM, Lister J, McNally JM, Dean BM, Bottazzo GF, Cudworth AG. Evidence for a long prediabetic period in Type I (insulin dependent) diabetes mellitus. Lancet. 1981;2:1363–1365. doi: 10.1016/s0140-6736(81)92795-1. [DOI] [PubMed] [Google Scholar]
- 2).Baekkeskov S, Landin M, Kristensen JK, Srikanta S, Bruining GJ, Mandrup-Poulsen T, de Beaufort C, Soeldner JS, Eisenbarth G, Lindgren F. Antibodies to a 64,000 Mr human islet cell antigen precede the clinical onset of insulin-dependent diabetes. J Clin Invest. 1987;79:926–934. doi: 10.1172/JCI112903. [DOI] [PMC free article] [PubMed] [Google Scholar]
- 3).Kulmala P, Savola K, Petersen JS, Vahasalo P, Karjalainen J, Lopponen T, Dyrberg T, Akerblom HK, Knip M. Prediction of insulin-dependent diabetes mellitus in siblings of children with diabetes. A population-based study. The Childhood Diabetes in Finland Study Group. J Clin Invest. 1998;101:327–336. doi: 10.1172/JCI119879. [DOI] [PMC free article] [PubMed] [Google Scholar]
- 4).Ziegler A-G, Hummel M, Schenker M, Bonifacio E. Autoantibody appearance and risk for development of childhood diabetes in offspring of parents with type 1 diabetes. Diabetes. 1999;48:460–468. doi: 10.2337/diabetes.48.3.460. [DOI] [PubMed] [Google Scholar]
- 5).Achenbach P, Warncke K, Reiter J, Naserke HE, Williams AJK, Bingley PJ, Bonifacio E, Ziegler A-G. Stratification of type 1 diabetes risk on the basis of islet autoantibody characteristics. Diabetes. 2004;53:384–392. doi: 10.2337/diabetes.53.2.384. [DOI] [PubMed] [Google Scholar]
- 6).Mrena S, Virtanen SM, Laippala P, Kulmala P, Hannila ML, Akerblom HK, Knip M, Childhood Diabetes in Finland Study Group Models for predicting type 1 diabetes in siblings of affected children. Diabetes Care. 2006;29:662–666. doi: 10.2337/diacare.29.03.06.dc05-0774. [DOI] [PubMed] [Google Scholar]
- 7).Orban T, Sosenko JM, Cuthbertson, Krischer JP, Skyler JS, Jackson R, Yu L, Palmer JP, Schatz D, Eisenbarth G. Pancreatic islet autoantibodies as predictors of type 1 diabetes in the Diabetes Prevention Trial-Type 1 (DPT-1) Diabetes Care. 2009;32:2269–2274. doi: 10.2337/dc09-0934. [DOI] [PMC free article] [PubMed] [Google Scholar]
- 8).Ziegler AG, Rewers M, Simell O, Simell T, Lempainen J, Steck A, Winkler C, Ilonen J, Veijola R, Knip M, Bonifacio E, Eisenbarth GS. Seroconversion to multiple islet autoantibodies and risk of progression to diabetes in children. JAMA. 2013;19:2473–2479. doi: 10.1001/jama.2013.6285. 309. [DOI] [PMC free article] [PubMed] [Google Scholar]
- 9).Sosenko JM, Skyler JS, Palmer JP, Krischer JP, Cuthbertson D, Yu L, Schatz DA, Orban T, Eisenbarth G, Diabetes Prevention Trial–Type 1 and Type 1 Diabetes TrialNet Study Groups A longitudinal study of GAD65 and ICA512 autoantibodies during the progression to type 1 diabetes in Diabetes Prevention Trial Type-1 (DPT-1) participants. Diabetes Care. 2011;34:2435–2437. doi: 10.2337/dc11-0981. [DOI] [PMC free article] [PubMed] [Google Scholar]
- 10).Ilonen J, Hammais A, Laine A-P, Lempainen J, Vaarala O, Veijola R, Simell O, Knip M. Patterns of β-cell autoantibody appearance and genetic associations during the first years of life. Diabetes. 2013:3636–3640. doi: 10.2337/db13-0300. [DOI] [PMC free article] [PubMed] [Google Scholar]
- 11).Xu P, Beam CA, Cuthbertson D, Sosenko JM, Skyler JS, Krischer JP, DPT-1 Study Group Prognostic accuracy of immunologic and metabolic markers for type 1 diabetes in a high risk population: receiver operating characteristic analysis. Diabetes Care. 2012;35:1975–1980. doi: 10.2337/dc12-0183. [DOI] [PMC free article] [PubMed] [Google Scholar]
- 12).Giannopoulou EZ, Winkler C, Chmiel R, Matzke C, Scholz M, Beyerlein A, Achenbach P, Bonifacio E, Ziegler AG. Islet autoantibody phenotypes and incidence in children at increased risk for type 1 diabetes. Diabetologia. 2015;58:2317–2323. doi: 10.1007/s00125-015-3672-y. [DOI] [PubMed] [Google Scholar]
- 13).Krause S, Chmiel R, Bonifacio E, Scholz M, Powell M, Furmaniak J, Rees Smith B, Ziegler AG, Achenbach P. IA-2 autoantibody affinity in children at risk for type 1 diabetes. Clin Immunol. 2012;145:224–229. doi: 10.1016/j.clim.2012.09.010. [DOI] [PubMed] [Google Scholar]
- 14).Yu L, Miao D, Scrimgeour L, Johnson K, Rewers M, Eisenbarth GS. Distinguishing persistent insulin autoantibodies with differential risk: nonradioactive bivalent proinsulin/insulin autoantibody assay. Diabetes. 2012;61:179–186. doi: 10.2337/db11-0670. [DOI] [PMC free article] [PubMed] [Google Scholar]
- 15).Miao D, Guyer KM, Dong F, Jiang L, Steck AK, Rewers M, Eisenbarth GS, Yu L. GAD65 autoantibodies detected by electrochemiluminescence assay identify high risk for type 1 diabetes. Diabetes. 2013;62:4174–4178. doi: 10.2337/db13-0534. [DOI] [PMC free article] [PubMed] [Google Scholar]
- *16).Miao D, Steck AK, Zhang L, Guyer KM, Jiang L, Armstrong T, Muller SM, Krischer J, Rewers M, Yu L, Type 1 Diabetes TrialNet Study Group Electrochemiluminescence assays for insulin and glutamic acid decarboxylase autoantibodies improve prediction of type 1 diabetes risk. Diabetes Technol Ther. 2015;17:119–27. doi: 10.1089/dia.2014.0186. This manuscript shows the potential value of electrochemiluminescence for predicting T1D. [DOI] [PMC free article] [PubMed] [Google Scholar]
- 17).Sosenko J, Palmer JP, Greenbaum CJ, Mahon J, Cowie C, Krischer JP, Chase HP, White NH, Buckingham B, Herold KC, Cuthbertson D, Skyler JS, Diabetes Prevention Trial-Type 1 Study Group Patterns of metabolic progression to type 1 diabetes in the Diabetes Prevention Trial-Type 1. Diabetes Care. 2006;29:643–649. doi: 10.2337/diacare.29.03.06.dc05-1006. [DOI] [PubMed] [Google Scholar]
- 18).Sosenko J, Palmer JP, Greenbaum CJ, Mahon J, Cowie C, Krischer JP, Chase HP, White NH, Buckingham B, Herold KC, Cuthbertson D, Skyler JS, Diabetes Prevention Trial–Type 1 Study Group Increasing the accuracy of oral glucose tolerance testing and extending its application to individuals with normal glucose tolerance for the prediction of type 1 diabetes. Diabetes Care. 2007;30:38–42. doi: 10.2337/dc06-1615. [DOI] [PubMed] [Google Scholar]
- 19).Sosenko JM, Palmer JP, Rafkin-Mervis L, Krischer JP, Cuthbertson D, Matheson D, Skyler JS, Diabetes Prevention Trial -Type 1 Study Group Glucose and C-peptide changes in the perionset period of type 1 diabetes in The Diabetes Prevention Trial-Type 1. Diabetes Care. 2008;31:2188–2192. doi: 10.2337/dc08-0935. MD. [DOI] [PMC free article] [PubMed] [Google Scholar]
- 20).Sosenko JM, Palmer JP, Rafkin-Mervis L, Krischer JP, Cuthbertson D, Mahon J, Greenbaum CJ, Cowie CC, Skyler JS, Diabetes Prevention Trial–Type 1 Study Group Incident dysglycemia and the progression to type 1 diabetes among participants in the Diabetes Prevention Trial–Type 1. Diabetes Care. 2009;32:1603–1607. doi: 10.2337/dc08-2140. [DOI] [PMC free article] [PubMed] [Google Scholar]
- 21).Sosenko JM, Skyler JS, Krischer JP, Greenbaum CJ, Mahon J, Rafkin L, Cuthbertson D, Cowie CC, Herold K, Eisenbarth G, Palmer JP, Diabetes Prevention Trial-Type 1 Diabetes Study Group Glucose Excursions between States of Glycemia with Progression to Type 1 Diabetes in the Diabetes Prevention Trial-Type 1 (DPT-1) Diabetes. 2010;59:2386–2389. doi: 10.2337/db10-0534. [DOI] [PMC free article] [PubMed] [Google Scholar]
- 22).Diabetes Prevention Trial-Type 1 Diabetes Study Group Effects of insulin in relatives of patients with type 1 diabetes mellitus. N Engl J Med. 2002;346:1685–1691. doi: 10.1056/NEJMoa012350. [DOI] [PubMed] [Google Scholar]
- 23).Gale EA, Bingley PJ, Emmett CL, Collier T. The European Nicotinamide Diabetes Intervention Trial (ENDIT) Group: European Nicotinamide Diabetes Intervention Trial (ENDIT): a randomised controlled trial of intervention before the onset of type 1. Lancet. 2004;363:925–931. doi: 10.1016/S0140-6736(04)15786-3. [DOI] [PubMed] [Google Scholar]
- 24).Diabetes Prevention Trial-Type 1 Diabetes Study Group Effects of oral insulin in relatives of patients with type 1 diabetes. Diabetes Care. 2005;28:1068–1076. doi: 10.2337/diacare.28.5.1068. [DOI] [PubMed] [Google Scholar]
- 25).Sosenko JM, Skyler JS, Mahon J, Krischer JP, Greenbaum CJ, Rafkin LE, Beam CA, Boulware DC, Matheson D, Cuthbertson D, Herold KC, Eisenbarth G, Palmer JP, Type 1 Diabetes TrialNet and Diabetes Prevention Trial-Type 1 Study Groups Use of the Diabetes Prevention Trial-Type 1 Risk Score (DPTRS) for improving the accuracy of risk classification of type 1 diabetes. Diabetes Care. 2014;37:979–984. doi: 10.2337/dc13-2359. [DOI] [PMC free article] [PubMed] [Google Scholar]
- 26).Stene LC, Barriga K, Hoffman M, Kean J, Klingensmith G, Norris JM, Erlich HA, Eisenbarth GS, Rewers M. Normal but increasing hemoglobin A1c levels predict progression from islet immunity to overt type 1 diabetes: Diabetes Autoimmune Study in Young (DAISY) Pediatr Diabetes. 2006;7:247–53. doi: 10.1111/j.1399-5448.2006.00198.x. [DOI] [PubMed] [Google Scholar]
- 27).Vehik K, Cuthbertson D, Boulware D, Beam CA, Rodriguez H, Legault L, Hyytinen M, Rewers MJ, Schatz DA, Krischer JP, TEDDY, TRIGR, Diabetes Prevention Trial–Type 1, and Type 1 Diabetes TrialNet Natural History Study Groups Performance of HbA1c as an early diagnostic indicator of type 1 diabetes in children and youth. Diabetes Care. 2012;35:1821–1825. doi: 10.2337/dc12-0111. [DOI] [PMC free article] [PubMed] [Google Scholar]
- 28).Krischer JP, Type 1 Diabetes TrialNet Natural History Study Group The use of intermediate endpoints in the design of type 1 diabetes prevention trials. Diabetologia. 2013;56:1919–1924. doi: 10.1007/s00125-013-2960-7. [DOI] [PMC free article] [PubMed] [Google Scholar]
- *29).Sosenko JM, Skyler JS, Beam CA, Boulware D, Mahon JL, Krischer JP, Greenbaum CJ, Rafkin LE, Matheson D, Herold KC, Palmer JP, Type 1 Diabetes TrialNet and Diabetes Prevention Trial–Type 1 Study Groups The development and utility of a novel scale that quantifies the glycemic progression toward type 1 diabetes over 6 months. Diabetes Care. 2015;38:940–942. doi: 10.2337/dc14-2787. This manuscript introduces a glucose measure of change that has potential as an endpoint for short-term prevention trials. [DOI] [PMC free article] [PubMed] [Google Scholar]
- 30).Vardi P, Crisa L, Jackson RA. Predictive value of intravenous glucose tolerance test insulin secretion less than or greater than the first percentile in islet cell antibody positive relatives of type 1 (insulin-dependent) diabetic patients. Diabetologia. 1991;34:93–102. doi: 10.1007/BF00500379. [DOI] [PubMed] [Google Scholar]
- 31).Chase HP, Voss MA, Butter-Simon N, Hoops S, O’Brien D, Dobersen MJ. Diagnosis of pre-type 1 diabetes. J Pediatr. 1987;111:807–812. doi: 10.1016/s0022-3476(87)80192-0. [DOI] [PubMed] [Google Scholar]
- 32).Srikanta S, Ganda OP, Rabizadeh A, Soeldner JS, Eisenbarth GS. First-degree relatives of patients with type 1 diabetes mellitus: islet cell antibodies and abnormal insulin secretion. N Engl J Med. 1985;313:461–464. doi: 10.1056/NEJM198508223130801. [DOI] [PubMed] [Google Scholar]
- 33).Ginsberg-Fellner F, Witt ME, Franklin BH, Yagihashi S, Toguchi Y, Dobersen MJ, Rubinstein P, Notkins AL. Triad of markers for identifying children at high risk of developing insulin-dependent diabetes mellitus. JAMA. 1985;254:1469–1472. [PubMed] [Google Scholar]
- 34).Sosenko JM, Skyler JS, Beam CA, Krischer JP, Greenbaum CJ, Mahon J, Rafkin LE, Matheson D, Herold KC, Palmer JP, The Diabetes Type 1 TrialNet and Diabetes Prevention Trial-Type 1 Study Groups The acceleration of the loss of the first-phase insulin response during the progression to type 1 diabetes in Diabetes Prevention Trial-Type 1 participants. Diabetes. 2013;62:4179–83. doi: 10.2337/db13-0656. [DOI] [PMC free article] [PubMed] [Google Scholar]
- 35).Sosenko JM, Krischer JP, Palmer JP, Mahon J, Cowie C, Greenbaum CJ, Cuthbertson D, Lachin JM, Skyler JS, Diabetes Prevention Trial-Type 1 Study Group A risk score for type 1 diabetes derived from autoantibody positive participants in The Diabetes Prevention Trial-Type 1. Diabetes Care. 2008;31:528–533. doi: 10.2337/dc07-1459. MD. [DOI] [PubMed] [Google Scholar]
- 36).Sosenko JM, Palmer JP, Rafkin-Mervis L, Krischer JP, Cuthbertson D, Greenbaum CJ, Eisenbarth G, Skyler JS, Diabetes Prevention Trial-Type 1 Study Group Trends of earlier and later responses of C-peptide to oral glucose challenges with progression to type 1 diabetes in Diabetes Prevention Trial–Type 1 participants. Diabetes Care. 2010;33:620–625. doi: 10.2337/dc09-1770. [DOI] [PMC free article] [PubMed] [Google Scholar]
- 37).Herold KC, Hagopian W, Auger JA, Poumian-Ruiz E, Taylor L, Donaldson D, Gitelman SE, Harlan DM, Xu D, Zivin RA, Bluestone JA. Anti-CD3 monoclonal antibody in new-onset type 1 diabetes mellitus. N Engl J Med. 2002;346:1692–1698. doi: 10.1056/NEJMoa012864. [DOI] [PubMed] [Google Scholar]
- 38).Pescovitz MD, Greenbaum CJ, Krause-Steinrauf H, Becker DJ, Gitelman SE, Goland R, Gottlieb PA, Marks JB, McGee PF, Moran AM, Raskin P, Rodriguez H, Schatz DA, Wherrett D, Wilson DM, Lachin JM, Skyler JS, Type 1 Diabetes TrialNet Anti-CD20 Study Group Rituximab, B-lymphocyte depletion, and preservation of beta-cell function. N Engl J Med. 2009;361:2143–2145. doi: 10.1056/NEJMoa0904452. [DOI] [PMC free article] [PubMed] [Google Scholar]
- 39).Gottlieb PA, Quinlan S, Krause-Steinrauf H, Greenbaum CJ, Wilson DM, Rodriguez H, Schatz DA, Moran AM, Lachin JM, Skyler JS, Type 1 Diabetes TrialNet MMF/DZB Study Group Failure to preserve beta-cell function with mycophenolate mofetil and dacluzimab combined therapy in patients with new-onset type 1 diabetes. Diabetes Care. 2010;33:826–832. doi: 10.2337/dc09-1349. [DOI] [PMC free article] [PubMed] [Google Scholar]
- 40).Orban T, Bundy B, Becker DJ, DiMeglio LA, Gitelman SE, Goland R, Gottlieb PA, Greenbaum CJ, Marks JB, Monzavi R, Moran A, Raskin P, Rodriguez H, Russell WE, Schatz D, Wherrett D, Wilson DM, Krischer JP, Skyler JS, Type 1 Diabetes TrialNet Abatacept Study Group Co-stimulation modulation with abatacept in patients with recent-onset type 1 diabetes mellitus: a randomized, double-blind placebo-controlled trial Lancet. 2011;378(9789):412–419. doi: 10.1016/S0140-6736(11)60886-6. [DOI] [PMC free article] [PubMed] [Google Scholar]
- 41).Wherrett DK, Bundy B, Becker DJ, DiMeglio LA, Gitelman SE, Goland R, Gottlieb PA, Greenbaum CJ, Herold KC, Marks JB, Monzavi R, Moran A, Orban T, Palmer JP, Raskin P, Rodriguez H, Schatz D, Wilson DM, Krischer JP, Skyler JS, Type 1 Diabetes TrialNet GAD Study Group Antigen-based therapy with glutamic acid decarboxylase (GAD) vaccine in patients with recent-onset type 1 diabetes: a randomized double-blind trial. Lancet. 2011;378:319–327. doi: 10.1016/S0140-6736(11)60895-7. [DOI] [PMC free article] [PubMed] [Google Scholar]
- 42).Sosenko JM, Skyler JS, Mahon J, Krischer JP, Beam CA, Boulware DC, Greenbaum CJ, Rafkin LE, Cowie C, Cuthbertson D, Palmer JP, TrialNet and Diabetes Prevention Trial-Type 1 Study Groups Validation of the Diabetes Prevention Trial-Type 1 Risk Score (DPTRS) in the TrialNet Natural History Study. Diabetes Care. 2011;34:1785–1787. doi: 10.2337/dc11-0641. [DOI] [PMC free article] [PubMed] [Google Scholar]
- 43).Sosenko JM, Skyler JS, Palmer JP, Krischer JP, Yu L, Mahon J, Beam CA, Boulware DC, Rafkin L, Schatz D, Eisenbarth G, The Type 1 Diabetes TrialNet and the Diabetes Prevention Trial-Type 1 Study Groups The prediction of type 1 diabetes by multiple autoantibody levels and their incorporation into an autoantibody risk score in relatives of type 1 diabetic patients. Diabetes Care. 2013;36:2615–2620. doi: 10.2337/dc13-0425. [DOI] [PMC free article] [PubMed] [Google Scholar]
- 44).Sosenko JM, Skyler JS, Mahon J, Krischer JP, Beam CA, Boulware DC, Greenbaum CJ, Rafkin LE, Cowie C, Cuthbertson D, Palmer JP, Type 1 Diabetes TrialNet and Diabetes Prevention Trial–Type 1 Study Groups The application of the type 1 diabetes risk score for identifying a preclinical state of type 1 diabetes. Diabetes Care. 2012;35:1552–1555. doi: 10.2337/dc12-0011. [DOI] [PMC free article] [PubMed] [Google Scholar]
- **45).Sosenko JM, Skyler JS, DiMeglio LA, Beam CA, Krischer JP, Greenbaum CJ, Boulware D, Rafkin LE, Matheson D, Herold KC, Mahon J, Palmer JP, Type 1 Diabetes TrialNet Study Group; Diabetes Prevention Trial-Type 1 Study Group A new approach for diagnosing type 1 diabetes in autoantibody-positive individuals based on prediction and natural history. Diabetes Care. 2015;38:271–276. doi: 10.2337/dc14-1813. This manuscript introduces a metabolic measure that has potential as an alternatuve approach for diagnosing T1D. [DOI] [PMC free article] [PubMed] [Google Scholar]
- **46).Herold KC, Usmani-Brown S, Ghazi T, Lebastchi J, Beam CA, Bellin MD, Ledizet M, Sosenko JM, Krischer JP, Palmer JP, Type 1 Diabetes TrialNet Study Group β cell death during type 1 diabetes development in at-risk individuals. J Clin Invest. 2015;125:1163–1173. doi: 10.1172/JCI78142. β cell death assessments could provide unique insights into the pathogenesis of T1D. [DOI] [PMC free article] [PubMed] [Google Scholar]
- 47).Ferrannini E, Mari A, Sosenko JM, Skyler JS, Diabetes Prevention Trial-Type 1 Study Group Progression to diabetes in relatives of type 1 diabetic patients: mechanisms and mode of onset. Diabetes. 2010;59:679–685. doi: 10.2337/db09-1378. [DOI] [PMC free article] [PubMed] [Google Scholar]
- 48).Eisenbarth GS. Type I diabetes mellitus. A chronic autoimmune disease. N Engl J Med. 1986;314:1360–1368. doi: 10.1056/NEJM198605223142106. [DOI] [PubMed] [Google Scholar]


