

Mathematical modeling coupled with direct measurement of Ca2+ and ROS dynamics suggest that ROS-assisted calcium-induced calcium release propagates stress-induced Ca2+ waves in plants.
Abstract
Plants exhibit rapid, systemic signaling systems that allow them to coordinate physiological and developmental responses throughout the plant body, even to highly localized and quickly changing environmental stresses. The propagation of these signals is thought to include processes ranging from electrical and hydraulic networks to waves of reactive oxygen species (ROS) and cytoplasmic Ca2+ traveling throughout the plant. For the Ca2+ wave system, the involvement of the vacuolar ion channel TWO PORE CHANNEL1 (TPC1) has been reported. However, the precise role of this channel and the mechanism of cell-to-cell propagation of the wave have remained largely undefined. Here, we use the fire-diffuse-fire model to analyze the behavior of a Ca2+ wave originating from Ca2+ release involving the TPC1 channel in Arabidopsis (Arabidopsis thaliana). We conclude that a Ca2+ diffusion-dominated calcium-induced calcium-release mechanism is insufficient to explain the observed wave transmission speeds. The addition of a ROS-triggered element, however, is able to quantitatively reproduce the observed transmission characteristics. The treatment of roots with the ROS scavenger ascorbate and the NADPH oxidase inhibitor diphenyliodonium and analysis of Ca2+ wave propagation in the Arabidopsis respiratory burst oxidase homolog D (AtrbohD) knockout background all led to reductions in Ca2+ wave transmission speeds consistent with this model. Furthermore, imaging of extracellular ROS production revealed a systemic spread of ROS release that is dependent on both AtRBOHD and TPC1. These results suggest that, in the root, plant systemic signaling is supported by a ROS-assisted calcium-induced calcium-release mechanism intimately involving ROS production by AtRBOHD and Ca2+ release dependent on the vacuolar channel TPC1.
Plants possess a rapid systemic signaling network that enables whole-plant responses to localized stimuli. Examples include wounding (Miller et al., 2009), pathogen attack (Dempsey and Klessig, 2012), and osmotic shock (Christmann et al., 2007). The system(s) involved in the plant-wide propagation of these signals has been proposed to be mediated by a diverse set of molecular regulators, including changes in membrane potential and ion fluxes (Felle and Zimmermann, 2007; Zimmermann et al., 2009; Mousavi et al., 2013), hydraulics in the vasculature (Christmann et al., 2007; Farmer et al., 2014), and reactive oxygen species (ROS; Miller et al., 2009). A novel addition to this suite of systemic signals was described by Choi et al. (2014), in which a wave-like propagation of increased cytoplasmic Ca2+ moved throughout the plant in response to localized salt stress. This signal propagated through the roots at a velocity of 396 ± 28 μm s−1 and induced the expression of a range of stress-response genes in the leaves. Unlike systemic signals described previously, this Ca2+ wave preferentially propagates through the root cortical and endodermal cells rather than the vasculature (Choi et al., 2014). Furthermore, the velocity of the signal is slower than the reported speed of 800 to 1,400 μm s−1 seen with the other proposed systemic signals, such as the ROS wave or electrical coupling (Miller et al., 2009; Mousavi et al., 2013).
Choi et al. (2014) revealed that the Ca2+ wave could be blocked by the application of pharmacological agents (La3+ and Ruthenium Red) known to inhibit calcium-release pathways and that disruption of the TWO PORE CHANNEL1 (TPC1) gene results in a substantial drop in wave speed (Table I). Furthermore, overexpression of TPC1 increased the speed of the wave by a factor of 1.7 (Table I). TPC1 also appears to be involved in systemic wound-related Ca2+ increases (Kiep et al., 2015), yet for many stress responses, whole-plant Ca2+ signaling dynamics appear unchanged in TPC1 mutants (Ranf et al., 2008).
Table I. Calcium wave velocities in the various lines of Arabidopsis.
Rates were calculated from measurements of the time taken for the Ca2+ signal to rise 2 sd above prestimulation levels measured at 1,000, 3,000, and 5,000 µm from the root tip after the application of 100 mm NaCl locally to the root tip. Results are means ± se; n ≥ 5.
| Genotype | Wave Velocity | Source |
|---|---|---|
| µm s−1 | ||
| Wild type | 396 ± 28 | Choi et al. (2014) |
| +25 μm La3+ | 0 | Choi et al. (2014) |
| +25 μm diphenyliodonium (DPI) | 146 ± 40 | This study |
| +100 μm ascorbate | 0 | This study |
| tpc1-2 | 15.5 ± 1.9 | Choi et al. (2014) |
| oxTPC1 | 679 ± 73 | Choi et al. (2014) |
| AtrbohD | 73 ± 19 | This study |
TPC1 in Arabidopsis (Arabidopsis thaliana) encodes the slow vacuolar (SV) channel (Hedrich and Neher, 1987; Peiter et al., 2005) that has been shown to be permeable to cations such as K+ but also to Ca2+ (Ward and Schroeder, 1994; Gradogna et al., 2009). The SV channel has been proposed to mediate Ca2+ release from the vacuole (Ward and Schroeder, 1994; Allen and Sanders, 1996; Pottosin et al., 2009), although this idea has become controversial in recent years (Hedrich and Marten, 2011). The original electrophysiological characterization of the SV channel showed that it could be modulated by Ca2+ levels (Hedrich and Neher, 1987), and now structural and genetic analyses of the channel indicate the presence of Ca2+-binding EF hand domains on the cytosolic face of the channel that aid channel activation (Guo et al., 2016; Kintzer and Stroud, 2016; for review, see Hedrich and Marten, 2011), coupled with a novel Ca2+-sensitive regulatory domain on its vacuolar lumenal face that shifts the channel’s voltage activation toward more positive potentials as vacuolar Ca2+ levels rise (Beyhl et al., 2009; Dadacz-Narloch et al., 2011; Guo et al., 2016). The recently published structure of TPC1 (Guo et al., 2016; Kintzer and Stroud, 2016) indicates several possible sites of phosphorylation offering further scope for regulation. Indeed, SV channel activity is known to be regulated by a host of cytosolic factors (for review, see Hedrich and Marten, 2011). However, in general, the precise role of TPC1 in potentially mediating stress-induced Ca2+ changes, and also which regulatory mechanisms may act to modulate TPC1 channel gating in such responses, remain unclear. For example, while some of the genetic components of the wave-like propagation of stress information by Ca2+ (such as TPC1; Choi et al., 2014; Kiep et al., 2015) have been identified, the molecular mechanisms mediating the spread of this wave have yet to be fully elucidated. Therefore, we used mathematical models to provide insight into the possible modes to generate this wave and to produce testable predictions for empirical validation of these models. We conclude that a simple calcium-induced calcium-release (CICR) mechanism is unlikely. To support the speeds of wave transmission seen in vivo, we suggest that a ROS-assisted CICR mechanism involving TPC1 and ROS production by the NADPH oxidase Arabidopsis RESPIRATORY BURST OXIDASE HOMOLOG D (AtRBOHD) may be required.
RESULTS
Models Based on CICR Do Not Recapitulate the Experimentally Determined Speed of Ca2+ Wave Propagation under Physiological Conditions
The experimental investigation of Choi et al. (2014) highlighted a number of different Ca2+ wave speeds in roots in response to chemical perturbations and in mutant lines of Arabidopsis in response to local NaCl stress application (Table I). For instance, increasing the abundance of TPC1 using a 35S promoter resulted in a significantly increased wave speed. Our approach to begin to dissect this system, therefore, has been to evaluate whether there are parameters for a mathematical model of Ca2+ wave propagation that can reproduce the empirically determined wild-type velocity and whether those same parameters, but with an increased number of TPC1 channels, also can capture the speed in the TPC1 overexpression line. Failure to do so would indicate that further elements and/or other mechanisms need to be considered in the model. This approach of testing whether a model is consistent with the available data has the advantage of not requiring experimental values for all parameters (which might be extremely difficult, if not impossible, to determine).
Given the direct effect that TPC1 has on the propagation of the Ca2+ wave, we first considered whether a CICR mechanism mediated by TPC1 could be involved. As discussed in the introduction, TPC1’s ability to directly mediate the release of vacuolar Ca2+ is not clear (Hedrich and Marten, 2011), and its role could well be indirect. However, one key strength of the modeling strategy is that it does not make any statement about the identity of the channels responsible for mediating the release of Ca2+, just that it is dependent on TPC1 action.
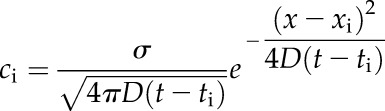
CICR can be described mathematically through the fire-diffuse-fire model (Keizer et al., 1998; Ponce-Dawson et al., 1999; Timofeeva and Coombes, 2003; Coombes et al., 2004). This framework describes the process in which a quantity of Ca2+, σi, released through a channel at position xi and at time ti diffuses through the cytosol and activates the next channel at position xi+1. This mechanism has the capacity to create a wave of Ca2+ that is regenerated each time a channel opens.
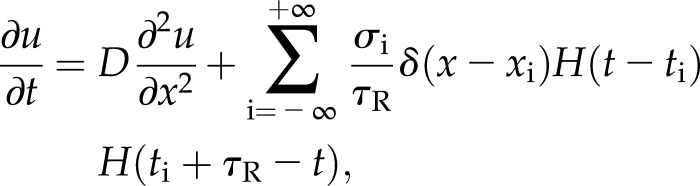
Approximating wave propagation through roots as a one-dimensional system, the concentration of Ca2+, u(x,t), can be determined using the diffusion equation:
 |
(1) |
where D is the diffusion constant of Ca2+, σ is the release strength, and τR is the time for which the channel remains open. Channels are modeled as point sources that are characterized by Dirac delta functions, δ(x), in space and by the product of two Heaviside step functions, H(t), in time, to capture the open time. A channel at a position, xi, on the vacuole is assumed to open when the cytosolic Ca2+ concentration at that position is greater than the threshold value uc. This gating value represents the mathematical description of either the concentration-dependent binding kinetics of a ligand-gated channel or the requisite buildup of ionic charge needed to open a voltage-gated channel.
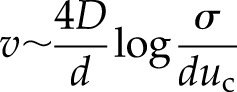
We assume that the release of Ca2+ from the vacuole occurs quickly compared with the time for diffusion between channels, so that we can treat a release as a point source in time (τR = 0). For a system of equally spaced channels with separation d, the velocity of the resulting wave is given by Pearson and Ponce-Dawson (1998):
 |
(2) |
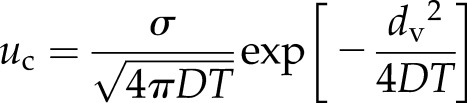
Within a cell, the vacuole (with the ubiquitously expressed channel TPC1) typically occupies 50% to 90% of the interior volume (Macklon et al., 1996), whereas plasmodesmata, presumably lacking TPC1, connect cells, leading to two distinct regions for the propagation of the wave in the model (Fig. 1A). In the first, the Ca2+ wave is propagated through the cytoplasm surrounding the vacuole. In the case of approximately equally distributed TPC1 channels on the tonoplast, the Ca2+ wave has a velocity given by Equation 2. In the second region, the wave must move between neighboring cells. If the mechanism behind transmission in the cytoplasm is a self-propagating wave of CICR mediated by TPC1, then presumably this mechanism will reduce to passive diffusion over a distance dv (the cell wall region) between the cytoplasm in adjacent cells through plasmodesmata. We assumed that this plasmodesmal coupling poses no obstacle to diffusion, so that the model has the best chance of propagating a wave at maximal speed. In this case, Ca2+ moving from a cell takes a time, T, to activate the first TPC1 channel on the tonoplast of the neighboring cell. The concentration profile for a single release evaluated at the time of activation of the next channel (when u = uc) then satisfies the expression
 |
(3) |
We assume here that the activation of the first channel in the neighboring cell is dominated by Ca2+ released from the closest channel in the previous cell. Within this model, the velocity of a Ca2+ wave is determined by the velocities across these two regions. The spatial and temporal resolution of the experiments measuring these speeds (Choi et al., 2014) is insufficient to robustly distinguish transmission through each cell versus the cell-to-cell component crossing dv, even using the high spatial and temporal resolution afforded by confocal microscopy. Therefore, the transit speed between the two regions cannot be separated and so is averaged in the empirical measurements. For a cell of length L, this average speed is given by
 |
(4) |
The time taken to cross the cell wall region (Eq. 3) and the velocity in the cytoplasm surrounding each vacuole region (Eq. 2) both depend on the parameter ratio σ/uc. This dependency implies that, in order to decrease the time spent crossing the cell wall region, the cell must change the release properties of the channels, but this has a corresponding effect on how quickly the wave crosses the cytoplasm in the vacuolar region. We used the measured velocity in the wild type, 395 μm s−1, the measured density of TPC1 channels in mesophyll cells, d = 1 μm (Pottosin and Schönknecht, 2007), and a commonly used value for the diffusion rate of Ca2+ in the cytosol, D = 20 μm2 s−1 (Allbritton et al., 1992), to calculate an estimate for this unknown parameter ratio, σ/uc. We then used this value to determine if the model can recapitulate the velocity in the TPC1 overexpressor (oxTPC1), 679 ± 73 μm s−1 (Choi et al., 2014).
Figure 1.

Ca2+ wave propagation via CICR and Ca2+ diffusion through the plasmodesmata can explain observed velocities under strict circumstances. A, Scheme of the model. Calcium is released through activated TPC1, and it diffuses through the cytoplasm a distance dtpc1 to activate neighboring TPC1 channels. At the end of a cell (length L), the signal diffuses passively to activate the neighboring cell (distance dv) through the plasmodesmata. B, Predicted wave speeds for the TPC1 overexpressor (OxTPC1) for a range of L and dv using Equations 2 to 4, where the model parameters are chosen to fit the wild-type velocity (Table I). The shaded region indicates 1 sd in the observed velocity. C, To account for distributions in dv, two simple schemes were tested. A one-dimensional array of cells with either dv = 10 μm (white) or dv = (blue) was set up in sequential order (i) or in random order (ii). D, The result of varying the proportion of cells within Ci with
  , as described in B, and utilizing a full simulation (see “Materials and Methods”).
The overexpressor has an increased density of TPC1 channels, which results in a decreased channel separation and so altered wave kinetics in the model. Peiter et al. (2005) measured the average numbers of TPC1 channels in vacuolar membrane patches in both the wild type and the overexpressor line. With the average channel density measured by Pottosin and Schönknecht (2007), we used the channel number data to estimate the channel separation. For the TPC1 overexpressor, we obtained a channel separation, d, of about 0.6 μm. Using this channel separation estimate and the ratio σ/uc calculated from the wild-type data, we calculated the expected velocity in the TPC1 overexpressor for a range of cell lengths and intervacuolar distances, dv, covering those found in the regions of the Arabidopsis root where empirical wave speed determinations have been performed (Fig. 1B).
We see that the model can only recapitulate the velocity in the overexpressor when dv is sufficiently small. This result did not depend on our choice of diffusion constant (Supplemental Fig. S1A) but could be affected by changes in the channel separation, d (Supplemental Fig. S1B). Since our chosen value for d came from TPC1 channel density data from mesophyll cells and the wave travels through the root, different expression levels of TPC1 could result in different densities of TPC1 on the vacuolar membrane. We tested for such potential differences with quantitative PCR (QPCR) analysis of roots and shoots dissected from plants grown as for the Ca2+ imaging. This analysis showed no statistically significant difference between root and shoot expression in the wild type (Supplemental Fig. S2). In the overexpressor, shoots showed a 1.9-fold higher transcript level than the roots of the same plants, so any change in actual channel density between roots and shoots will likely be small.
Measurements of cell wall thickness in leaves (Moghaddam and Wilman, 1998) and imaging of tonoplast intrinsic proteins in root cells (Werner et al., 2003; Hunter et al., 2007; Gattolin et al., 2009; Guo et al., 2014) suggest typical values of dv in the range of 1 to 2 μm, with values of 10 μm and even 60 μm in some cases. Due to the variability in such parameters drawn from the literature, we used the GFP signals in the images from the Ca2+ measurement data to visualize the cytoplasm of the cells used for Ca2+ wave speed measurement and so define where the vacuoles within each cell likely ended. We then measured the distance between the vacuole (where the yellow fluorescent protein [YFP] signal was less than 2 sd above background) in one cell to the vacuole in the adjacent cell using ImageJ (Schneider et al., 2012). As the Ca2+ wave speed is constant throughout the root at approximately 400 µm s−1 in the wild type (Choi et al., 2014), we concentrated on making these measurements in images taken at the 1,000-µm region from the root tip to allow direct comparison with the data in Figures 3 and 4, which focus on Ca2+ wave responses at this point in the root. Using this approach, average cytoplasmic lengths between vacuoles in adjacent cells were 4.4 ± 1.2 µm (epidermis; mean ± sd, n = 29), 5.4 ± 1.5 µm (cortex; n = 38), and 4.9 ± 1.4 (endodermis; n = 41). It is important to note that vacuoles are dynamic organelles, so these measurements should be viewed as time-averaged values of vacuolar behavior, as they are taken from random images across multiple independent experiments.
Figure 3.

Effects of DPI and ascorbate on salt-induced Ca2+ wave transmission. A, Quantitative analysis of the time course of Ca2+ changes in response to local 100 mm NaCl treatment at the root tip with and without 25 or 100 μm ascorbate pretreatment. B, Representative frame images of systemic tissues (1,000 µm from the root tip) in response to local 100 mm NaCl with and without 25 or 100 μm ascorbate pretreatment. C, Quantitative analysis of the time course of Ca2+ changes in response to local 100 mm NaCl treatment at the root tip with and without 25, 100, or 200 μm DPI pretreatment. The quantitative systemic Ca2+ wave is in response to 100 mm local NaCl. To allow for comparisons, the no-inhibitor pretreatment control is duplicated from A. D, Representative frame images of systemic tissues (1,000 µm from the root tip) in response to local 100 mm NaCl with 25, 100, or 200 μm DPI pretreatment. Results in A and C represent means ± se of n ≥ 5 (DPI and ascorbate) or n = 17 (the wild type) monitored 1,000 µm from the site of root tip NaCl application. Bars in B and D = 100 µm.
Figure 4.

The Ca2+ wave has a reduced velocity in the AtrbohD mutant. Ca2+ propagation occurred in mature root, 1,000 µm shootward from the site of direct salt stimulation at the root tip. A, Kymographs showing altered Ca2+ wave dynamics in the wild type versus the AtrbohD mutant. To generate the kymogram, quantitative ratiometric data (YFP-to-cyan fluorescent protein [CFP] ratio) were extracted from a region of interest (ROI) 1,000 µm from the tip site of 100 mm NaCl addition (monitor in the diagram at top). Starting at the edge of this ROI closest to the root tip, ratiometric data from a 5-µm-tall (along the root-shoot axis of the root) × 144-µm-wide region covering the cortex and endodermis was averaged and plotted at 0 µm of ROI. This 5-µm-tall region was then moved 5 µm shootward within the ROI and the analysis repeated, and the average ratio value was plotted at 5 µm of ROI. This process was repeated at sequential 5-µm distances from the start point to cover the 200-µm region of the root depicted. Analysis was then repeated on each of the images taken for the time course of the experiment (imaging every 2 s). Data were extracted using this approach from five roots and averaged, and pseudocolor-coded results are presented. B, Representative images of the time course of Ca2+ increase measured at 1,000 µm from the site of 100 mm NaCl to the root tip. Ca2+ levels were monitored using confocal ratio imaging of plants expressing Yellow Cameleon nano-65 and pseudocolor coded according to the scale at right. Time represents seconds after NaCl addition. Results shown are representative of n ≥ 5. Note that Ca2+ increase is limited primarily to cortex and endodermal cells in both the wild type and atrbohD, but the increase is delayed in the atrbohD mutant. Bar = 100 µm.
To assess the sensitivity of the model to dv and how well the measured intervacuolar distances could support a model that recapitulates measured wave speeds, we extended our modeling analysis to consider an array of cells with different values for dv, distributed either as two blocks of cells (Fig. 1Ci) or randomly among the array (Fig. 1Cii). This approach requires that we simulate the fire-diffuse-fire process as described in “Materials and Methods” rather than estimate the velocity using Equation 4. As before, we use the measured velocity in the wild type to determine the unconstrained parameter ratio, σ/uc, and then increased the TPC1 channel density to evaluate whether the model can recapitulate the measured velocity in the overexpressor. We asked what proportion of the array must have a small dv value if the largest value of dv is 10 μm. Figure 1D shows how, even with an intervacuole separation of 1 μm, the smallest value suggested in the literature (Moghaddam and Wilman, 1998; Werner et al., 2003; Hunter et al., 2007; Gattolin et al., 2009; Guo et al., 2014) and much less than our average measurements of dv in the root cortex and endodermis, more than 75% of the cells must have this value to reproduce the empirically determined wave speed. Figure 1D has the cells organized according to the scheme in Figure 1Ci, but the choice of cell distribution has no effect on the predicted velocities.
Thus, with such intervacuolar distances, Ca2+ diffusion would not be sufficiently rapid to recapitulate experimentally determined wave speeds. We emphasize that this model has not included any kind of obstruction to diffusion that the plasmodesmata may produce, which would make the wave even slower. In summary, the range of distances in the literature together with our analysis suggest that it is unlikely that calcium release through a TPC1-dependent CICR-driven mechanism alone is responsible for propagating the observed signal.
TPC1 Channel Clustering Does Not Explain Observed Ca2+ Wave Propagation Speeds
The analysis outlined above assumes that TPC1 is distributed uniformly across the vacuolar membrane. Clustering of signaling components may provide a mechanism for selective amplification and channeling of signals that could, in theory, contribute to increased signal propagation rates. Indeed, the observed distribution of channels (Peiter et al., 2005) suggests that TPC1 may show a degree of clustering. The distribution of random independent events on a fixed interval of space or time (such as the area of a membrane patch) follows a Poisson distribution (Riley et al., 1998), so if TPC1 channels were distributed randomly across the tonoplast, we would expect the patch clamp data of Peiter et al. (2005), which monitor individual TPC1 channel gating in isolated tonoplast membrane patches, to obey a Poisson distribution.
In Figure 2, we compare the measured distribution (Peiter et al., 2005) of TPC1 channels with the best-fit Poisson distribution for both the wild-type and overexpressor lines. We see that the Poisson distribution does not describe either of the experimental distributions well. A χ2 test with the Poisson distribution as a null hypothesis indicates that both the wild type and the overexpressor show strong evidence of clustering (Table II).
Figure 2.

Clustering of TPC1 on the tonoplast reduces the efficiency of CICR-mediated Ca2+ wave transmission. A and B, Numbers of TPC1 channels observed in vacuolar membrane patches by Peiter et al. (2005; bars) compared with best-fit Poisson distributions (lines) for the wild type (A) and the TPC1 overexpressor (B). C, How the velocity of a Ca2+ wave varies with increased clustering within the CICR model. The number of channels is kept constant as the number per cluster increases. Release strength, σ/uc, was chosen so the velocity with equally spaced channels matched the wild-type velocity (395 μm s−1). The dashed line shows the behavior predicted by Equation 5.
Table II. Clustering of TPC1 channels.
A χ2 test of channel count data (Peiter et al., 2005) was performed under the null hypothesis that TPC1 channels are (uniform) randomly distributed
| Line | Best-Fit Poisson Mean | χ2 |
|---|---|---|
| Wild type | 5.14288 | 7.2 × 10⁸ |
| oxTPC1 | 23.6695 | 1.54 × 10⁶ |
To investigate the impact of channel clustering on the wave propagation speeds, we performed the following simulations. An initial wave was generated assuming equally spaced channels. Keeping the total number of channels the same, the number of channels in a cluster was increased (initially one channel per cluster with separation d, changing to two channels per cluster with separation 2d, and so on).
We simulated the system with an array of 51 cells (as in Fig. 1C) with all dv values the same and a cell length, L, of 100 μm. This analysis showed that the speed of the wave falls with increased clustering (Fig. 2). The optimal arrangement for most rapid signal propagation, therefore, is when channels are equally spaced.
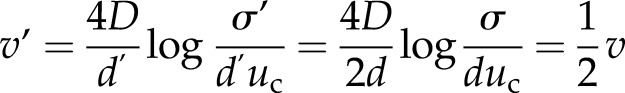
The expression for the wave velocity (Eq. 2) explains this decrease in velocity with increased clustering. Treating each cluster of channels as a single release site, with a release strength proportional to the number of channels in that cluster (Shuai and Jung, 2003), the effect of increasing the degree of clustering by a factor of 2, say, involves changing the channel separation d → d′ = 2d and the release strength σ → σ′ = 2σ (since we now have twice as many channels at a release site). The resulting velocity v′ is
 |
(5) |
This prediction captures the qualitative behavior of the wave, as shown in Figure 2C. This prediction describes the simulation for dv = 1 μm better than for dv = 10 μm, because it neglects the intervacuolar separation, which has a much larger influence when dv = 10 μm.
In the Ca2+ diffusion model, an optimal distribution of equally spaced channels is unlikely to explain the speed of the observed Ca2+ waves. An increase in clustering between the wild type and the TPC1 overexpressor would lead to less efficient signal propagation than the equally spaced channels and, therefore, an even worse fit.
ROS Production via RBOHD Is Sufficient to Activate Calcium Release and Wave Propagation at Observed Rates
To explain the observed Ca2+ wave speeds, we hypothesized that ROS may have a role to play. Rapid propagation of a systemic increase in ROS produced by the NADPH oxidase AtRBOHD has been reported in response to stress signals (Torres et al., 2002; Miller et al., 2009; Zhang et al., 2009). RBOHD is expressed ubiquitously throughout Arabidopsis plants and is localized to the plasma membrane of cells (Sagi and Fluhr, 2006). It is responsible for the production of ROS such as hydrogen peroxide in the apoplast and is involved in a range of signaling processes, such as in defense (Torres et al., 2002) and in the opening and closing of stomata (Zhang et al., 2009). Furthermore, it has been shown to be essential to the propagation of the ROS waves by Miller et al. (2009). The RBOH family of proteins contain two EF hand calcium-binding domains as well as multiple potential phosphorylation sites, which enable their activation in response to raised cytosolic Ca2+ (Sagi and Fluhr, 2006). Indeed, the dynamics of changes in ROS and Ca2+ also are known to interact in the processes of ROS-induced Ca2+ release and Ca2+-induced ROS release (Gilroy et al., 2014).
A conceptual model for ROS wave propagation was produced by Dubiella et al. (2013), where Ca2+ acting via the calcium-dependent protein kinase family member 5 stimulates ROS production from the plasma membrane NADPH oxidase RBOHD and ROS is able to trigger Ca2+ influx across the plasma membrane into cells via ROS-regulated plasma membrane Ca2+ channels (Richards et al., 2014). This provides a self-propagation mechanism in which ROS triggers plasma membrane Ca2+ influx into the cell, potentially triggering CICR via TCP1 at the tonoplast. The cellular Ca2+ rise in turn activates RBOHD, which then produces more apoplastic ROS. ROS could potentially travel through the apoplast and trigger the same process in the neighboring cell.
This ROS-dependent model can be described mathematically to quantitatively analyze whether it is consistent with the observed stress-related Ca2+ waves. ROS-induced ROS release can be described by Equation 1, where u is now the concentration of ROS in the apoplast. ROS does not activate a neighboring RBOHD directly but via triggering increased Ca2+ in the cytoplasm, which in turn activates RBOHD. The critical threshold parameter uc incorporates the indirect nature and complexity of this activation process in one variable and so provides a mathematical means through which changes in Ca2+ behavior can feed back on ROS propagation without needing to parameterize the detailed molecular mechanisms behind this process. If higher levels of Ca2+ release are being maintained in a cell (e.g. because of TPC1 overexpression), then we would expect the RBOHDs to be activated more quickly, which can be represented in the model by a decreased uc, irrespective of the precise molecular mechanism responsible for the Ca2+-dependent activation.
ROS diffusion in the apoplast may be predicted to be faster than that of Ca2+ in the cytoplasm, as highly active cytoplasmic Ca2+ buffering and sequestration mechanisms limit the cytoplasmic movement of this ion (Allbritton et al., 1992); although it is important to note that the levels of ROS in the cell wall also are thought to be tightly regulated by a balance between their generation systems and ROS-scavenging mechanisms (Kärkönen and Kuchitsu, 2015). RBOHDs also exist at a higher density than TPC1 (Peiter et al., 2005; Hao et al., 2014). This puts the propagation of the ROS wave into the continuous regime (Pearson and Ponce-Dawson, 1998); therefore, the velocity of the ROS-assisted wave has a different functional form than from a purely CICR-driven process, in which it propagates as a saltatory wave (Coombes et al., 2004):
 |
(6) |
The wild-type velocity can be used to calculate the ratio of the unknown parameters. To test the model, we evaluated the velocity in the TPC1 overexpressor:
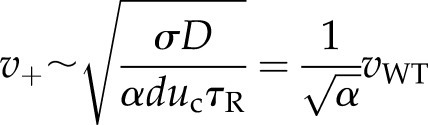 |
(7) |
where α is the decrease in the firing threshold uc due to the increase in TPC1 channels in the overexpressor. The number of channels increases by a factor of 24.2/8.6 (Peiter et al., 2005). Therefore, the rate of calcium-dependent activation of RBOHD should increase and uc should decrease. Using a first-order approximation for this response as a function of the number of channels results in α = 8.6/24.2, for which the model predicts v+ = 662.6 μm s−1. This estimate is well within the experimental uncertainty of the experimentally measured value of calcium wave speed from the overexpressor (Table I). Hence, this ROS-assisted CICR model is able to produce a good fit to the data.
Importantly for this ROS-assisted CICR model, we used the average value of channel density derived from Peiter et al. (2005). This parameter is independent of the underlying distribution of TPC1, being derived from the total number of channels observed divided by the number of samples. For the ROS-assisted model, only the number of TPC1 channels is used in the analysis, but as we demonstrated with the pure CICR model, clustering of TPC1 will tend to slow down wave propagation but is unlikely to affect the inferences drawn from the predictions.
Blocking ROS Production with DPI, Ascorbate, and in the AtrbohD Knockout Validates Predictions of the ROS-Assisted CICR Model
To empirically test the prediction of a ROS-assisted mechanism for Ca2+ wave propagation, we attempted to dissect the involvement of ROS in the Ca2+ wave by treating the root with the ROS scavenger ascorbate and the NADPH oxidase inhibitor DPI. To separate the effects of these compounds on the ability of the plant to propagate the wave versus the ability to initially trigger a stress response, we initiated a Ca2+ wave by locally treating the tip of the root with 100 mm NaCl in the absence of any inhibitor. The root system of Arabidopsis was growing through a Phytagel matrix, so the local treatment was applied by cutting an approximately 500-μm × 500-μm hole in the gel ahead of the root tip and letting the root apex grow into this window, which was subsequently filled with growth medium containing 100 mm NaCl. We had determined previously that this treatment localizes the salt stress to the very apex of the root and reproducibly triggers a Ca2+ wave propagating shootward from the root apex (Choi et al., 2014). Either 25 to 100 μm potassium ascorbate, 25 to 200 μm DPI, or growth medium (negative control) was applied locally 10 min prior to the root tip NaCl stimulation to a similar window cut into the gel surrounding the mature region of the root more than 1,000 μm shootward of the root tip. In all cases, the Ca2+ wave propagated at approximately 400 μm s−1 from the root tip to the region treated with inhibitor, but transit through the treatment region was altered depending on the pharmacological agent present. Calcium wave movement through the region treated with growth medium alone was maintained at 400 μm s−1. Treatment with 25 μm ascorbate slowed wave propagation to 64 µm s−1, and detectable Ca2+ changes were abolished with 100 μm ascorbate pretreatment. Treatment with up to 200 μm DPI significantly attenuated the magnitude of the Ca2+ increase and slowed propagation rates to 146 μm s−1 (Table I; Fig. 3A). These observations are consistent with a requirement for ROS and NADPH oxidase-mediated ROS production in Ca2+ wave transmission. Furthermore, knockout of AtRBOHD slowed propagation of the Ca2+ wave to 73 μm s−1 (Table I; Fig. 4; Supplemental Figs. S3 and S4).
One further prediction of the ROS-assisted CICR model is that loss of RBOH-driven ROS production in the oxTPC1 background will slow wave propagation:
 |
(8) |
with α as before. This suggests a velocity of 123 μm s−1. To test this prediction, we applied DPI to the oxTPC1 plants and monitored wave speeds. In the oxTPC1 background, a Ca2+ wave was still evident after pretreatment with DPI, but the rate of transmission was slowed to 134.4 µm s−1 (Supplemental Fig. S4).
Imaging of the Extracellular ROS Wave Using OxyBurst Green-Bovine Serum Albumin
Implicit in the ROS-assisted CICR model of Ca2+ wave propagation is that the Ca2+ wave should be accompanied by a similarly propagating wave of apoplastic ROS production. Although the presence of a ROS wave has been inferred from the wave-like activation of the ROS-dependent transcriptional response (Miller et al., 2009), direct measurement of the wave-like propagation of an apoplastic ROS signal has proven technically challenging. We used the ROS-sensing fluorescent dye OxyBurst Green H2HFF conjugated to bovine serum albumin (BSA) to exclude this ROS sensor from the cytoplasm of the root. OxyBurst becomes more fluorescent upon oxidation and so provides a measure of the kinetics of ROS increases (Monshausen et al., 2007, 2009). Therefore, we monitored OxyBurst fluorescence intensity before and after local NaCl stimulation of the root tip at points distant from the site of NaCl stimulation to try to capture the spread of a putative wave of ROS production. As OxyBurst shows an irreversible increase in fluorescence upon oxidation, the constitutive background ROS production by the root led to a slow increase in signal with time prior to treatment (Fig. 5, A and B; Supplemental Movie S1). Addition of growth medium to the root tip (control) led to a slight increase in OxyBurst signal measured 3,000 µm away from the root tip site of local medium addition (Fig. 5, A and B; Supplemental Movie S1), which may represent a small response to the mechanical signal generated by medium addition (Monshausen et al., 2007). However, when NaCl was added to the tip, this distal region showed a rapid and significantly larger increase in OxyBurst fluorescence (Fig. 5, A and B; Supplemental Movie S2). Calculation of the speed of movement of the signal triggering this response was made by monitoring the time for a significant increase (greater than 2 sd above prestimulated levels) in the mean OxyBurst signal monitored at 3,000 and 5,000 µm from the root apex in 14 replicate experiments. This analysis indicated a propagation speed of 374 µm s−1.
Figure 5.

Extracellular ROS increases accompany the Ca2+ wave to NaCl stimulation. A, Extracellular ROS monitored with OxyBurst Green-BSA measured 3,000 µm shootward of a wild-type root tip treated with medium (control) or 100 mm NaCl (see Supplemental Movies S1 and S2). B, Quantification of OxyBurst signal at 3,000 µm from the tip in the wild type and mutants in AtRBOHD and TPC1. C, Responses measured at 3,000 µm shootward in oxTPC1 treated with medium (control) or 100 mm NaCl added to the root tip. Signals were normalized to the mean signal for 60 s prior to additions at 0 s. OxyBurst becomes irreversibly more fluorescent as it is oxidized. Results are means ± se; n ≥ 5. For clarity, the data from atrbohD, tpc1-2, and oxTPC1 are shown across B and C. To allow for comparison, the same wild type + NaCl and control data are shown in both B and C.
Consistent with the model of ROS-assisted CICR, these ROS increases distal to the site of NaCl stimulation were dependent on AtRBOHD and TPC1, being attenuated in AtrbohD and tpc1-2 mutants (Fig. 5B). The ROS increase did not differ significantly (P > 0.05, ANOVA) from the wild-type response in the TPC1 overexpression line (Fig. 5C).
DISCUSSION
We have applied the fire-diffuse-fire model to explore the mechanisms behind the plant-wide transmission of stress-induced Ca2+ waves, focusing on the salt-induced wave of the root. Our analyses suggest that a simple CICR-based mechanism relying upon a self-reinforcing Ca2+ release from the vacuole via TPC1-dependent Ca2+ efflux and diffusion of Ca2+ between cells is unlikely to account for the observed velocity of wave movement. Extending this CICR mechanism for Ca2+ wave transit through the cell with Ca2+-dependent apoplastic ROS production to couple between cells, however, is able to support the observed velocities.
ROS have been implicated repeatedly in systemic signaling (Alvarez et al., 1998; Karpinski et al., 1999; Miller et al., 2009; Suzuki et al., 2013), and while it is tempting to identify this and the Ca2+ wave we have studied here as two sides of the same coin, there are important differences that have yet to be explained. First, the ROS wave in response to wounding travels at 1,400 μm s−1 (Miller et al., 2009), much faster than the Ca2+ wave we studied here. This difference might be because the wound-induced ROS wave propagates through the vascular tissue, whereas the Ca2+ wave appears to be restricted to the cortex and endodermis (Choi et al., 2014). The vasculature is well suited for long-distance transmission of signals (van Bel et al., 2014), particularly electrical signals. Alternatively, the triggering stimulus also may impact on propagation speed/mechanism. Indeed, the velocity of the wound-related ROS wave is very similar to that of electrical responses to wounding (Mousavi et al., 2013), suggesting that ROS and electrical signals may act together in the wounding response (van Bel et al., 2014). It is striking, however, that the signal velocity in the rbohD mutant is compromised in response to either salt stress (this study) or wounding (Miller et al., 2009), hinting at some possibly shared core components of the transmission machinery. Indeed, both the NaCl-triggered Ca2+ wave propagation (Choi et al., 2014) and the wound-induced systemic Ca2+ increases (Kiep et al., 2015) appear to be dependent on the TPC1, reinforcing the idea of conserved elements of the propagation system.
The activity of SV channels is known to be inhibited by ROS and activated by reducing agents (Carpaneto et al., 1999; Scholz-Starke et al., 2004; Pottosin et al., 2009), and this may at first sight appear contradictory to the ROS/TPC1-related propagation mechanism modeled above. However, since ROS is generated within the apoplast by RBOHDs, it would initially be able to rapidly gate ROS-activated channels in the plasma membrane. The ROS would then need to cross the plasma membrane and the cytoplasm before interacting with TPC1. It can take 0.9 s to develop a stable gradient of ROS across plasma membranes (Bienert et al., 2006), although the maximum theoretical rate could be much faster (Vestergaard et al., 2012). Given the speed of the Ca2+ wave in the wild type, it should take only approximately 2.5 ms (TPC1 channel separation over the wave speed) to activate each TPC1 in sequence; thus, it is unlikely that the ROS would have time to trigger a direct effect on TPC1’s ability to mediate the initial propagation phase of the Ca2+ wave. The slower ROS-triggered inactivation of TPC1, therefore, may have an important role to play in terminating the wave once it has moved through the cell. ROS-based TPC1 inactivation also could lead to a refractory period where the channel is unable to support further Ca2+ increases, leading to the wave-like progression of the Ca2+ increase.
Inherent to the model presented above is rapid triggering of TPC1 by ROS-dependent cytosolic Ca2+ increases. Although the SV channel has long been identified as being activated by cytosolic Ca2+ (Hedrich and Neher, 1987), large concentrations of Ca2+ are required (Guo et al., 2016). The ability of the SV channel to directly release Ca2+ also is a topic of some controversy (Hedrich and Marten, 2011), as large vacuolar Ca2+ concentrations inhibit the activation of TPC1 (Beyhl et al., 2009; Hedrich and Marten, 2011; Guo et al., 2016). The SV channel is known to be regulated by many other factors (for review, see Hedrich and Marten, 2011). For example, recent structural data have indicated a number of potential phosphorylation sites on TPC1 (Kintzer and Stroud, 2016), and the beet (Beta vulgaris) SV channel is activated by calmodulin (Pottosin et al., 2009). Such alternative regulatory mechanisms provide a wide range of other means for the activation of this channel as part of the Ca2+ wave transmission process. TPC1 also could be only indirectly responsible for the release of Ca2+ from the vacuole, possibly by controlling changes in membrane voltage that activate other channels (Peiter, 2011). Our modeling approach does not make any assumptions about TPC1’s role in mediating Ca2+ release, merely requiring that the activation of TPC1 leads to Ca2+ release, whether directly or indirectly.
The knockout of TPC1 that slows Ca2+ wave transmission approximately 40-fold only delays the Ca2+ response at the site of direct NaCl treatment by 30 s (Choi et al., 2014), suggesting that TPC1 may have a more pronounced role in transmission than in the initial direct stress response, consistent with the lack of an obvious Ca2+ dynamics phenotype in response to stress in tpc1-2 when measured at the whole-plant level (Ranf et al., 2008).
The model presented in Figure 6 also identifies two pools of Ca2+ that are likely to be important for generating the cytosolic Ca2+ wave, apoplastic, with influx through plasma membrane channels, and vacuolar, with influx to the cytosol, through TPC1 or a TPC1-related channel on the tonoplast. Thus, extracellular Ca2+ levels in the wall and lumenal Ca2+ levels in the vacuole may be other key regulators of Ca2+ wave propagation, especially as TPC1 is known to be responsive to both cytosolic and lumenal vacuolar Ca2+ levels as described above. While a role for extracellular Ca2+ signals is well established (e.g. in the stomatal response; Han et al., 2003; Nomura et al., 2008; Weinl et al., 2008), the potential for signaling-related dynamic changes of vacuolar lumenal Ca2+ levels remains poorly understood.
Figure 6.

Conceptual model of the propagation of the salt stress-induced Ca2+/ROS waves. ROS (green arrows) are produced in RBOHD (green circles) and diffuse through the apoplast, activating ROS-sensitive Ca2+ channels in the plasma membrane (light blue ellipse). These channels release Ca2+ into the cytosol (blue arrows) that activate TPC1 proteins (yellow circles), which, directly or indirectly, mediate Ca2+ release from the vacuole. Combined, this Ca2+ activates further RBOHD proteins, giving rise to a self-propagating ROS/Ca2+ wave. Passage between cells may be mediated by either diffusion of ROS through the apoplast or Ca2+ through the plasmodesmata.
Our direct imaging of a spreading extracellular ROS increase shown in Figure 5 provides a strong supporting element for the ROS-assisted CICR model of wave propagation. The dynamics of a ROS wave have been largely inferred from, for example, the timing and spatial patterning of the activation of ROS-responsive promoters (Miller et al., 2009). However, we have now been able to show that an extracellular ROS increase accompanied the Ca2+ wave moving at approximately 400 µm s−1, suggesting a propagating ROS wave. This ROS wave is dependent on AtRBOHD and TPC1, consistent with the ROS-assisted Ca2+ wave model where ROS trigger Ca2+ increases that then propagate and trigger further distal ROS responses. It is important to note here that although this wave of ROS increase appears to be moving at approximately the same velocity as the Ca2+ increase, this measurement of rate must be interpreted with caution. The OxyBurst Green-BSA sensor is designed to be excluded from the cell wall. Thus, this imaging technique relies on the diffusion of ROS from the surface of the root to the medium and so likely incorporates a delay in appearance as the ROS move through the apoplast and accumulate in the medium. This caveat is especially relevant as the NaCl-triggered Ca2+ wave, and by implication the ROS-related events associated with it, are initiated at the cortex and endodermis, so ROS would need to transit the epidermal apoplast to begin to leave the root. Therefore, although we can say that an extracellular ROS increase accompanies the Ca2+ wave, defining whether the ROS appear before or concurrent with the Ca2+ increases must await the development of improved extracellular ROS imaging technology. However, the inhibition of the propagation of the Ca2+ wave by treatment with DPI or ascorbate (Fig. 3) and in the atrbohD mutant (Fig. 4) suggests that the Ca2+ wave is at least dependent on ROS production. The residual wave transmission seen with DPI could reflect an incomplete inhibition of RBOH activity by this pharmacological agent or the action of a parallel, DPI-resistant ROS-generating mechanism as part of the wave propagation mechanism.
Our combination of mathematical modeling and experimental analysis supports the following model for the propagation of the systemic signal in response to salt. Locally, the application of salt triggers the movement of ions between various compartments in the cell, and in particular, the concentration of Ca2+ in the cytoplasm increases. This signal leads to the activation of RBOHD via its EF hand domains and via phosphorylation by Ca2+-binding kinases (Dubiella et al., 2013). As illustrated in Figure 6, local production of ROS by RBOHD is predicted to activate plasma membrane Ca2+ channels. ROS-sensitive Ca2+ channel activities have been monitored at the electrophysiological level in Arabidopsis root cells (Foreman et al., 2003; Demidchik and Maathuis, 2007; Ordoñez et al., 2014), and ROS-responsive candidates such as the annexins (Richards et al., 2014) have been identified at the molecular level, although their possible roles in Ca2+ wave transmission remain to be explored. This Ca2+ contributes to the activation of TPC1, resulting, directly or indirectly, in the release of more Ca2+ from the vacuole. ROS and Ca2+ diffuse within the apoplast and cytoplasm, respectively, activating neighboring channels until all the involved signaling proteins within a cell have been activated. The signaling molecules are able to diffuse between cells, ROS through the apoplast and Ca2+ through the plasmodesmata, where signaling in the next cell is activated. In the TPC1 overexpressor, the quantity of TPC1 channels is increased (Peiter et al., 2005), resulting in more Ca2+ being released and faster activation of RBOHDs and, therefore, a faster wave. Within the tpc1-2 mutant background, RBOHD and the plasma membrane Ca2+ channel form a linked propagation system. The observation that high concentrations of ascorbate can abolish the Ca2+ wave suggests that Ca2+ alone is insufficient to propagate the Ca2+ wave; therefore, in the rbohD mutant, it is possible that other sources of ROS act to give rise to the lower velocity wave.
While the modeling work presented here assumes ROS propagation through the apoplast, we cannot exclude the possibility that Ca2+ diffusing through the plasmodesmata is responsible for transmitting the signal between adjacent cells, or indeed that the two species act in tandem (Fig. 6). A TPC1-mediated CICR wave acting alone seems unlikely, and that motivated us to look at ROS propagation, but the requirement for a ROS-activated plasma membrane Ca2+ channel means there also could be sources of Ca2+ influx within the plasmodesmatal plasma membrane itself that could contribute to a rapid transmission event. Unfortunately, the resolution of current imaging techniques is unable to distinguish these possibilities.
TPC1 and AtRBOHD are expressed ubiquitously throughout the plant, so their distribution does not provide an obvious explanation for why the salt-induced Ca2+ wave preferentially transits through the cortical and endodermal cell layers. Similarly, candidates for the putative ROS-activated Ca2+-release channels, such as annexins and SKOR (Garcia-Mata et al., 2010; Richards et al., 2014), also are expressed throughout the root (Birnbaum et al., 2003). Thus, identifying the ROS-regulated channels involved with this signaling process, as well as other components that provide regulatory roles, represents a key challenge for the future that may provide important insights into the tissue-specific pattern of the Ca2+ wave.
MATERIALS AND METHODS
Plant Growth
Arabidopsis (Arabidopsis thaliana) ecotype Columbia-0 (Col-0), mutants in AtRBOHD and TPC1 in the Col-0 background, and the TPC1 overexpression line (in the Col-0 background) were germinated and grown under sterile conditions on a thin layer of gel (approximately 2 mm thick) containing one-half-strength Epstein’s medium with 10 mm Suc and 0.5% (w/v) Phytagel (Sigma-Aldrich) under 16 h of light/8 h of dark at 22°C for 6 d as described previously (Choi et al., 2014). AtrbohD was kindly provided by Dr. Andrew Bent (University of Wisconsin-Madison), and oxTPC1 and tpc1-2 were provided by Edgar Peiter (Martin-Luther-Universität) and Dale Sanders (John Innes Centre) and transformed with Yellow Cameleon Nano-65 GFP Ca2+ bioreporter as reported previously (Choi et al., 2014).
Ratio Imaging
Confocal ratio imaging was performed as described by Choi et al. (2014). Briefly, 7-d-old seedlings were grown as described above and imaged using a 20×/0.75 Plan-Apochromat objective on a Zeiss LSM510 confocal microscope, with 458-nm excitation, 458-nm primary dichroic, and 462- to 505-nm (CFP) and 526- to 537-nm (cpVenus/FRET) emission selected using the microscope’s Meta detector. Images were analyzed using the Image Calculator in the FIJI analysis package (Schindelin et al., 2012), and ratio data from the sequential confocal images were converted to a pseudocolored kymogram using MultiExperiment Viewer software version 10.2 (Saeed et al., 2003). Due to uncertainties in the applicability of in vitro calibration of this reporter to in vivo responsiveness, data are presented as raw ratios of YFP (cpVenus) to CFP signal intensities. Increasing YFP-CFP ratio signal represents an increase in Ca2+ levels.
Measuring Extracellular ROS with OxyBurst Green-BSA
Extracellular ROS production was measured essentially as described by Monshausen et al. (2009). A total of 200 µg mL−1 OxyBurst Green (dihydro-2′,4,5,6,7,7′-hexafluorofluorescein)-BSA (Life Technologies) dissolved in growth medium was added to the root approximately 10 min prior to treatment at the root tip. A ROI of 50 × 50 µm was then imaged either 3,000 or 5,000 µm from the root tip using a 20×/0.75 Plan-Apochromat objective on a Zeiss LSM780 confocal microscope, using 458-nm primary dichroic, 458-nm excitation, and 526- to 537-nm emission using the microscope’s Meta detector.
Inhibitor Treatments
For inhibitor treatments, a small window (approximately 500 μm × 500 μm) was made in the gel in the middle region of the root, shootward of the root tip, using the tip of a syringe needle as a knife to carefully remove the gel using a dissecting microscope. Ten microliters of 25 to 200 μm DPI (NADPH oxidase inhibitor) or potassium ascorbate (ROS scavenger) made up in one-half-strength Epstein’s medium with 10 mm Suc was added to the gel window 30 min prior to salt treatment of the root tip. Control plants were treated similarly, but with 25 μL of one-half-strength Epstein’s medium with 10 mm Suc in the window. To prevent the gel from drying out, these samples were kept in a humid petri dish prior to confocal imaging.
Total RNA Isolation and Quantitative Real-Time PCR Analysis
For QPCR analysis, root and shoot samples of 6-d-old seedlings of wild-type Col-0 and oxTPC1 were harvested in liquid nitrogen. Total RNA was then isolated from 50- to 200-mg tissue samples using the RNeasy Plant Mini Kit (Qiagen) followed by removing residual genomic DNA using the TURBO DNase Kit (RNase-free DNase I; Ambion) according to the manufacturer’s instructions. Total RNA (1–2 μg) was reverse transcribed into first-strand complementary DNA in a 40-µL reaction (25–50 ng total RNA µL−1) with ProtoScript II reverse transcriptase (New England Biolabs). QPCR analysis was done using an Applied Biosystems 7500 Real Time PCR system, and analysis was performed with the 7500 Software version 2.3 (Applied Biosystems). The Arabidopsis UBQ10 gene was used as an internal reference for standardization as described previously (Choi et al., 2014). First-strand complementary DNA proportional to 10 ng of genomic DNA-free starting total RNA was combined with 200 nm of each primer and 7.5 µL of 2× EvaGreen QPCR Master Mix with ROX passive reference dye (Biotium) in a final volume of 15 µL. QPCR was performed on a 96-well optical PCR plate (ABgene) using the following parameters: one cycle of 15 min at 95°C; 40 cycles of 20 s at 95°C, 30 s at 58°C, and 15 s at 65°C; and one cycle of dissociation from 58°C to 95°C with 0.5°C increments. Quantitation of the expression of AtTPC1 was calculated using the comparative threshold cycle method as described previously (Choi et al., 2014). The QPCR primers used are AtUBQ10-qPCR-F (UBQ10 forward primer, 5′-CACACTCCACTTGGTCTTGCGT-3′), AtUBQ10-qPCR-R (UBQ10 reverse primer, 5′-TGGTCTTTCCGGTGAGAGTCTTCA-3′), AtTPC1-qPCR-F(i) (TPC1 forward primer, 5′-GCTCTATTGGCGTACAGGTCTTTG-3′), and AtTPC1-qPCR-R(j) (TPC1 reverse primer, 5′-GAAGAGTGTGACCATTCCATTGG-3′).
Mathematical Modeling
A full simulation of the CICR model, illustrated in Figure 1A, uses Equation 1 assuming a fast Ca2+ release. Under this assumption, each release site xi firing at ti contributes
 |
to a reference point at position x and at time t. The total concentration is the sum of these terms over all Ca2+ releases, i, 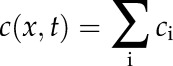 . This method requires calculation of the firing times of all releases and, therefore, places an upper limit on the temporal step size of the algorithm. We typically used a step size Δt = 10−6 s. Concentrations, c, were scaled by the firing threshold, uc,
  . Simulations were performed with code developed in C++ using the GNU science library root-finding function to fit the model to observed wave velocities.
Supplemental Data
The following supplemental materials are available.
Supplemental Figure S1. Effects of different parameters on the CICR model.
Supplemental Figure S2. TPC1 expression in root and shoot tissues of young seedlings.
Supplemental Figure S3. Ca2+ wave transmission rate in the atrbohD background.
Supplemental Figure S4. Calcium wave propagation in the oxTPC1 background pretreated with DPI.
Supplemental Movie S1. Surface ROS production in response to medium addition to the root tip.
Supplemental Movie S2. Surface ROS production in response to NaCl addition to the root tip.
Supplementary Material
Acknowledgments
We thank the Newcomb Imaging Center, Department of Botany, University of Wisconsin, for Ca2+ and ROS imaging.
Glossary
- ROS
reactive oxygen species
- SV
slow vacuolar
- CICR
calcium-induced calcium release
- QPCR
quantitative PCR
- DPI
diphenyliodonium
- BSA
bovine serum albumin
- Col-0
Columbia-0
Footnotes
This work was supported by the Biotechnology and Biological Sciences Research Council (BBSRC; Institute Strategic Programme grant BB/J004553/1) to R.J.M., by the BBSRC’s Norwich Research Park Doctoral Training Programme to M.J.E., and by the National Aeronautics and Space Administration (NNX13AM50G and NNX14AT25G) and the National Science Foundation (MCB-1329723) to S.G. and W.-G.C.
Articles can be viewed without a subscription.
References
- Allbritton NL, Meyer T, Stryer L (1992) Range of messenger action of calcium ion and inositol 1,4,5-trisphosphate. Science 258: 1812–1815 [DOI] [PubMed] [Google Scholar]
- Allen GJ, Sanders D (1996) Control of ionic currents in guard cell vacuoles by cytosolic and luminal calcium. Plant J 10: 1055–1069 [DOI] [PubMed] [Google Scholar]
- Alvarez ME, Pennell RI, Meijer PJ, Ishikawa A, Dixon RA, Lamb C (1998) Reactive oxygen intermediates mediate a systemic signal network in the establishment of plant immunity. Cell 92: 773–784 [DOI] [PubMed] [Google Scholar]
- Beyhl D, Hörtensteiner S, Martinoia E, Farmer EE, Fromm J, Marten I, Hedrich R (2009) The fou2 mutation in the major vacuolar cation channel TPC1 confers tolerance to inhibitory luminal calcium. Plant J 58: 715–723 [DOI] [PubMed] [Google Scholar]
- Bienert GP, Schjoerring JK, Jahn TP (2006) Membrane transport of hydrogen peroxide. Biochim Biophys Acta 1758: 994–1003 [DOI] [PubMed] [Google Scholar]
- Birnbaum K, Shasha DE, Wang JY, Jung JW, Lambert GM, Galbraith DW, Benfey PN (2003) A gene expression map of the Arabidopsis root. Science 302: 1956–1960 [DOI] [PubMed] [Google Scholar]
- Carpaneto A, Cantù AM, Gambale F (1999) Redox agents regulate ion channel activity in vacuoles from higher plant cells. FEBS Lett 442: 129–132 [DOI] [PubMed] [Google Scholar]
- Choi WG, Toyota M, Kim SH, Hilleary R, Gilroy S (2014) Salt stress-induced Ca2+ waves are associated with rapid, long-distance root-to-shoot signaling in plants. Proc Natl Acad Sci USA 111: 6497–6502 [DOI] [PMC free article] [PubMed] [Google Scholar]
- Christmann A, Weiler EW, Steudle E, Grill E (2007) A hydraulic signal in root-to-shoot signalling of water shortage. Plant J 52: 167–174 [DOI] [PubMed] [Google Scholar]
- Coombes S, Hinch R, Timofeeva Y (2004) Receptors, sparks and waves in a fire-diffuse-fire framework for calcium release. Prog Biophys Mol Biol 85: 197–216 [DOI] [PubMed] [Google Scholar]
- Dadacz-Narloch B, Beyhl D, Larisch C, López-Sanjurjo EJ, Reski R, Kuchitsu K, Müller TD, Becker D, Schönknecht G, Hedrich R (2011) A novel calcium binding site in the slow vacuolar cation channel TPC1 senses luminal calcium levels. Plant Cell 23: 2696–2707 [DOI] [PMC free article] [PubMed] [Google Scholar]
- Demidchik V, Maathuis FJ (2007) Physiological roles of nonselective cation channels in plants: from salt stress to signalling and development. New Phytol 175: 387–404 [DOI] [PubMed] [Google Scholar]
- Dempsey DA, Klessig DF (2012) SOS: too many signals for systemic acquired resistance? Trends Plant Sci 17: 538–545 [DOI] [PubMed] [Google Scholar]
- Dubiella U, Seybold H, Durian G, Komander E, Lassig R, Witte CP, Schulze WX, Romeis T (2013) Calcium-dependent protein kinase/NADPH oxidase activation circuit is required for rapid defense signal propagation. Proc Natl Acad Sci USA 110: 8744–8749 [DOI] [PMC free article] [PubMed] [Google Scholar]
- Farmer EE, Gasperini D, Acosta IF (2014) The squeeze cell hypothesis for the activation of jasmonate synthesis in response to wounding. New Phytol 204: 282–288 [DOI] [PubMed] [Google Scholar]
- Felle HH, Zimmermann MR (2007) Systemic signalling in barley through action potentials. Planta 226: 203–214 [DOI] [PubMed] [Google Scholar]
- Foreman J, Demidchik V, Bothwell JH, Mylona P, Miedema H, Torres MA, Linstead P, Costa S, Brownlee C, Jones JD, et al. (2003) Reactive oxygen species produced by NADPH oxidase regulate plant cell growth. Nature 422: 442–446 [DOI] [PubMed] [Google Scholar]
- Garcia-Mata C, Wang J, Gajdanowicz P, Gonzalez W, Hills A, Donald N, Riedelsberger J, Amtmann A, Dreyer I, Blatt MR (2010) A minimal cysteine motif required to activate the SKOR K+ channel of Arabidopsis by the reactive oxygen species H2O2. J Biol Chem 285: 29286–29294 [DOI] [PMC free article] [PubMed] [Google Scholar]
- Gattolin S, Sorieul M, Hunter PR, Khonsari RH, Frigerio L (2009) In vivo imaging of the tonoplast intrinsic protein family in Arabidopsis roots. BMC Plant Biol 9: 133. [DOI] [PMC free article] [PubMed] [Google Scholar]
- Gilroy S, Suzuki N, Miller G, Choi WG, Toyota M, Devireddy AR, Mittler R (2014) A tidal wave of signals: calcium and ROS at the forefront of rapid systemic signaling. Trends Plant Sci 19: 623–630 [DOI] [PubMed] [Google Scholar]
- Gradogna A, Scholz-Starke J, Gutla PVK, Carpaneto A (2009) Fluorescence combined with excised patch: measuring calcium currents in plant cation channels. Plant J 58: 175–182 [DOI] [PubMed] [Google Scholar]
- Guo J, Zeng W, Chen Q, Lee C, Chen L, Yang Y, Cang C, Ren D, Jiang Y (2016) Structure of the voltage-gated two-pore channel TPC1 from Arabidopsis thaliana. Nature 531: 196–201 [DOI] [PMC free article] [PubMed] [Google Scholar]
- Guo WJ, Nagy R, Chen HY, Pfrunder S, Yu YC, Santelia D, Frommer WB, Martinoia E (2014) SWEET17, a facilitative transporter, mediates fructose transport across the tonoplast of Arabidopsis roots and leaves. Plant Physiol 164: 777–789 [DOI] [PMC free article] [PubMed] [Google Scholar]
- Han S, Tang R, Anderson LK, Woerner TE, Pei ZM (2003) A cell surface receptor mediates extracellular Ca2+ sensing in guard cells. Nature 425: 196–200 [DOI] [PubMed] [Google Scholar]
- Hao H, Fan L, Chen T, Li R, Li X, He Q, Botella MA, Lin J (2014) Clathrin and membrane microdomains cooperatively regulate RbohD dynamics and activity in Arabidopsis. Plant Cell 26: 1729–1745 [DOI] [PMC free article] [PubMed] [Google Scholar]
- Hedrich R, Marten I (2011) TPC1-SV channels gain shape. Mol Plant 4: 428–441 [DOI] [PubMed] [Google Scholar]
- Hedrich R, Neher E (1987) Cytoplasmic calcium regulates voltage-dependent ion channels in plant vacuoles. Nature 329: 833–836 [Google Scholar]
- Hunter PR, Craddock CP, Di Benedetto S, Roberts LM, Frigerio L (2007) Fluorescent reporter proteins for the tonoplast and the vacuolar lumen identify a single vacuolar compartment in Arabidopsis cells. Plant Physiol 145: 1371–1382 [DOI] [PMC free article] [PubMed] [Google Scholar]
- Kärkönen A, Kuchitsu K (2015) Reactive oxygen species in cell wall metabolism and development in plants. Phytochemistry 112: 22–32 [DOI] [PubMed] [Google Scholar]
- Karpinski S, Reynolds H, Karpinska B, Wingsle G, Creissen G, Mullineaux P (1999) Systemic signaling and acclimation in response to excess excitation energy in Arabidopsis. Science 284: 654–657 [DOI] [PubMed] [Google Scholar]
- Keizer J, Smith GD, Ponce-Dawson S, Pearson JE (1998) Saltatory propagation of Ca2+ waves by Ca2+ sparks. Biophys J 75: 595–600 [DOI] [PMC free article] [PubMed] [Google Scholar]
- Kiep V, Vadassery J, Lattke J, Maass JP, Boland W, Peiter E, Mithofer A (2015) Systemic cytosolic Ca(2+) elevation is activated upon wounding and herbivory in Arabidopsis. New Phytol 207: 996–1004 [DOI] [PubMed] [Google Scholar]
- Kintzer AF, Stroud RM (2016) Structure, inhibition and regulation of two-pore channel TPC1 from Arabidopsis thaliana. Nature 531: 258–262 [DOI] [PMC free article] [PubMed] [Google Scholar]
- Macklon AES, Lumsdon DG, Sim A, Mchardy WJ (1996) Phosphate fluxes, compartmentation and vacuolar speciation in root cortex cells of intact Agrostis capillaris seedlings: effect of non-toxic levels of aluminium. J Exp Bot 47: 793–803 [Google Scholar]
- Miller G, Schlauch K, Tam R, Cortes D, Torres MA, Shulaev V, Dangl JL, Mittler R (2009) The plant NADPH oxidase RBOHD mediates rapid systemic signaling in response to diverse stimuli. Sci Signal 2: ra45. [DOI] [PubMed] [Google Scholar]
- Moghaddam PR, Wilman D (1998) Cell wall thickness and cell dimensions in plant parts of eight forage species. J Agric Sci 131: 59–67 [Google Scholar]
- Monshausen GB, Bibikova TN, Messerli MA, Shi C, Gilroy S (2007) Oscillations in extracellular pH and reactive oxygen species modulate tip growth of Arabidopsis root hairs. Proc Natl Acad Sci USA 104: 20996–21001 [DOI] [PMC free article] [PubMed] [Google Scholar]
- Monshausen GB, Bibikova TN, Weisenseel MH, Gilroy S (2009) Ca2+ regulates reactive oxygen species production and pH during mechanosensing in Arabidopsis roots. Plant Cell 21: 2341–2356 [DOI] [PMC free article] [PubMed] [Google Scholar]
- Mousavi SA, Chauvin A, Pascaud F, Kellenberger S, Farmer EE (2013) GLUTAMATE RECEPTOR-LIKE genes mediate leaf-to-leaf wound signalling. Nature 500: 422–426 [DOI] [PubMed] [Google Scholar]
- Nomura H, Komori T, Kobori M, Nakahira Y, Shiina T (2008) Evidence for chloroplast control of external Ca2+-induced cytosolic Ca2+ transients and stomatal closure. Plant J 53: 988–998 [DOI] [PubMed] [Google Scholar]
- Ordoñez NM, Marondedze C, Thomas L, Pasqualini S, Shabala L, Shabala S, Gehring C (2014) Cyclic mononucleotides modulate potassium and calcium flux responses to H2O2 in Arabidopsis roots. FEBS Lett 588: 1008–1015 [DOI] [PubMed] [Google Scholar]
- Pearson JE, Ponce-Dawson S (1998) Crisis on Skid Row. Physica A 257: 141–148 [Google Scholar]
- Peiter E. (2011) The plant vacuole: emitter and receiver of calcium signals. Cell Calcium 50: 120–128 [DOI] [PubMed] [Google Scholar]
- Peiter E, Maathuis FJM, Mills LN, Knight H, Pelloux J, Hetherington AM, Sanders D (2005) The vacuolar Ca2+-activated channel TPC1 regulates germination and stomatal movement. Nature 434: 404–408 [DOI] [PubMed] [Google Scholar]
- Ponce-Dawson S, Keizer J, Pearson JE (1999) Fire-diffuse-fire model of dynamics of intracellular calcium waves. Proc Natl Acad Sci USA 96: 6060–6063 [DOI] [PMC free article] [PubMed] [Google Scholar]
- Pottosin I, Wherrett T, Shabala S (2009) SV channels dominate the vacuolar Ca2+ release during intracellular signaling. FEBS Lett 583: 921–926 [DOI] [PubMed] [Google Scholar]
- Pottosin II, Schönknecht G (2007) Vacuolar calcium channels. J Exp Bot 58: 1559–1569 [DOI] [PubMed] [Google Scholar]
- Ranf S, Wünnenberg P, Lee J, Becker D, Dunkel M, Hedrich R, Scheel D, Dietrich P (2008) Loss of the vacuolar cation channel, AtTPC1, does not impair Ca2+ signals induced by abiotic and biotic stresses. Plant J 53: 287–299 [DOI] [PubMed] [Google Scholar]
- Richards SL, Laohavisit A, Mortimer JC, Shabala L, Swarbreck SM, Shabala S, Davies JM (2014) Annexin 1 regulates the H2O2-induced calcium signature in Arabidopsis thaliana roots. Plant J 77: 136–145 [DOI] [PubMed] [Google Scholar]
- Riley KF, Hobson MP, Bence SJ (1998) Mathematical Methods for Physics and Engineering, Ed 3 Cambridge University Press, Cambridge, UK [Google Scholar]
- Saeed AI, Sharov V, White J, Li J, Liang W, Bhagabati N, Braisted J, Klapa M, Currier T, Thiagarajan M, et al. (2003) TM4: a free, open-source system for microarray data management and analysis. Biotechniques 34: 374–378 [DOI] [PubMed] [Google Scholar]
- Sagi M, Fluhr R (2006) Production of reactive oxygen species by plant NADPH oxidases. Plant Physiol 141: 336–340 [DOI] [PMC free article] [PubMed] [Google Scholar]
- Schindelin J, Arganda-Carreras I, Frise E, Kaynig V, Longair M, Pietzsch T, Preibisch S, Rueden C, Saalfeld S, Schmid B, et al. (2012) Fiji: an open-source platform for biological-image analysis. Nat Methods 9: 676–682 [DOI] [PMC free article] [PubMed] [Google Scholar]
- Schneider CA, Rasband WS, Eliceiri KW (2012) NIH Image to ImageJ: 25 years of image analysis. Nat Methods 9: 671–675 [DOI] [PMC free article] [PubMed] [Google Scholar]
- Scholz-Starke J, De Angeli A, Ferraretto C, Paluzzi S, Gambale F, Carpaneto A (2004) Redox-dependent modulation of the carrot SV channel by cytosolic pH. FEBS Lett 576: 449–454 [DOI] [PubMed] [Google Scholar]
- Shuai JW, Jung P (2003) Optimal ion channel clustering for intracellular calcium signaling. Proc Natl Acad Sci USA 100: 506–510 [DOI] [PMC free article] [PubMed] [Google Scholar]
- Suzuki N, Miller G, Salazar C, Mondal HA, Shulaev E, Cortes DF, Shuman JL, Luo X, Shah J, Schlauch K, et al. (2013) Temporal-spatial interaction between reactive oxygen species and abscisic acid regulates rapid systemic acclimation in plants. Plant Cell 25: 3553–3569 [DOI] [PMC free article] [PubMed] [Google Scholar]
- Timofeeva Y, Coombes S (2003) Wave bifurcation and propagation failure in a model of Ca2+ release. J Math Biol 47: 249–269 [DOI] [PubMed] [Google Scholar]
- Torres MA, Dangl JL, Jones JDG (2002) Arabidopsis gp91phox homologues AtrbohD and AtrbohF are required for accumulation of reactive oxygen intermediates in the plant defense response. Proc Natl Acad Sci USA 99: 517–522 [DOI] [PMC free article] [PubMed] [Google Scholar]
- van Bel AJ, Furch AC, Will T, Buxa SV, Musetti R, Hafke JB (2014) Spread the news: systemic dissemination and local impact of Ca²⁺ signals along the phloem pathway. J Exp Bot 65: 1761–1787 [DOI] [PubMed] [Google Scholar]
- Vestergaard CL, Flyvbjerg H, Møller IM (2012) Intracellular signaling by diffusion: can waves of hydrogen peroxide transmit intracellular information in plant cells? Front Plant Sci 3: 295. [DOI] [PMC free article] [PubMed] [Google Scholar]
- Ward JM, Schroeder JI (1994) Calcium-activated K+ channels and calcium-induced calcium release by slow vacuolar ion channels in guard cell vacuoles implicated in the control of stomatal closure. Plant Cell 6: 669–683 [DOI] [PMC free article] [PubMed] [Google Scholar]
- Weinl S, Held K, Schlücking K, Steinhorst L, Kuhlgert S, Hippler M, Kudla J (2008) A plastid protein crucial for Ca2+-regulated stomatal responses. New Phytol 179: 675–686 [DOI] [PubMed] [Google Scholar]
- Werner T, Motyka V, Laucou V, Smets R, Van Onckelen H, Schmülling T (2003) Cytokinin-deficient transgenic Arabidopsis plants show multiple developmental alterations indicating opposite functions of cytokinins in the regulation of shoot and root meristem activity. Plant Cell 15: 2532–2550 [DOI] [PMC free article] [PubMed] [Google Scholar]
- Zhang Y, Zhu H, Zhang Q, Li M, Yan M, Wang R, Wang L, Welti R, Zhang W, Wang X (2009) Phospholipase Dα1 and phosphatidic acid regulate NADPH oxidase activity and production of reactive oxygen species in ABA-mediated stomatal closure in Arabidopsis. Plant Cell 21: 2357–2377 [DOI] [PMC free article] [PubMed] [Google Scholar]
- Zimmermann MR, Maischak H, Mithöfer A, Boland W, Felle HH (2009) System potentials, a novel electrical long-distance apoplastic signal in plants, induced by wounding. Plant Physiol 149: 1593–1600 [DOI] [PMC free article] [PubMed] [Google Scholar]
Associated Data
This section collects any data citations, data availability statements, or supplementary materials included in this article.