Abstract
Graphene nanomaterials have attracted wide attention in recent years on their application to state-of-the-art technology due to their outstanding physical properties. On the other hand, the nanotoxicity of graphene materials also has rapidly become a serious concern especially in occupational health. Graphene materials inevitably could become airborne in the workplace during manufacturing processes. The inhalation and subsequent deposition of graphene nanoparticles in the human respiratory tract could potentially result in adverse health effects to exposed workers. Therefore, investigating the deposition of graphene nanoparticles in the human airways is considered essential for an integral graphene occupational health study. For this reason, this study carried out a series of airway replica deposition experiments to obtain original data of graphene nanoparticle airway deposition. In this study, size classified graphene nanoparticles were delivered into human airway replicas (both nasal and oral-to-lung airways). The deposition fraction and efficiency of graphene nanoparticle in the airway were obtained by a novel experimental approach. The experimental results acquired showed that the fractional deposition of graphene nanoparticles in airway sections studied were all less than 4%, and the deposition efficiencies in each airway section were generally lower than 0.03. These results implies that the majority of the graphene nanoparticles inhaled into the human respiratory tract could easily penetrate through the head airways as well as the upper part of the tracheobronchial airways and then transit down to the lower lung airways, where undesired biological responses might be induced.
Keywords: Graphene, Nanoparticle, Human airway, Deposition Efficiency
INTRODUCTION
Graphene is a one-atom-thick, platelet-like nanomaterial constructed by pure carbon atoms first produced only a decade ago,(1) whereas it has drawn substantial scientific attention and technology interest today. The distinctive physical characteristics of graphene in terms of mechanical strength, physical elasticity, thermal conductivity and electrical property have made graphene a unique material for application in various high-tech products in areas of electronics, energy storage, and composite materials.(2) Besides, graphene also has proven to possess a great potential for biomedical and biotechnology application such as drug delivery, biosensing, and tissue engineering.(3) Because of these potential and valuable applications, graphene has become one of the intensively studied nanomaterials both in industry and academia.(4,5)
Despite its promising future, the nanotoxicity of graphene has also rapidly become a serious concern. According to published toxicity studies on graphene family materials (graphene family materials includes graphene nanosheets, few-layer graphene, graphene oxide, etc.),(6) mice administrated with graphene family materials could induce lung granuloma formation,(7) inflammation cell infiltration, pulmonary edema,(8) severe and persistent lung injury,(9) and acute pulmonary inflammatory and frustrated alveolar phagocytosis.(10) Some in vitro cell culture studies also indicated that graphene family materials could induce cytotoxic effects in human neuronal cells,(11) cause viability decreasing and apoptosis in human lung cells,(12) and show cell sensitivity and concentration-dependent cytotoxicity in alveolar basal epithelial cells.(13) Based on these research results, it would be safe to assume that the inhalation and deposition of graphene nanoparticles in the human respiratory tract might cause possible adverse biological response.
Due to the fact that graphene materials inevitably could become airborne during product harvesting, handling, and reactor cleaning processes in related workplaces,(14) workers and researchers in graphene associated manufactories and laboratories could involuntarily inhale graphene nanoparticles. The consequent deposition of graphene nanoparticles in workers’ respiratory tract could potentially pose adverse health effects to them. Thus, the risk of worker and researcher exposure to graphene nanoparticles in workplaces should be considered an essential occupational health issue in today's nanotechnology era. The investigation of the graphene nanoparticles airway deposition, therefore, should be the indispensable component of an integral graphene occupational health study.
However, because the dimension of the graphene nanoparticle is extremely small, it is infeasible to apply conventional airway deposition methods on graphene nanoparticles for conducting airway replica deposition studies. The conventional methods for particle airway replica deposition study involves either radioactive or fluorescent labeled test particles.(15, 16, 17) These experimental methods are considered technically difficult to apply on graphene nanomaterials not only because of the required radioactive facilities, but also due to the measurement limitation for fluorescent tagged nanoparticles. Therefore, there is a need for an alternative experimental method to carry out airway replica deposition experiments for nanoparticles. For this reason, a novel experimental approach has been developed in our laboratory and was employed previously in our laboratory for two airway replica deposition studies using carbon nanotubes.(18, 19) A great number of quality airway deposition data were acquired by using this experimental approach. In this study, the novel experimental approach was applied on graphene nanoparticles to obtain some original airway replica deposition data. This is the first time in literature that the graphene nanoparticle was employed for airway replica deposition experiments. The experimental data obtained from this study is believed to be valuable for assessing the risk of the worker exposure to airborne graphene nanomaterials in related occupational settings, considering the deposition portion shown in the upper airways can directly indicate the portion of the inhaled graphene nanoparticles that entered the lower airways. In addition, the deposition data acquired from this study can also be used for verifying numerical models newly developed for nanoparticle airway dosimetry estimation.
METHOD
The novel experimental approach, briefly speaking, is to generate size classified nanoparticles in preselected diameters and then deliver them into a human airway replica (and trimmed ones). The fractional deposition in each airway section is the principal data to be obtained. To achieve this goal, the graphene nanomaterial was aerosolized, size classified, and then delivered into the airway replica for measuring the needed data as explained by the following procedures.
Graphene Nanoparticle Generation
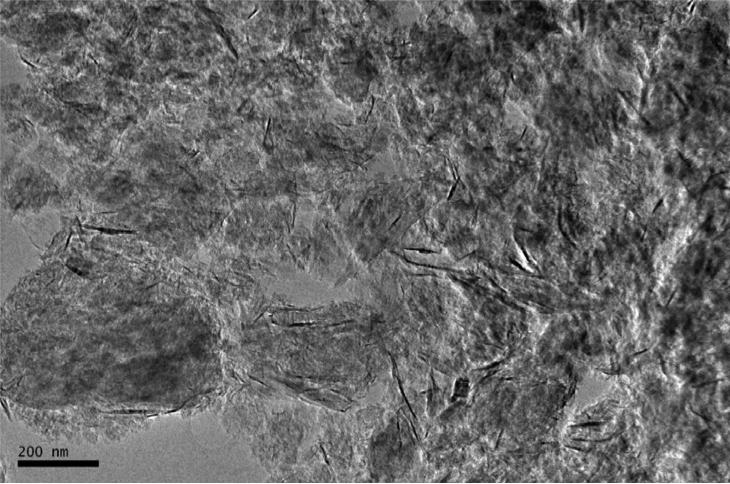
The graphene nanomaterial used for generating graphene nanoparticles was purchased from Cheap Tube Inc. (Brattleboro, VT, USA). This graphene nanomaterial was in grad 3, which contained 97% purity, 2 μm in platelet diameter, and 600-750 m2/g surface area. Figure 1 shows the morphology of the graphene nanomaterial under a transmission electron microscope (TEM). As can be seen, the graphene nanomaterial was severely agglomerated. Graphene in crumpled, crushed, and platelet-like shapes were found in the bulk material. To aerosolize the generate nanomaterial for the deposition study, an electrospray (Model 3480, TSI Inc., Shoreview, MN, USA) was employed. The electrospray is a widely applied aerosolization device capable of generating airborne nanomaterials with uniform size and shape. This electrospray has been used in a variety of studies for generating nanoparticles, including carbon nanotubes and engineered nanomaterials.(20, 21) To use electrospray for generating graphene nanoparticles, graphene suspension was prepared by adding 90 mg graphene material into 20 ml ethanol alcohol with 5 μl ammonium acetate as a buffer solution. The graphene suspension was treated with ultrasonicator for 10 minutes each time before being added into the electrospray for generating graphene nanoparticles. The capillary used for transporting graphene suspension in the electrospray was made of silica with ID of 100 μm and OD of 360 μm (Polymicro Technologies, Phoenix, AZ). When operating the electrospray, 4.0 psi differential pressure was set on the electrospray to push graphene suspension from the sample vial through the capillary tube to the opening end of the capillary. A high voltage of 2.3 kV was added to the capillary, which generated an electrical field at the end of the capillary and pulled the graphene suspension from the capillary to form tiny droplets. A mix of filtered air and CO2 (0.1 L/min each) was then used to evaporate ethanol in the droplets and have only graphene nanoparticles remaining in the air. Before leaving the outlet of the electrospray, the graphene nanoparticles were neutralized by a Po-210 ionizer.
FIGURE 1.
The morphology of the graphene nanomaterial used in this airway deposition study.
Graphene Nanoparticle Characterization
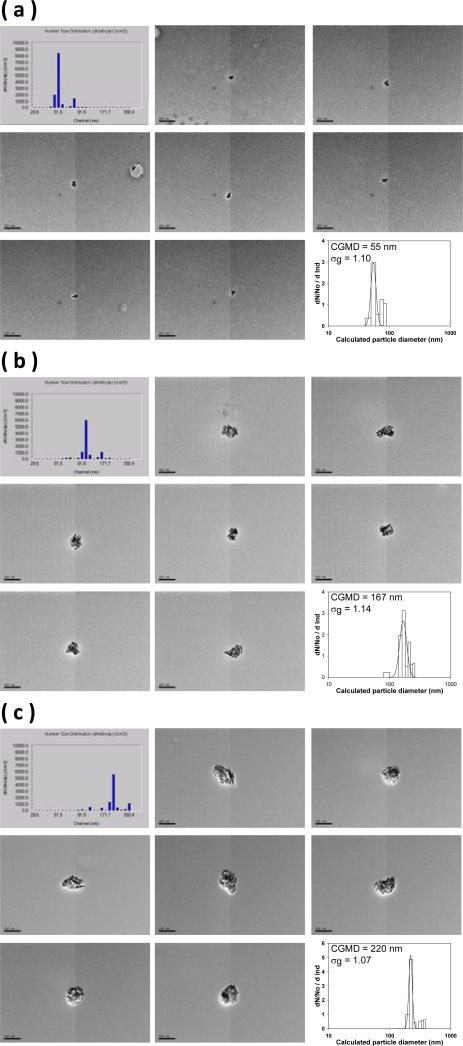
The graphene nanoparticles generated were then delivered to a differential mobility analyzer (DMA, Model 3071A, TSI Inc., Shoreview, MN) for size classification. The principle of the DMA is to use the balance between the electrostatic force and the air drag force acting on the nanoparticles to size classify them from polydisperse to monodisperse according to the electrical mobility diameter (dB) of the nanoparticles. The graphene nanoparticle size classification was conducted by delivering graphene nanoparticles of 1 L/min into the DMA, and the DMA was set with parameters (sheath flow of 10 L/min and assigned voltages) to size classify the graphene nanoparticles based on their dB. The preselected classification diameters for the graphene nanoparticles for the deposition study were 51, 101, and 215 nm. To ensure the size classified graphene nanoparticles having the designated classification diameter, a sequential mobility particle sizer (SMPS, GRIMM Aerosol Technik GmbH & Co., Germany) was used to monitor the size distribution of the classified graphene nanoparticles. Samples of the size classified graphene nanoparticles were also collected on TEM grids with a point-to-plane electrostatic precipitator (In-Tox Products, Albuquerque, NM) for morphology analysis. The morphology analysis was conducted by a JEOL 2010 TEM (JEOL Ltd., Tokyo, Japan). Pictures of graphene nanoparticles were taken for each classification diameter during the morphology analysis. Figure 2 shows the morphology of the size classified graphene nanoparticles inspected by the TEM, the size distribution measured by the SMPS, and the area equivalent diameter calculated based on the particle envelop area measured from corresponding particle TEM pictures.
FIGURE 2.
The morphology of the size classified graphene nanoparticles, size distribution measured by SMPS, and the area equivalent diameter calculated from the particle envelop area (a) 51 nm, (b) 101 nm, and (c) 215 nm (CGMD = count geometric median diameter; σg = geometric standard deviation; particle reference bars in each subpicture represents 200 nm).
To obtain the aerodynamic diameter (dae) for the size classified graphene nanoparticles, an aerosol particle mass analyzer (APM, Kanomax USA, Inc., Andover, NJ) was used for this purpose. The main body of the APM consists of two wired co-axis metal cylinders, and the nanoparticles were introduced inbetween the gap of the two cylinders while they were spinning. The principle of the APM is to utilize the balance between the electrostatic force (by varying the cylinder voltage) and centrifugal force (by varying the cylinder r.p.m) acting on the nanoparticle while passing through the gap of the two spinning cylinders to acquire the mass information of the nanoparticle of interest. By using the APM together with the DMA to form a DMA-APM tandem setup,(22, 23) and by using PSL particles with known size and density as reference particles, the aerodynamic diameter of the size classified graphene nanoparticles can then be estimated.
Human Airway Replicas
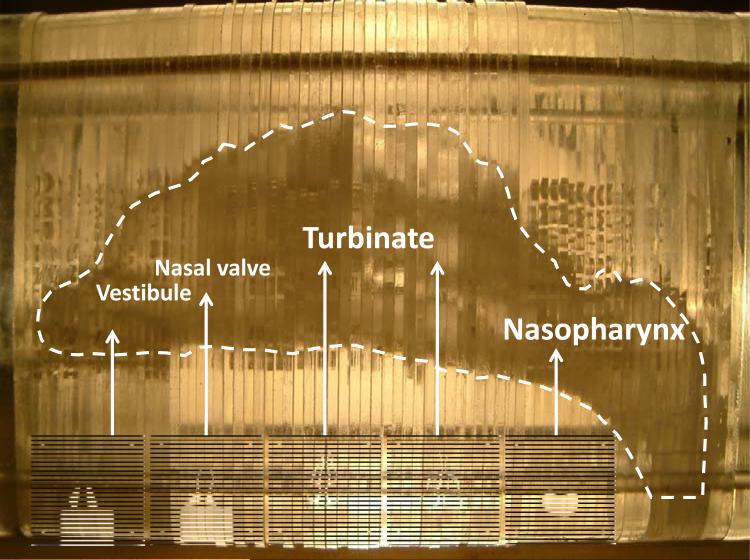
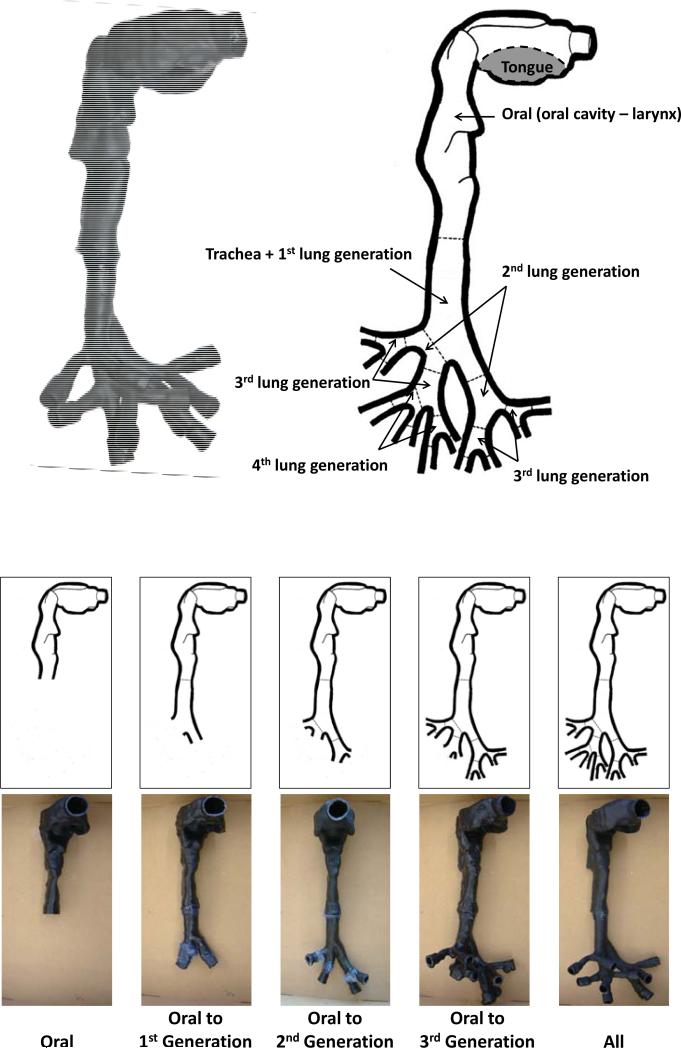
In this study, the airway deposition experiments were conducted with both nasal and oral-to-lung airway replicas. For the nasal airway deposition study, a nasal airway replica constructed with 77 acrylic plates (1.5 mm in thickness for each plate) was used. This nasal airway replica was made based on a set of in vivo head MRI scans of a male adult. This nasal airway replica consists of detailed nasal airway structures including the nostril, vestibule, nasal valve, turbinate, and nasopharynx. The airway geometry and the air flow field in this nasal airway replica have already been well studied,(24, 25) and this nasal airway replica has been employed in our laboratory for a number of airway deposition studies using spherical particles, fiber aerosols, and carbon nanotubes.(18, 26, 27) Deposition results obtained have demonstrated that this nasal airway replica is able to provide reliable experimental data for aerosol nasal airway deposition study. Figure 3 shows the nasal airway replica used in this study with sample acrylic plates in certain airway sections. For the oral-to-lung airway deposition study, a human respiratory tract replica made of conductive silicone rubber (KE-4576, Shin-Etsu Chemical Co., Ltd., Tokyo, Japan) was used. The original production mold of this human respiratory tract replica was made from a cadaver.(28) This human airway replica consists of an oral cavity, pharynx, larynx, and tracheobronchial airways down to part of the 4th lung generation. The geometry and dimension of this oral-to-lung airway replica also has been well studied.(29) This oral-to-lung airway replica also has been frequently used in our laboratory for aerosol airway deposition studies and numerous representative data were acquired.(17, 19, 30, 31) Figure 4 shows a physical model and illustrates the airway structure of the oral-to-lung airway replica. In this study, due to the design of the experimental approach used for conducting the airway deposition study, several identical oral-to-lung airway replicas were trimmed based on the human lung structure physiology to have only certain lung generations remain on the replica. All the trimmed airway replicas used in this study are also demonstrated in Figure 4. It is worth mentioning that, when preparing the nasal airway or the oral-to-lung airway replica for the deposition experiment, silicon oil (550 Fluid, Dow Corning Co., Midland, MI) was applied onto the inside surface of the replica (dripped overnight) to simulate the wet surface nature of the real human airways.
FIGURE 3.
The schematic of the human nasal airway replica.
FIGURE 4.
The schematic of the human oral-to-lung airway replica and the trimmed replicas.
Graphene Nanoparticle Airway Deposition Estimation
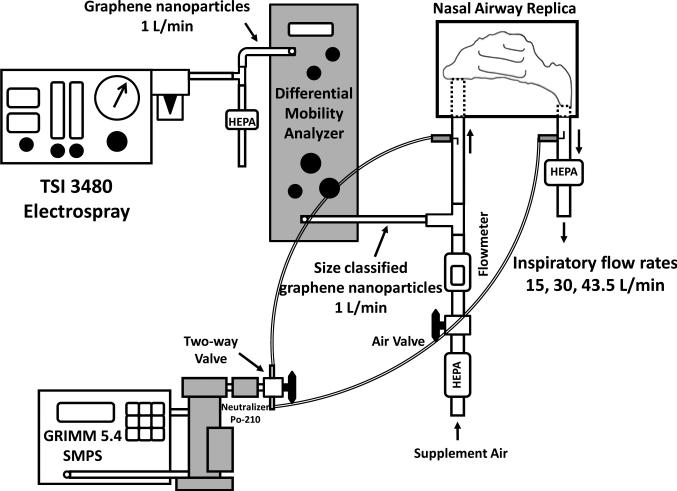
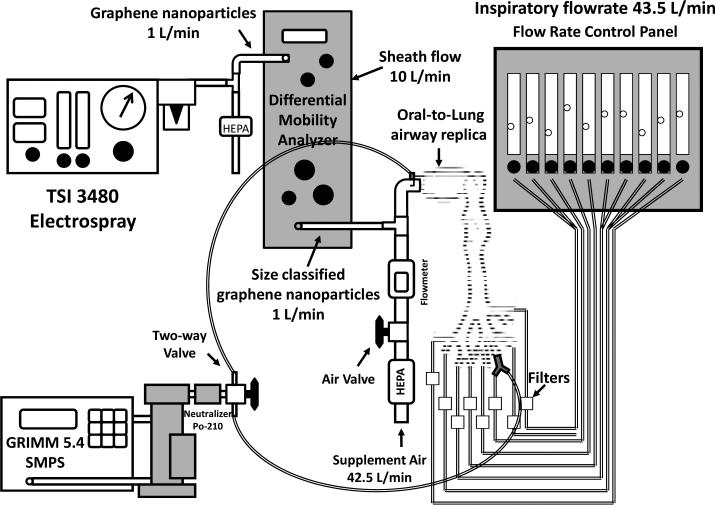
Figures 5 and 6 show the experimental setups of the graphene nanoparticle airway deposition studies for the nasal airway and oral-to-lung airway respectively. As can be seen, the DMA size classified graphene nanoparticles were delivered straight into the airway replica for the deposition experiments. The SMPS was used in the experiment for measuring the average concentrations, C, of the graphene nanoparticle in the airway replica. When measuring the average concentration, the SMPS output channels were rearranged to have only one channel that matches the designated classification diameter (the channel showing the peak concentration) to show on the SMPS monitor. In this way, it permits the tracking of the concentration variation of the size classified graphene nanoparticle over a period of time. The average concentration of graphene nanoparticle was measured in a pair (Cinlet, Coutlet) at both the inlet and outlet of the airway replica by using a two-way valve. For the nasal airway replica, since there is only one airway section (the entire nasal airway) and one outlet (nasopharynx) on the replica, only one pair of the graphene nanoparticle concentration was required to determine the airway deposition. However, for the oral-to-lung airway replica, there are a total of ten airway sections in replica. Therefore, several pairs of concentration were needed to determine the deposition in different airway sections. When all of the required concentration pairs were obtained, a set of corresponding concentration ratios, Coutlet/Cinlet, could then be calculated. These concentration ratios were the foundation in this study to estimate the deposition fraction of graphene nanoparticle in the human airways. The deposition fraction in this study is defined as the percentage (%) of the graphene nanoparticles deposited within a certain airway section to the total graphene nanoparticles that entered the entire airway replica.
FIGURE 5.
The experimental setup of graphene nanoparticle nasal airway deposition study.
FIGURE 6.
The experimental setup of graphene nanoparticle oral-to-lung airway deposition study.
In the nasal airway deposition experiments, inspiratory flow rates of 15, 30, and 43.5 L/min were used in the deposition study. These flow rates represent inhalation flow rates of workers from being at an at-ease status to having moderate workloads.(32) The Coutlet/Cinlet concentration ratios obtained by the SMPS from different experimental conditions can be directly used for calculating the nasal deposition fraction, Dnasal:
| (1) |
In the oral-to-lung airway deposition experiments, an inspiratory flow rate of 43.5 L/min was used for the deposition study. The flow rate distribution in the oral-to-lung airway for this inspiratory flow rate has already been well defined elsewhere.(33) To estimate the oral airway graphene nanoparticle deposition fraction, the experimental procedure is similar to that of the nasal airway study since the oral airway only has one airway section and one outlet as the nasal airway. The way to estimate the deposition fraction in a certain lung bifurcation in the tracheobronchial airways of the oral-to-lung airway replica is depicted as follows: given that a lung bifurcation has one parent tube (p) and two daughter tubes (d1 and d2 for the left daughter tube and right daughter tube, respectively), the graphene nanoparticle deposition fraction in that lung bifurcation can be calculated by the equation derived from the principle of mass conservation: (19)
| (2) |
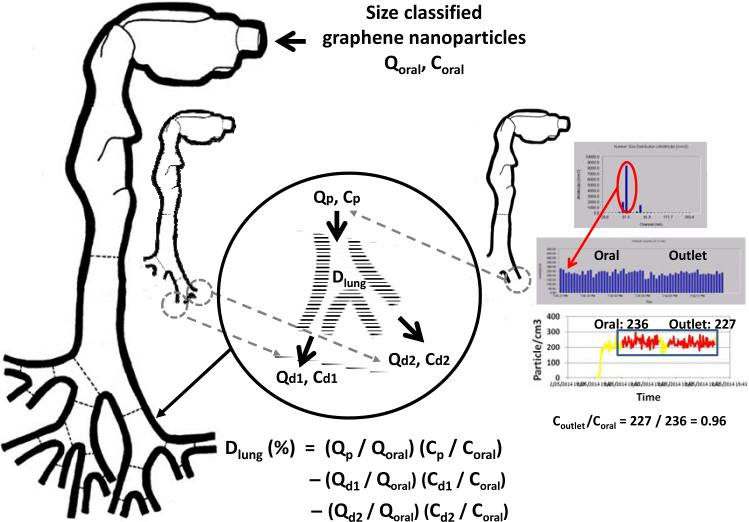
where Dlung is the deposition fraction (in percentage) of graphene nanoparticle in a certain lung bifurcation; Qp/Qoral, Qd1/Qoral, and Qd2/Qoral are respective flow rate ratios of the flow rate in the parent tube, left daughter tube, and right daughter tube with regarding to the total flow rate entering the oral airway (43.5 L/min in this study); Cp/Coral, Cd1/Coral, and Cd2/Coral, are the graphene nanoparticle concentration ratios measured at the parent tube, left daughter tube, and right daughter tube, respectively (the Coutlet/Cinlet mentioned above). Here, since the total flow rate and the flow rate distribution in the tracheobronchial airways are already defined, the Qp/Qoral, Qd1/Qoral, and Qd2/Qoral in equation (2) are all known variables. Thus, to calculate the deposition fraction for the lung bifurcation, the only unknowns for solving equation (2) are those concentration ratios. Once the concentration ratios, Coutlet/Cinlet, are measured for each lung bifurcation on the oral-to-lung airway replica, the graphene nanoparticle deposition fraction in each lung bifurcation can be estimated, and a complete airway fractional deposition map can then be constructed. To facilitate measuring all necessary Coutlet/Cinlet on the oral-to-lung airway replica to calculate deposition fractions, the trimmed airway replicas shown in Figure 4 were made for this purpose. With these trimmed airway replicas, Coutlet/Cinlet for each lung tube on the oral-to-lung airway replica can be obtained. Figure 7 summarizes the procedure of how to measure the Coutlet/Cinlet for size classified graphene nanoparticles, as well as the way to calculate the deposition fraction for a certain lung bifurcation. In this study, the Coutlet/Cinlet for each experimental condition (combined with different classification diameters, flow rates, and lung tube outlets) was measured at least three times for obtaining statistically meaningful results.
FIGURE 7.
The procedure of the measurement and calculation for graphene nanoparticle concentration ratio.
Also, in this study, graphene nanoparticle delivery loss due to diffusion deposition in the tubing system of the experimental setup was considered and thoroughly addressed. Separate experiments were carried out by size classified NaCl nanoparticles with the same designated classification diameters as graphene nanoparticles for investigating the delivery efficiency of the experimental setup. From the investigation, a set of delivery efficiency correction factors (F) covering all experimental conditions and airway replicas in this study were acquired. The delivery efficiency correction factor, F, was then incorporated into the equation (1) and (2) to calculate the final airway deposition fraction: True concentration ratio = F × Measured concentration ratio. In this way, it is believed a more accurate graphene nanoparticle airway deposition can be achieved. For the sake of brevity, the experimental procedure and results regarding the investigation of the particle delivery efficiency correction factors are not repeated here; all of the details can be found in our previous works.(18, 19)
RESULTS
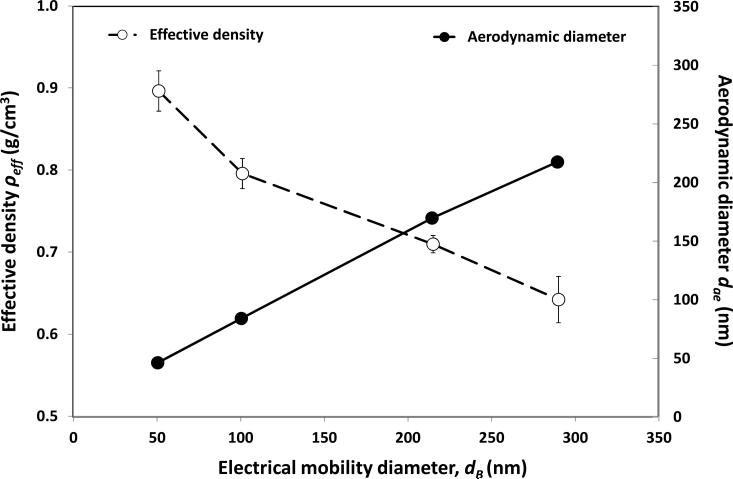
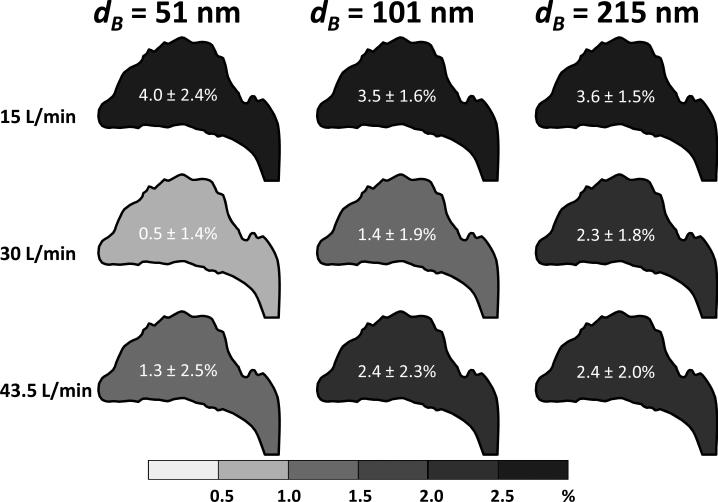
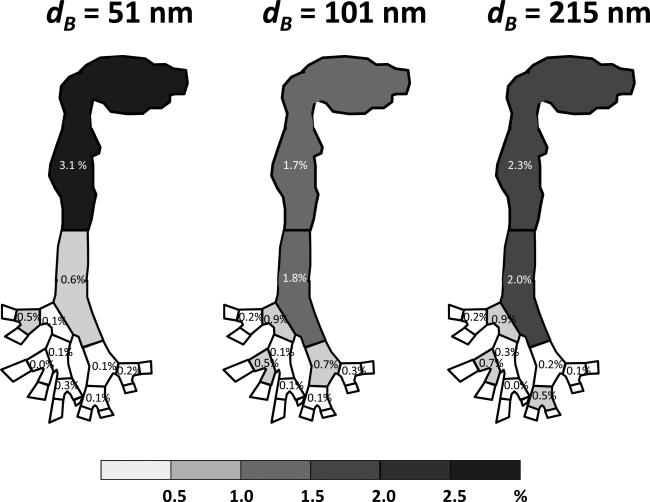
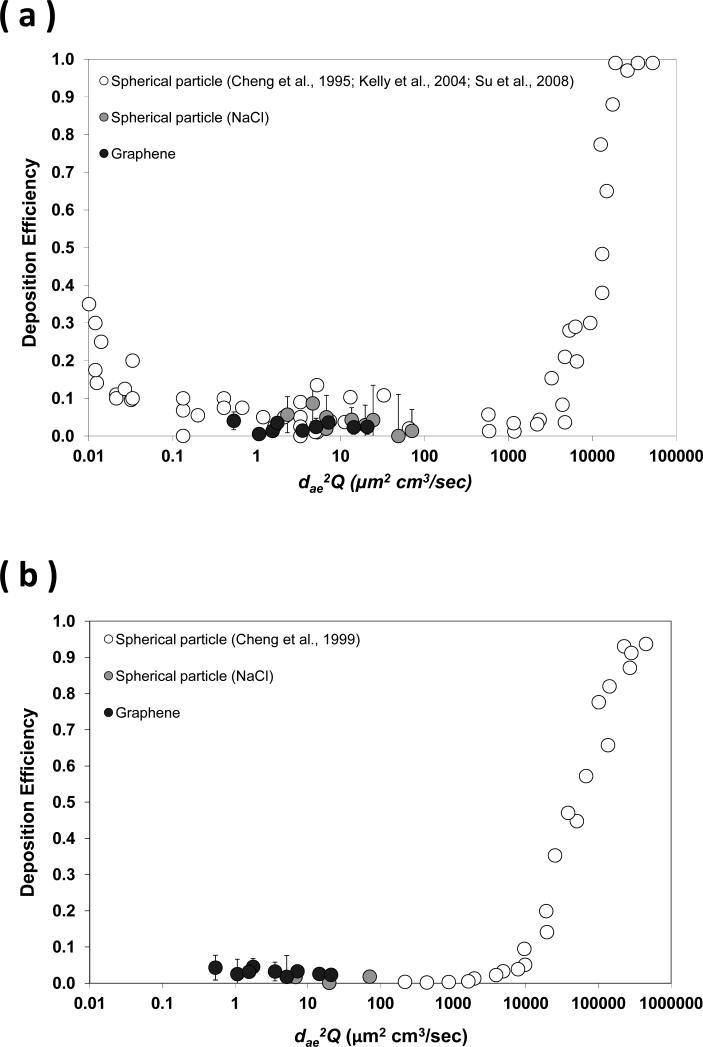
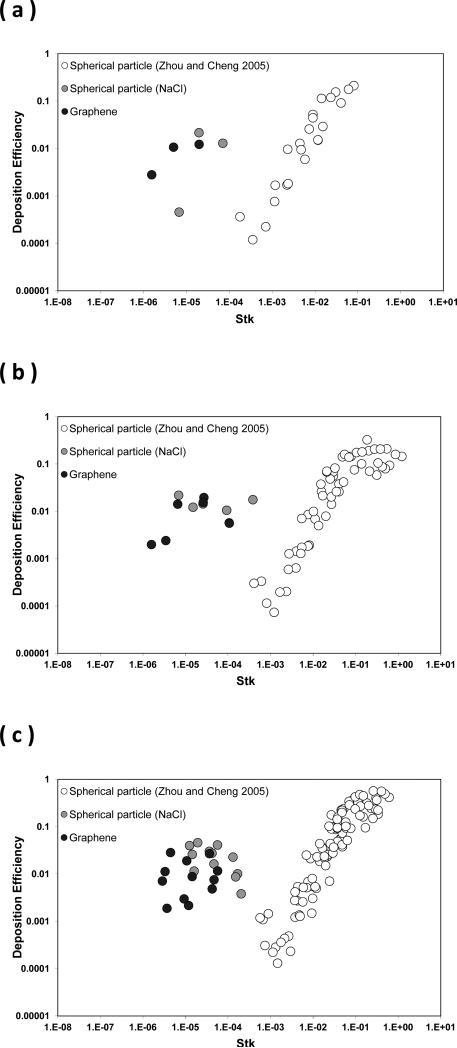
Figure 8 shows the calculated aerodynamic diameter (dae) and effective density (ρeff) of the size classified graphene nanoparticle acquired from the DMA-APM tandem study. Figures 9 and 10 display the fractional deposition map of size classified graphene nanoparticles in the human nasal airway and oral airway respectively. Figure 11a presents the nasal deposition efficiency of graphene nanoparticles as a function of impaction parameter dae2Q (Q is the flow rate in the airway). The impaction parameter is a common physical parameter used for presenting aerosol airway deposition data in irregular or complicated human airways such as nasal and oral airways. The deposition efficiency is defined as the ratio of graphene nanoparticles deposited within a certain airway section to the total graphene nanoparticles that entered that airway section. The deposition efficiency in any airway section of the airway replica can be calculated by the fractional deposition map data shown in Figures 9 and 10. Also shown in Figure 11a are published data of nasal deposition efficiency acquired by using spherical particles.(27, 34, 35) Similarly, Figure 11b presents the graphene nanoparticle oral deposition efficiency as a function of impaction parameter together with published spherical particle data.(30) Figures 12a to 12c show the deposition efficiency in the tracheobronchial airways from the 1st to the 3rd lung generation. The deposition efficiencies were plotted against the Stokes number. The Stokes number for a particle in a lung bifurcation is expressed as Stk = ρo dae Us / 18ηD (ρo is the density of water, dae is displayed in Figure 8, Us is the mean air velocity in the parent tube, η is the air viscosity, and D is the mean diameter of the parent tube). The Stk is a dimensionless physical parameter frequently used for presenting aerosol deposition in the lung airways. Also shown in Figures 12 are deposition data of size classified NaCl particles obtained from this study, as well as other spherical particle data acquired previously from our laboratory.(17) It is worth noting that the spherical particle data shown in Figures 11 and 12 are for the purpose of data comparison, because all of these data were acquired from the same nasal and oral-to-lung airway replicas.
FIGURE 8.
The effective density and the aerodynamic diameter of the size classified graphene nanoparticles as a function of the classification diameter (electrical mobility diameter).
FIGURE 9.
The deposition fraction of size classified graphene nanoparticles in the nasal airway.
FIGURE 10.
Fractional deposition maps of size classified graphene nanoparticles in the human respiratory tract replica.
FIGURE 11.
The deposition efficiency of graphene nanoparticles in (a) nasal airway, and (b) oral airway as a function of the impaction parameter.
FIGURE 12.
The deposition efficiency of graphene nanoparticles in the human tracheobronchial airways as a function of the Stokes number (a) 1st lung generation, (b) 2nd lung generation, and (c) 3rd lung generation.
DISCUSSION
As can be seen in Figure 2, the graphene nanoparticles could be ideally size classified by their dB. For each designated classification diameter (51, 101, or 215 nm), an apparent peak concentration was shown right at the channel bar corresponding to the designated classification diameter on the SMPS. This result implies that the majority of the graphene nanoparticles coming out of the DMA possessed the same dB, which can also be evidently seen by the morphology of the graphene nanoparticles shown on the same figure. Therefore, in this study, the airway deposition data obtained from each classification diameter could be warranted to be generated by graphene nanoparticles with a same physical property, dB.
Also, from the graphene nanoparticle morphology presented in Figure 2, it is noticeable that the graphene nanoparticles were generally isometric in shape. The increase of the classification size made the particle diameter increase, but remained the particle morphology basically unchanged. When taking a close look at the graphene nanoparticle, it was found that the graphene nanoparticles are constructed by agglomerated graphene platelets. This might be due to the fact that all of the graphene nanoparticles were formed by evaporated graphene suspension droplets. The evaporation of the alcohol portion in a graphene suspension droplet will result in droplet shrinking and inside graphene nanoplatelet agglomerating, which eventually forms the particle morphology presented. A field sampling study conducted at a graphene manufactory also indicated that graphene aerosols released in the workplaces was primarily graphene agglomerates.(14) Therefore, the use of size classified graphene nanoparticles in the form of agglomeration for airway deposition experiments in this study is considered realistic and also practical to a certain extent. It is widely accepted that graphene agglomerates, once deposited in the lung airways, will gradually disperse in the lung mucus where the onset of graphene platelets nanotoxicity effects found in those in vivo and in vitro studies can then be seen.
Figure 8 indicates that the effective density, ρeff, of the size classified graphene nanoparticle was less than 1 g/cm3 in general (the density of carbon: ~2.0 g/cm3) and decreased as the designated classification diameter increased. This result implies that agglomerated graphene nanoparticles generated in this study contain a considerable portion of empty space within (lossed structure). The larger the particle size, the larger the portion of empty space. This phenomenon is in agreement with what was found in other published research on aggregate nanoparticles and nanofibers.(23, 36) Based on these ρeff acquired, the calculated dae for corresponding size classified graphene nanoparticles at 51, 101, 215 nm was found to be 47, 84, 167 nm respectively.
The graphene nanoparticle fractional deposition map shown in Figures 9 and 10 indicate that the deposition of graphene nanoparticles in airway replicas was generally low and expressed basically no appreciable difference between different classification diameters. It can be seen that the deposition fractions were generally less than 4% in all airway sections examined in this study, and no apparent deposition pattern and trend was shown regarding the location in the oral-to-lung airway replica. In the nasal airway, the deposition fraction ranged from 1.3% to 2.4%. In the oral-to-lung airway, a considerable fraction of the graphene nanoparticles were found to deposit in the oral airway (1.7% to 3.1%) due to the fact that the oral airway (from the oral cavity to the larynx) contains a relatively larger total surface area for the graphene nanoparticle to deposit. In the tracheobronchial airways, the deposition fractions were found generally less than 1% from the 2nd to the 4th lung generations. The total fraction of the graphene nanoparticle deposited in the nasal and oral-to-lung airways together was around 10%. These results reveal that nearly 90% of the graphene nanoparticles (with the diameter studied in this research) inhaled into the human airway could easily penetrate through to the human upper airways.
Figures 11 and 12 express that the deposition efficiency of graphene nanoparticles in the human airways were generally less than 0.03. Published studies in literature also reported similar deposition results for ultrafine particles having close diameters as seen in this study.(15, 16) The low deposition efficiencies shown here prove again that most of the graphene nanoparticles entering into the human respiratory tract can easily penetrate through airway sections in the upper airways. When comparing the deposition efficiencies of graphene nanoparticles to those of NaCl particles, it can be seen that all of the data points were scattered and showed no significant discrepancy between different data sets. Moreover, it can be seen in Figure 12 that data points were well connected between the nano-scale group (three sizes from 51 to 215nm) and the micro-scale group (eight sizes from 0.98 to 30 μm) forming a smooth data trend. The trend of the deposition efficiency reveals a well-recognized aerosol airway deposition characteristic: particles in the micro-scale show an increase of the deposition efficiency proportionally to the increase of the particle inertia. The airway deposition mechanism for these micro-scale particles is inertia impaction. On the other hand, particles in the nano-scale as studied in this research hold low particle inertia, their deposition efficiencies in the airway are low, and the deposition mechanism of these nano-scale particles in the airway should be Brownian diffusion.
Based on all of the deposition results acquired from this study, it is reasonable to summarize that, in the range of the nanoparticle diameter studied in this research (around 50 to 200 nm), even though the morphology of the nanoparticles are various (such as graphene nanoparticles vs. NaCl nanoparticles), as long as they possess a similar dB, their dae won't be discrepant significantly, which will result in a similar aerodynamic behavior and comparable deposition efficiency in the airway. Also, it was clearly shown in this study that the inhaled graphene nanoparticles can easily pass through the human nasal, oral, and upper portion of the tracheobronchial airways. Therefore, worker exposure to graphene nanoparticles in related graphene manufacturing workplaces could result in a considerable amount of graphene nanoparticles entering in the lower airways, where adverse health effects could possibly be induced.
CONCLUSION
The inhalation and deposition of airborne graphene nanoparticles in the human airways could cause possible adverse health effects to workers in graphene nanomaterial related workplaces. Studying the deposition of graphene nanoparticles in the human airway, therefore, is very important from the viewpoint of occupational health. In this study, graphene nanoparticles were generated, size classified, and delivered into human airway replicas for airway deposition experiments using a novel experimental approach. The fractional deposition map obtained from this study showed that the graphene nanoparticle deposition in the studied airway sections were all less than 4%, and the deposition efficiency in each airway section was generally lower than 0.03. This result implies that most of the graphene nanoparticles inhaled into the respiratory tract would enter the lower tracheobronchial airways, where potential health effects might be induced. Moreover, it was found that nanoparticles having similar dB will behave similarly in the airway, which will result in comparable deposition efficiencies in airways. The experimental approach employed in this deposition study proved to be a desired experimental method for carrying out airway deposition study using size classified nanoparticles.
ACKNOWLEDGEMENT
The authors are grateful to Eileen Kuempel at NIOSH for developing the concept of this research project and to Bean T. Chen, and Bahman Asgharian for useful suggestions on data analysis. This project was sponsored by NIOSH contract 254-2010-M-36304, 214-2012-M-52048 and research grant R01OH010062.
REFERENCES
- 1.Novoselov KS, Geim AK, Morozov SV, Jiang D, Zhang Y, Dubonos SV, et al. Electric field effect in atomically thin carbon films. Science. 2004;306:666–669. doi: 10.1126/science.1102896. [DOI] [PubMed] [Google Scholar]
- 2.Geim K. Graphene: status and prospects. Science. 2009;324:1530–1534. doi: 10.1126/science.1158877. [DOI] [PubMed] [Google Scholar]
- 3.Seabra AB, Paula AJ, Lima R, Alves OL, Duran N. Nanotoxicity of Graphene and Graphene Oxide. Chemical Research in Toxicology. 2014;27:159–168. doi: 10.1021/tx400385x. [DOI] [PubMed] [Google Scholar]
- 4.Kim KS, Zhao Y, Jang H, Lee SY, Kim JM, Kim KS, et al. Large-scale pattern growth of graphene films for stretchable transparent electrodes. Nature. 2009;457:706–710. doi: 10.1038/nature07719. [DOI] [PubMed] [Google Scholar]
- 5.De Volder MFL, Tawfick SH, Baughman RH, Hart AJ. Carbon nanotubes: present and future commercial applications. Science. 2013;339:535–539. doi: 10.1126/science.1222453. [DOI] [PubMed] [Google Scholar]
- 6.Jastrzebska MA, Kurtycz P, Olszyna AR. Recent advances in graphene family materials toxicity investigations. Journal of Nanoparticle Research. 2012;14:1320. doi: 10.1007/s11051-012-1320-8. [DOI] [PMC free article] [PubMed] [Google Scholar]
- 7.Wang K, Ruan J, Song H, Zhang J, Wo Y, Guo S, et al. Biocompatibility of Graphene Oxide. Nanoscale Research Letters. 2011;6:8. doi: 10.1007/s11671-010-9751-6. [DOI] [PMC free article] [PubMed] [Google Scholar]
- 8.Zhang XY, Yin JL, Peng C, Hu WQ, Zhu ZY, Li WX, et al. Distribution and biocompatibility studies of graphene oxide in mice after intravenous administration. Carbon. 2011;49(3):986–995. [Google Scholar]
- 9.Duch MC, Budinger GR, Liang YT, Soberanes S, Urich D, Chiarella SE, et al. Minimizing oxidation and stable nanoscale dispersion improves the biocompatibility of graphene in the lung. Nano Letters. 2011;11:5201–5207. doi: 10.1021/nl202515a. [DOI] [PMC free article] [PubMed] [Google Scholar]
- 10.Schinwald A, Murphy FA, Jones A, MacNee W, Donaldson K. Graphene-based nanoplatelets: a new risk to the respiratory system as a consequence of their unusual aerodynamic properties. ACS Nano. 2012;6(1):736–746. doi: 10.1021/nn204229f. [DOI] [PubMed] [Google Scholar]
- 11.Zhang Y, Ali SF, Dervishi E, Xu Y, Li Z, Casciano D, Biris AS. Cytotoxicity effects of graphene and single-wall carbon nanotubes in neural phaeochromocytoma-derived PC12 cells. ACS Nano. 2010;4(6):3181–3186. doi: 10.1021/nn1007176. [DOI] [PubMed] [Google Scholar]
- 12.Vallabani NVS, Mittal1 S, Shukla RK, Pandey AK, Dhakate SR, Pasricha R, et al. Toxicity of Graphene in Normal Human Lung Cells (BEAS-2B). Journal of Biomedical Nanotechnology. 2011;7:106–107. doi: 10.1166/jbn.2011.1224. [DOI] [PubMed] [Google Scholar]
- 13.Hu W, Peng C, Lv M, Li X, Zhang Y, Chen N, et al. Protein corona-mediated mitigation of cytotoxicity of graphene oxide. ACS Nano. 2011;5(5):3693–3700. doi: 10.1021/nn200021j. [DOI] [PubMed] [Google Scholar]
- 14.Heitbrink WA, Lo LM, Dunn KH. Exposure controls for nanomaterials at three manufacturing sites. Journal of Occupational and Environmental Hygiene. 2014 doi: 10.1080/15459624.2014.930559. DOI: 101080/15459624.2014.930559. [DOI] [PMC free article] [PubMed] [Google Scholar]
- 15.Cohen BS, Sussman RG, Lippmann M. Ultrafine particle deposition in a human tracheobronchial cast. Aerosol Science and Technology. 1990;12:1082–1091. [Google Scholar]
- 16.Smith S, Cheng YS, Yeh HC. Deposition of ultrafine particle in human tracheobronchial airway of adults and children. Aerosol Science and Technology. 2001;35:697–709. [Google Scholar]
- 17.Zhou Y, Cheng YC. Particle deposition in a cast of human tracheobronchial airways. Aerosol Science and Technology. 2005;39:492–500. [Google Scholar]
- 18.Su WC, Cheng YS. Carbon nanotubes size classification, characterization, and nasal airway deposition. Inhalation Toxicology (accepted) 2014a doi: 10.3109/08958378.2014.960107. [DOI] [PubMed] [Google Scholar]
- 19.Su WC, Cheng YS. Estimation of carbon nanotubes deposition in a human respiratory tract replica. Journal of Aerosol Science (accepted) 2014b [Google Scholar]
- 20.Johnsson AC, Camerani MC, Abbas Z. Combined electrospray-SMPS and SR SAXS investigation of colloidal silica aggregation. part I. influence of starting material on gel morphology. Journal of Physical Chemistry B. 2011;115(5):765–775. doi: 10.1021/jp1057995. [DOI] [PubMed] [Google Scholar]
- 21.Ku BK, Kulkarni P. Morphology of single-wall carbon nanotube aggregates generated by electrospray of aqueous suspensions. Journal of Nanoparticle Research. 2009;11(6):1393–1403. [Google Scholar]
- 22.McMurry PH, Wang X, Park K, Ehara K. The relationship between mass and mobility for atmospheric particles: a new technique for measuring particle density. Aerosol Science and Technology. 2002;36:227–238. [Google Scholar]
- 23.Park K, Cao F, Kittelson DB, McMurry PH. Relationship between particle mass and mobility for diesel exhaust particles. Environmental Science and Technology. 2003;37:577–583. doi: 10.1021/es025960v. [DOI] [PubMed] [Google Scholar]
- 24.Subramaniam RP, Richardson RB, Morgan KT, Kimbell JS, Guilmette RA. Computational fluid dynamics simulations of inspiratory airflow in the human nose and nasopharynx. Inhalation Toxicology. 1998;10:91–120. [Google Scholar]
- 25.Zwartz GJ, Guilmette RA. Effect of flow rate on particle deposition in a replica of a human nasal airway. Inhalation Toxicology. 2001;13:109–127. doi: 10.1080/089583701300001050. [DOI] [PubMed] [Google Scholar]
- 26.Cheng YS, Holmes TD, Gao J, Guilmette RA, Li S, Surakitbanharn Y, Rowlings C. Characterization of nasal spray pumps and deposition pattern in a replica of human nasal airway. Journal of Aerosol Medicine. 2001;14(2):267–280. doi: 10.1089/08942680152484199. [DOI] [PubMed] [Google Scholar]
- 27.Su WC, Wu J, Cheng YS. Deposition of man-made fiber in a human nasal airway. Aerosol Science Technology. 2008;42:173–181. [Google Scholar]
- 28.Cheng YS, Smith SM, Yeh HC. Deposition of ultrafine particles in human tracheobronchial airways. The Annals of Occupational Hygiene. 1997;41(S1):714–718. [Google Scholar]
- 29.Zhou Y, Su WC, Cheng YS. Fiber deposition in the tracheobronchial region: Deposition equations. Inhalation Toxicology. 2008;20(13):1191–1198. doi: 10.1080/08958370802233082. [DOI] [PubMed] [Google Scholar]
- 30.Cheng YS, Zhou Y, Chen BT. Particle deposition in a cast of human oral airways. Aerosol Science Technology. 1999;31:286–300. [Google Scholar]
- 31.Su WC, Cheng YS. Deposition of Man-Made Fibers in Human Respiratory Airway Casts. Journal of Aerosol Science. 2009;40(3):270–284. [Google Scholar]
- 32.NCRP: National council on radiation protection and measurement: deposition, retention and dosimetry of inhaled radioactive substances, NCRP Report No. 125. National Council on Radiation Protection and Measurement; Bethesda, MD: 1997. [Google Scholar]
- 33.Su WC, Cheng YS. Fiber deposition pattern in two human respiratory tract replicas. Inhalation Toxicology. 2006;18:749–760. doi: 10.1080/08958370600748513. [DOI] [PubMed] [Google Scholar]
- 34.Cheng KH, Cheng YS, Yeh HS, Swift DL. Deposition of ultrafine aerosols in the head airways during natural breathing and during simulated breath holding using replicate human upper airway casts. Aerosol Science Technology. 1995;23:465–474. [Google Scholar]
- 35.Kelly JT, Asphgrian B, Kimbell JS, Wong BA. Particle deposition in human nasal airway replicas manufactured by different methods. Part II: Ultrafine particles. Aerosol Science Technology. 2004;38:1072–1079. [Google Scholar]
- 36.Ku BK, Emery MS, Maynard AD, Stolzenburg MR, McMurry PH. In situ structure characterization of airborne carbon nanofibers by a tandem mobility-mass analysis. Nanotechnology. 2006;16:3613–3621. doi: 10.1088/0957-4484/17/14/042. [DOI] [PubMed] [Google Scholar]


