

Abstract
Objective
Obstructive sleep apnea (OSA) is common among candidates for bariatric surgery. OSA and its associated intermittent hypoxia have been implicated in the pathogenesis of nonalcoholic fatty liver disease (NAFLD) and nonalcoholic steatohepatitis. A large cohort of bariatric surgery patients was studied in an effort to explore the relationship between OSA severity, hypoxia, metabolic syndrome, and the severity of NAFLD.
Methods
Bariatric surgery candidates who underwent both polysomnography and liver biopsy were studied. The severity of OSA as determined by the apnea-hypopnea index (AHI) and parameters of hypoxia was studied in relation to extent of abnormalities of liver histology as measured by the presence of hepatic steatosis, inflammation, and fibrosis.
Results
The study cohort included 362 patients with a mean age of 46.2 years and BMI of 49.9 kg/m2. On the basis of AHI, 26% of the cohort had no OSA, 32% mild OSA, 22% moderate OSA, and 20% severe OSA. For the study subjects without metabolic syndrome, positive correlations were found between OSA severity, as measured by AHI, and parameters of hypoxia, with the severity of NAFLD.
Conclusions
OSA severity and its accompanying hypoxia are associated with the severity of NAFLD.
Introduction
Nonalcoholic fatty liver disease (NAFLD) is currently the leading cause of chronic liver disease in the world, affecting 25–30% of the general population and up to 60–70% in obesity (1). NAFLD includes a spectrum of histologic liver alterations, ranging from simple fatty deposition or steatosis to steatosis associated with hepatocellular injury, inflammation, and fibrosis, collectively termed nonalcoholic steatohepatitis (NASH). Steatosis alone is generally considered a benign condition, but NASH is an established risk factor for advanced liver disease including cirrhosis, liver failure, and hepatocellular cancer (2).
NAFLD is also a risk factor for cardiovascular disease and endothelial dysfunction, and its severity in obesity is directly related to the degree of metabolic dysfunction, extent of visceral fat, insulin resistance, and components of the metabolic syndrome (3). The exact role of NAFLD and how it contributes to the cardiovascular risk associated with obesity and metabolic dysfunction remain unclear.
Obstructive sleep apnea (OSA) is a respiratory disorder characterized by intermittent and recurring collapse of the upper airway during sleep, which results in poor quality and disrupted sleep, daytime somnolence, and chronic intermittent hypoxia (CIH) (4,5). OSA is fairly common, with recent estimates suggesting that 34% of men and 17% of women aged 30–70 have at least mild OSA (apnea-hypopnea index [AHI] ≥ 5) and that an estimated 13% and 6%, respectively, suffer from moderate or severe disease (AHI ≥ 15) (6). The prevalence of OSA increases in direct relationship with increases in body weight and body mass index (BMI) (7). Currently, about 40% of candidates for obesity surgery require treatment for OSA (4,8,9). OSA is also associated with abnormalities of insulin resistance (10) and glucose metabolism (11), and it has been postulated to be a contributor to NAFLD (12–14). A number of recent studies have suggested that the chronic and recurrent hypoxia associated with OSA may contribute to the pathogenesis of NAFLD and NASH (15,16). However, to differentiate the effects of metabolic syndrome and OSA on NAFLD severity in clinical studies has been challenging because these comorbid conditions commonly coexist, especially in severe obesity (17). The relationship between OSA and NAFLD in the absence of metabolic syndrome is unknown. The aim of this study was, therefore, to explore the relationship between OSA and its associated hypoxia on both the extent and severity of changes in liver histology in a large cohort of patients with severe obesity (mean BMI: 49.9 ± 9.4 kg/m2). Furthermore, in order to gain insight into the association between OSA and NAFLD in otherwise metabolically healthy subjects with severe obesity, the cohort was stratified by presence or absence of metabolic syndrome.
Methods
Study population
Patients enrolled in the bariatric surgery program at the Geisinger Center for Weight Management are offered participation in an IRB approved obesity research program, which involves collection of clinical data during the preoperative preparation phase, as well as liver biopsy at the time of bariatric surgery and subsequent histopathology. The exact details of the electronic extraction of clinical and tissue data for research purposes have been previously described (18). This study was reviewed and approved by the Geisinger Institutional Research Review board. All patients provided their consent for this study.
Electronic medical records (EMR) were retrospectively reviewed to identify 362 individuals who underwent bariatric surgery between November 2006 and October 2014 with an intraoperative wedge liver biopsy and had available polysomnography results within the year prior to surgery. Study patients were further analyzed according to age, gender, BMI, and the presence of diabetes, dyslipidemia, and hypertension, Study patients were stated to have the metabolic syndrome if they had extreme obesity and the presence of any two of the following International Diabetes Federation criteria: elevated triglyceride level; reduced HDL cholesterol level; hypertension; elevated fasting plasma glucose level (19). Analysis of study patients also included liver histology including the presence of steatosis, lobular inflammation, and fibrosis.
Sleep study results
Bariatric surgery candidates are referred for polysomnography if OSA is suspected on the basis of clinical evaluation. Polysomnography results for study subjects were extracted from clinical sleep reports and any patients who were using continuous positive airway pressure (CPAP) during the polysomnography were excluded from this study. Sleep study results were manually extracted between January 2006 and December 2008 and were available electronically from January 2009 to October 2014. A representative subset of sleep studies occurring after 2009 was chart reviewed by study investigators in order to verify that the electronic data reported agreed with the manually extracted sleep results and that patients using CPAP at time of polysomnography were excluded. The study team and sleep specialists identified a set of sleep-related outcome variables to be included in this analysis. This list was developed after reviewing sleep study reports to determine which data were available during both time periods. These items included:
AHI: an index used to indicate the severity of sleep apnea, which is defined as the number of apnea and hypopnea events per hour of sleep. An apnea is a pause in breathing lasting 10 or more seconds and associated with a decrease in oxygen saturation. A hypopnea is a reduction in ventilation of ≥ 50% which lasts at least 10 seconds.
Oxygen saturation (SaO2) parameters: nadir and mean SaO2 during sleep.
The severity of OSA was defined using the level of AHI (<5 = none; 5–14 = mild; 15–29 = moderate; ≥30 = severe). Oxygen desaturation was defined using two measures of oxygen saturation, including the nadir (or lowest) SaO2 and the mean SaO2 recorded during sleep. The SaO2 results were categorized into groups based on tertiles of the distribution.
Liver histology
Intraoperative wedge biopsies of the liver are collected during bariatric surgery from the left liver lobe as part of clinical standard of care. The liver samples are fixed in neutral buffered formalin and stained with hematoxylin and eosin. The biopsy is sent to a clinical pathologist for histological evaluation of steatosis/fibrosis. A second unbiased pathologist reviewed the histology for study patients in order to confirm the initial grading. For this study, NASH Clinical Research Network (CRN) criteria were used to identify the presence of fatty liver (steatosis grade 1+, ≥5% of hepatocytes affected), the presence of lobular inflammation (>0 foci per 200× field), and the presence of fibrosis (any perisinusoidal fibrosis, portal fibrosis, bridging fibrosis, or cirrhosis) (20).
Statistical analysis
Demographic characteristics, the presence of metabolic comorbidities, and transaminase levels were compared between levels of NAFLD and OSA severity using ANOVA and chi-square tests. The associations between sleep study measures and results of liver histology were evaluated using logistic regression models that adjusted for age, gender, and BMI. Separate models were conducted using each of the three liver histology outcomes (including steatosis, lobular inflammation, and fibrosis) as the dependent variable. In preliminary analyses, the severity of liver histology (e.g., normal, Grade 1, Grade 2, Grade 3) was evaluated but not presented for simplicity, because the dichotomized outcomes provided results similar to those expressed. For each category of liver histology, separate logistic regression models were conducted for each of the three selected sleep study results including AHI (categorized as none, mild, moderate, and severe), lowest SaO2 (categorized using tertiles), and mean SaO2 (categorized using tertiles). Sensitivity analyses were conducted to verify that the categorized version of the sleep study variables resulted in findings consistent with the continuous versions of the sleep study variables. The above analyses were completed after stratifying the study patients into those with and without Metabolic Syndrome. For each logistic regression model, the corresponding adjusted sleep parameter estimates were used to calculate the predicted probability of steatosis, lobular inflammation, and fibrosis across the categorized sleep variables. Statistical significance was tested using a test of trend across the categorized sleep variables. SAS version 9.4 was used for statistical analyses and P-values <0.05 were considered significant.
Results
There were 362 patients that met the study inclusion criteria. These patients had a mean age of 46.2 (range = 18–75), 79% were female (n = 287), 96% were Caucasian (n = 349), and the mean BMI was 49.9 kg/m2 (range = 35–91). Normal liver histology was present in 18% (n = 64) of the patients. The remaining patients had various levels of NAFLD including 160 (44%) with steatosis only (i.e., without lobular inflammation and without fibrosis) and another 138 (38%) had inflammation and/or fibrosis, 44 with lobular inflammation only, and 94 with some degree of fibrosis (n = 74 with stage 1, n = 9 with stage 2, n = 4 with stage 3, and n = 7 with cirrhosis). The more severe variants of NAFLD were associated with higher prevalence of metabolic comorbidities, particularly diabetes, hypertriglyceridemia, low HDL, and metabolic syndrome (Table 1). NAFLD extent was not significantly associated with age, gender, or BMI, but was significantly associated with transaminase levels.
TABLE 1.
Profile of sleep study population by liver histology status
| Normal, N = 64 | Steatosis only, N = 160 | Inflammation and/or fibrosis, N = 138 | P-valuea | ||
|---|---|---|---|---|---|
| Age | Mean (SD) [range] |
45.1 (12.6) [23, 75] |
46.1 (10.6) [18, 68] |
46.8 (10.3) [24, 70] |
0.602 |
| Gender | Male, % (n) | 22% (n = 14) | 17% (n = 27) | 25% (n = 34) | 0.249 |
| Female, % (n) | 78% (n = 50) | 83% (n = 133) | 75% (n = 104) | ||
| BMI | Mean (SD) [range] |
49.0 (9.2) [37.1, 82.3] |
49.7 (8.6) [36.0, 80.3] |
50.5 (10.3) [35.0, 91.1] |
0.548 |
| Comorbidity | Diabetes, % (n) | 28% (n = 18) | 33% (n = 52) | 46% (n = 63) | 0.018 |
| HTN, % (n) | 50% (n = 32) | 65% (n = 104) | 62% (n = 86) | 0.109 | |
| Low HDL, % (n) | 45% (n = 29) | 60% (n = 96) | 65% (n = 90) | 0.027 | |
| High trig, % (n) | 36% (n = 23) | 36% (n = 57) | 51% (n = 70) | 0.019 | |
| Metabolic syndromeb | Yes, % (n) | 52% (n = 33) | 64% (n = 103) | 78% (n = 107) | 0.0008 |
| No, % (n) | 48% (n = 31) | 36% (n = 57) | 22% (n = 31) | ||
| ALT | Mean (SD) [Range] |
24.6 (12.5) [12, 86] |
29.8 (15.9) [8, 129] |
36.0 (22.6) [7, 159] |
0.0001 |
| AST | Mean (SD) [Range] |
23.0 (8.2) [14, 51] |
26.0 (12.0) [11, 105] |
29.9 (22.6) [11, 101] |
0.0008 |
Steatosis only includes subjects with fatty liver but no inflammation and no fibrosis.
Inflammation and/or fibrosis includes subjects with any grade of inflammation and/or any grade of fibrosis.
P-values resulted from ANOVA (for comparison of means) and chi-square test (for comparing percentages).
Defined using IDF criteria for metabolic syndrome.
The distribution of OSA severity included 26% with no OSA (N = 93, AHI < 5), 32% with mild OSA (n = 115, AHI 5–14), 22% with moderate OSA (n = 80, AHI 15–29), and 20% with severe OSA (n = 74, AHI 30+). More severe OSA was associated with older age, male gender, and higher BMI (Table 2). Though not significant, those study patients with more severe OSA tended to have higher rates of diabetes, hypertension, and metabolic syndrome. There was no association between transaminase levels and degree of OSA severity.
TABLE 2.
Profile of sleep study population by OSA status
| No OSA, AHI < 5, N = 93 | Mild OSA, AHI 5–14, N = 115 | Moderate OSA, AHI 15–29, N = 80 | Severe OSA, AHI 30+, N = 74 | P-valuea | ||
|---|---|---|---|---|---|---|
| Age | Mean (SD) [range] |
41.3 (9.5) [23, 65] |
46.7 (11.0) [24, 75] |
48.8 (10.7) [18, 72] |
48.7 (10.5) [29, 71] |
<0.0001 |
| Gender | Male, % (n) | 11% (n = 10) | 13% (n = 15) | 20% (n = 16) | 46% (n = 34) | <0.0001 |
| Female, % (n) | 89% (n = 83) | 87% (n = 100) | 80% (n = 64) | 54% (n = 40) | ||
| BMI | Mean (SD) [range] |
46.8 (7.5) [35.1, 69.5] |
48.9 (8.9) [35.0, 91.1] |
50.9 (9.0) [35.5, 76.0] |
54.2 (11.0) [37.5, 82.3] |
<0.0001 |
| Comorbidity | Diabetes, % (n) | 35% (n = 33) | 31% (n = 36) | 38% (n = 30) | 46% (n = 34) | 0.236 |
| HTN, % (n) | 51% (n = 47) | 63% (n = 73) | 65% (n = 52) | 68% (n = 50) | 0.091 | |
| Low HDL, % (n) | 59% (n = 55) | 60% (n = 69) | 61% (n = 49) | 57% (n = 42) | 0.951 | |
| High trig, % (n) | 34% (n = 32) | 44% (n = 51) | 50% (n = 40) | 36% (n = 27) | 0.141 | |
| Metabolic syndromeb | Yes, % (n) | 60% (n = 56) | 64% (n = 74) | 73% (n = 58) | 74% (n = 55) | 0.158 |
| No, % (n) | 40% (n = 37) | 36% (n = 41) | 27% (n = 22) | 26% (n = 19) | ||
| ALT | Mean (SD) [Range] |
30.0 (17.5) [8, 129] |
28.8 (18.1) [11, 159] |
32.5 (15.2) [11, 76] |
35.2 (23.4) [7, 156] |
0.105 |
| AST | Mean (SD) [Range] |
26.2 (11.9) [11, 97] |
25.3 (11.5) [11, 101] |
28.5 (15.6) [15, 105] |
28.6 (23.4) [14, 90] |
0.212 |
P-values resulted from ANOVA (for comparison of means) and chi-square test (for comparing percentages).
Defined using IDF criteria for metabolic syndrome.
Association between NAFLD and OSA severity
The relationship between level of AHI and severity of NAFLD after adjustment for age, gender and BMI is shown in Figure 1. The percent of patients with lobular inflammation increases stepwise with AHI quartiles for patients without metabolic syndrome (linear trend P = 0.011). For those with metabolic syndrome, there were no significant associations between liver histology and AHI level.
Figure 1.
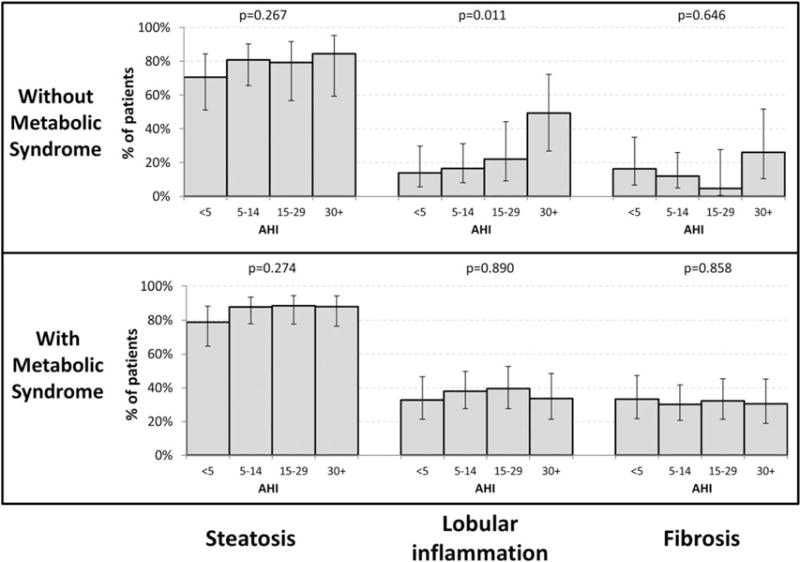
Association between AHI and liver histology in patients with and without metabolic syndrome. P-values test for trend across OSA severity and are adjusted for age, gender, and BMI.
Association between NAFLD and oxygen desaturation parameters
For those study patients without metabolic syndrome, there was a trend demonstrating that a lower nadir SaO2 is associated with increasing prevalence of lobular inflammation (Figure 2, P = 0.054). In this same subgroup, a lower mean SaO2 was significantly associated with increased prevalence of lobular inflammation (Figure 3, P = 0.0003) and fibrosis (P = 0.0030). Although not significant, there was a trend associating a lower mean SaO2 with an increased prevalence of steatosis (P = 0.052). For those study subjects with metabolic syndrome, neither nadir SaO2 nor mean SaO2 were associated with liver histology (Figures 2 and 3).
Figure 2.
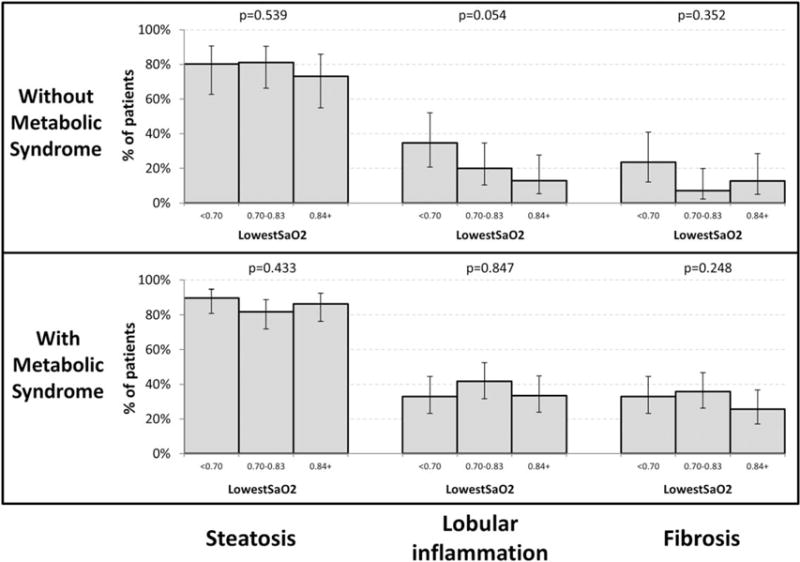
Association between lowest SaO2 and liver histology in patients with and without metabolic syndrome. P-values test for trend across OSA severity and are adjusted for age, gender, and BMI.
Figure 3.
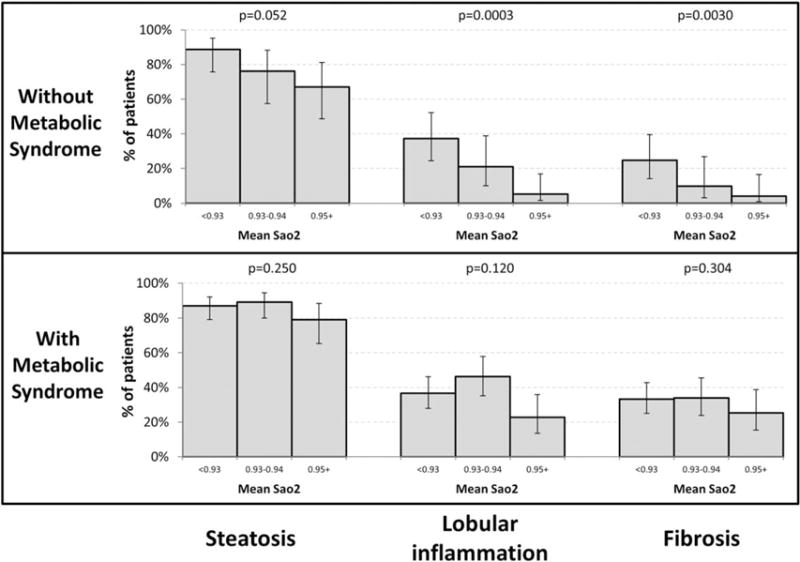
Association between mean SaO2 and liver histology in patients with and without metabolic syndrome. P-values test for trend across OSA severity and are adjusted for age, gender, and BMI.
Discussion
This study is the largest detailed analysis to date addressing the association between the severity of liver histology in NAFLD, parameters of OSA severity, and hypoxia. We found that OSA severity was associated with NAFLD liver histology only in patients without metabolic syndrome. This finding confirms the growing body of evidence demonstrating that that the severity of OSA and the extent of its associated intermittent hypoxia may be linked with the pathogenesis of NASH and liver fibrosis in NAFLD. The powerful clinical association between the metabolic syndrome and its components with NAFLD severity found in this cohort is consistent with the findings of others (3,21), thus validating this cohort as representative of patients with severe obesity. In addition, the prevalence of OSA patients, the spectrum of OSA severity, and the clinical factors associated with OSA found in our study cohort are consistent with findings of others in bariatric surgery candidates (9).
The unique anatomic and physiologic features of the liver circulation, as well as the vulnerability of liver cells surrounding the liver central veins to hypoxia, have been well described (22,23). Mice exposed to a hypoxic environment demonstrate the impact of hepatic hypoxia on liver metabolism and liver injury resulting in NASH progression (24,25). Earlier clinical studies with small numbers of patients referred for polysomnography because of the suspicion of OSA have suggested an association between OSA and elevated levels of hepatocellular enzymes (26), as well as an association between oxygen desaturation during sleep and NAFLD diagnosed by biomarkers and CT (27).
More recently, larger studies in patients with extreme obesity who underwent polysomnography followed by bariatric surgery and liver biopsy have demonstrated an association between OSA severity, chronic intermittent hypoxia, and NASH (11–15,28,29). The growing body of evidence from these studies suggests that chronic intermittent hypoxia occurring with more severe OSA may be among the liver insults contributing to the pathogenesis of NASH and its associated liver fibrosis. Insulin resistance and abnormal fatty acid metabolism are known contributors to the development of hepatic steatosis, and OSA is independently associated with insulin resistance (12). Episodic hypoxia in this setting may constitute an additional insult resulting in progression to steatohepatitis and fibrosis. It is noteworthy that the impact of hypoxia on the extent of liver disease in our study is only found in our patients without metabolic syndrome. The effects of metabolic syndrome on NAFLD severity are well established (30), and the attempt to control for metabolic syndrome in our study by conducting an independent analysis in patients without metabolic syndrome may have unmasked the effects of hypoxia. It seems that the effects of metabolic syndrome on NAFLD severity are so powerful that OSA adds no additional effect.
Possible mechanisms for additional liver injury from chronic intermittent hypoxia include the formation of reactive oxygen species, which cause lipid peroxidation and hepatocyte injury (31). In addition, hypoxia may be a stimulus for the production of proinflammatory adipokines from adipose tissue in obesity and possibly from other tissues as inflammatory cytokine levels are increased in OSA (12,16,32).
Our finding that OSA severity and parameters of severe hypoxia are associated with a higher prevalence of lobular inflammation and fibrosis only in the absence of metabolic syndrome is of particular interest. Specifically, in the patients without metabolic syndrome, as AHI and hypoxia increase in severity, the prevalence of the more severe NAFLD variants increases significantly. However, in the cohort with metabolic syndrome, the effect of hypoxia appears overwhelmed by the strong influence of metabolic syndrome on NAFLD severity. We hypothesize that the effects of OSA on fatty liver disease constitute a separate source of liver injury that may involve biologic pathways which may be similar to the mechanisms of liver injury occurring with metabolic syndrome. It is also of interest to note that patients in this cohort without metabolic syndrome tended to have less severe OSA and still had impact on NAFLD extent.
Although the lowest SaO2, and to a lesser extent, AHI did correlate with the prevalence of lobular inflammation, we did not find a statistically significant relationship between the lowest SaO2 and AHI with the prevalence of fibrosis. However, the highest risk groups (AHI 301 and Lowest SaO2) had the highest prevalence of fibrosis, suggesting that an association may exist. The lack of a significant result may be related to insufficient statistical power due to the relatively small number of patients with fibrosis in the cohort and the smaller effect size. Possible explanations for this probably relate to insufficient statistical power because of the relatively small number of patients with fibrosis in the cohort and the clear trend toward the most severe group having the most fibrosis for each sleep item studied.
This study confirms the findings of others that OSA and chronic intermittent hypoxia may be linked with the pathogenesis of the more severe variants of NAFLD. Possible weaknesses in this study include the failure to include the Oxygen Desaturation Index (ODI), an important marker of the severity of OSA (16,33), in these analyses. ODI (the number of times per hour of sleep that the blood oxygen level drops by ≥ 3% from baseline) is an important marker of the severity of OSA, and has been shown to be directly related to the prevalence of NASH and liver fibrosis (16). However, the major focus in this study was on the severity of OSA and not on the event rate.
In addition, although the methodology in this study was designed to exclude patients with OSA who were stable on continuous positive airway pressure, we did not assess CPAP compliance in this study. The use of CPAP has been shown to lessen the effects of OSA and potentially nullify or reduce the effects of hypoxia on NAFLD. Others have considered CPAP compliance as an exclusion criterion in studies of OSA and NAFLD and have demonstrated a dose-response relationship between the extent of hypoxia as determined by ODI and the severity of liver histology (12).
Additional possible study weaknesses include the failure to control for the important effects of visceral obesity, which may be more important than BMI in assessment of obesity risks. In this study, the inclusion of a composite NASH endpoint in the analysis of liver histology was omitted because inconsistencies of NASH definition and criteria for severity have complicated other studies attempting to relate OSA to the pathogenesis of NAFLD. We plan to include a critical analysis of NASH in a future study. Finally, the homogeneity of our patient population (79% females and 96% Caucasian) raises questions as to whether or not these findings are generalizable to more diverse patient populations.
Strengths of this study include the large sample size, the ability to adjust for age, gender, and BMI, the diverse sleep study outcomes subjected to statistical analysis, and the stratification of results by presence of metabolic syndrome.
These results suggest that among patients with severe obesity, screening of OSA patients for NAFLD and NAFLD patients for OSA is clinically indicated and independent of the presence or absence of metabolic syndrome. Future intervention studies in those without metabolic syndrome and OSA need to address whether treatment of OSA can improve linear pathology.
Acknowledgments
Funding agencies: This research was supported by grant DK072488 from the Mid-Atlantic Nutrition Obesity Research Center.
Footnotes
Disclosure: The authors declared no conflict of interest.
References
- 1.Younossi Z, Stepanova M, Afendy M, et al. Changes in the prevalence of the most common causes of chronic liver diseases in the United States from 1988 to 2008. Clin Gastroenterol Hepatol. 2011;9:524–530. doi: 10.1016/j.cgh.2011.03.020. [DOI] [PubMed] [Google Scholar]
- 2.Musso G, Gambino R, Cassader M, Pagano G. Meta-analysis: natural history of non-alcoholic fatty liver disease (NAFLD) and diagnostic accuracy of non-invasive tests for liver disease severity. Ann Med. 2011;43:617–649. doi: 10.3109/07853890.2010.518623. [DOI] [PubMed] [Google Scholar]
- 3.Gerhard G, Benotti P, Wood G, et al. Identification of novel clinical factors associated with hepatic fat accumulation in extreme obesity. J Obes. 2014;2014:368210. doi: 10.1155/2014/368210. [DOI] [PMC free article] [PubMed] [Google Scholar]
- 4.Shah N, Roux F. The relationship of obesity and obstructive sleep apnea. Clin Chest Med. 2009;30:455–465. doi: 10.1016/j.ccm.2009.05.012. [DOI] [PubMed] [Google Scholar]
- 5.Young T, Palta M, Dempsey J, Skatrud J, Weber S, Badr S. The occurrence of sleep-disordered breathing among middle-aged adults. N Engl J Med. 1993;328:1230–1235. doi: 10.1056/NEJM199304293281704. [DOI] [PubMed] [Google Scholar]
- 6.Peppard P, Young T, Barnet J, Palta M, Hagen E, HIa K. Increased prevalence of sleep-disordered breathing in adults. Am J Epidemiol. 2013;177:1006–1014. doi: 10.1093/aje/kws342. [DOI] [PMC free article] [PubMed] [Google Scholar]
- 7.Young T, Palta M, Dempsey J, Skatrud J, Weber S, Badr S. The occurrence of sleep disordered breathing among middle-aged adults. New Engl J Med. 1993;328:1230–1235. doi: 10.1056/NEJM199304293281704. [DOI] [PubMed] [Google Scholar]
- 8.Sareli A, Cantor C, Williams N, et al. Obstructive sleep apnea inn patients undergoing bariatric surgery-a tertiary center experience. Obes Surg. 2011;21:316–327. doi: 10.1007/s11695-009-9928-1. [DOI] [PubMed] [Google Scholar]
- 9.Rasmussen J, Fuller W, Ali M. Sleep apnea syndrome is significantly underdiagnosed in bariatric surgical patients. Surg Obes Rel Dis. 2012;8:569–573. doi: 10.1016/j.soard.2011.06.021. [DOI] [PubMed] [Google Scholar]
- 10.Ip M, Lam B, Ng M, Lam W, Tsang K, Lam K. Obstructive sleep apnea is independently associated with insulin resistance. Am J Respir Crit Care Med. 2002;165:670–676. doi: 10.1164/ajrccm.165.5.2103001. [DOI] [PubMed] [Google Scholar]
- 11.Knutson K, Spiegel K, Penev P, Van Cauter E. The metabolic consequences of sleep deprivation. Sleep Med Rev. 2007;11:163–178. doi: 10.1016/j.smrv.2007.01.002. [DOI] [PMC free article] [PubMed] [Google Scholar]
- 12.Polotsky V, Susheel P, Savransky V, et al. Obstructive sleep apnea, insulin resistance, and steatohepatitis in severe obesity. Am J Respir Crit Care Med. 2009;179:228–234. doi: 10.1164/rccm.200804-608OC. [DOI] [PMC free article] [PubMed] [Google Scholar]
- 13.Sundaram S, Sokol R, Capocelli K, et al. Obstructive sleep apnea and hypoxemia are associated with advanced liver histology in pediatric nonalcoholic fatty liver disease. J Pediatr. 2014;164:699–706. doi: 10.1016/j.jpeds.2013.10.072. [DOI] [PMC free article] [PubMed] [Google Scholar]
- 14.Corey K, Misdraji J, Gelrud L, et al. Obstructive sleep apnea is associated with nonalcoholic steatohepatitis and advanced liver histology. Dig Dis Sci. 2015 doi: 10.1007/s10620-015-3650-8. [DOI] [PMC free article] [PubMed] [Google Scholar]
- 15.Musso G, Olivetti C, Cassader M, Gambino R. Obstructive sleep apnea-hypopnea syndrome and nonalcoholic fatty liver disease: emerging evidence and mechanisms. Semin Liver Dis. 2012;32:49–64. doi: 10.1055/s-0032-1306426. [DOI] [PubMed] [Google Scholar]
- 16.Aron-Wisnewsky J, Minville C, Tordjman J, et al. Chronic intermittent hypoxia is a major trigger for non-alcoholic fatty liver disease in morbid obese. J Hepatol. 2012;56:225–233. doi: 10.1016/j.jhep.2011.04.022. [DOI] [PubMed] [Google Scholar]
- 17.Weingarten T, Mantilla C, Swain J, et al. nonalcoholic steatohepatitis in bariatric patients with a diagnosis of obstructive sleep apnea. Obes Facts. 2012;5:587–596. doi: 10.1159/000342677. [DOI] [PMC free article] [PubMed] [Google Scholar]
- 18.Wood GC, Chu X, Manney C, et al. An electronic health record-enabled obesity database. BMC Med Informatics Dec Mak. 2012;12:45. doi: 10.1186/1472-6947-12-45. [DOI] [PMC free article] [PubMed] [Google Scholar]
- 19.Alberti KG, Zimmet P, Shaw J. Metabolic syndrome-a new world-wide definition. A Consensus Statement from the International Diabetes Federation. Diabet Med. 2006;23:469–480. doi: 10.1111/j.1464-5491.2006.01858.x. [DOI] [PubMed] [Google Scholar]
- 20.Kleiner DE, Brunt EM, Van Natta M, et al. Design and validation of a histological scoring system for nonalcoholic fatty liver disease. Hepatology. 2005;41:1313–1321. doi: 10.1002/hep.20701. [DOI] [PubMed] [Google Scholar]
- 21.Chalasani N, Younossi Z, Lavine J, et al. The diagnosis and management of nonalcoholic fatty liver disease: Practice Guideline by the American Gastroenterological Association, American Association for the Study of Liver Diseases, and American College of Gastroenterology. Gastroenterology. 2012;142:1592–1609. doi: 10.1053/j.gastro.2012.04.001. [DOI] [PubMed] [Google Scholar]
- 22.Jungermann K, Kietzmann T. Oxygen: modulator of metabolic zonation and disease of the liver. Hepatology. 2000;31:255–260. doi: 10.1002/hep.510310201. [DOI] [PubMed] [Google Scholar]
- 23.Broughan T, Naukam R, Tan C, Van De Wiele C, Refai H, Teague K. Effects of hepatic zonal oxygen levels on hepatocyte stress responses. J Surg Res. 2008;145:150–160. doi: 10.1016/j.jss.2007.04.014. [DOI] [PubMed] [Google Scholar]
- 24.Piguet A, Stroka D, Zimmerman A, Dufour J. Hypoxia aggravates non-alcoholic steatohepatitis in mice lacking hepatocellular PTEN. Clin Sci (London) 2010;118:401–410. doi: 10.1042/CS20090313. [DOI] [PubMed] [Google Scholar]
- 25.Reinke C, Bevans-Fonti S, Drager L, Shin M, Polotsky V. Effect of different acute hypoxic profiles on tissue oxygen profiles and metabolic outcomes. J Appl Physiol. 2011;111:881–890. doi: 10.1152/japplphysiol.00492.2011. [DOI] [PMC free article] [PubMed] [Google Scholar]
- 26.Tanne F, Gagnadouz F, Chazouilleres O, Fleury B, Wendum D. Chronic liver injury during sleep apnea. Hepatology. 2005;41:1290–1296. doi: 10.1002/hep.20725. [DOI] [PubMed] [Google Scholar]
- 27.Tatsumi K, Saibara T. Effects of obstructive sleep apnea on hepatic steatosis and non alcoholic steatohepatitis. Hepatol Res. 2005;33:100–104. doi: 10.1016/j.hepres.2005.09.014. [DOI] [PubMed] [Google Scholar]
- 28.Misra P, Nugent C, Afendy A, et al. Apnoeic-hypopnoeic episodes during obstructive sleep apnoea are associated with histological nonalcoholic steatohepatitis. Liver Int. 2008;28:1080–1086. doi: 10.1111/j.1478-3231.2008.01822.x. [DOI] [PubMed] [Google Scholar]
- 29.Turkay C, Ozol D, Kasapoglu B, Kirbas I, Yldirim Z, Yigitoglu R. Influence of obstructive sleep apnea on fatty liver disease: role of chronic intermittent hypoxia. Respir Care. 2012;57:244–249. doi: 10.4187/respcare.01184. [DOI] [PubMed] [Google Scholar]
- 30.Rinella M. Nonalcoholic fatty liver disease: a systematic review. JAMA. 2015;313:2263–2273. doi: 10.1001/jama.2015.5370. [DOI] [PubMed] [Google Scholar]
- 31.Madan K, Bhardwaj P, Thareja S, Gupta S, Saraya A. Oxidant stress and antioxidant status among patients with nonalcoholic fatty liver disease (NAFLD) J Clin Gastroenterol. 2006;40:930–935. doi: 10.1097/01.mcg.0000212608.59090.08. [DOI] [PubMed] [Google Scholar]
- 32.Steiropoulos P, Papanas NEN, Antoniadou M, et al. Inflammatory markers in middle-aged obese subjects: does obstructive sleep apnea syndrome play a role? Mediators Inflamm. 2010;2010:675320. doi: 10.1155/2010/675320. [DOI] [PMC free article] [PubMed] [Google Scholar]
- 33.Chung F, Liao P, Elsaid H, Islam S, Shapiro C, Sun Y. Oxygen desaturation index from nocturnal oximetry: a sensitive and specific tool to detect sleep-disordered breathing in surgical patients. Anesth Analg. 2012;114:993–1000. doi: 10.1213/ANE.0b013e318248f4f5. [DOI] [PubMed] [Google Scholar]